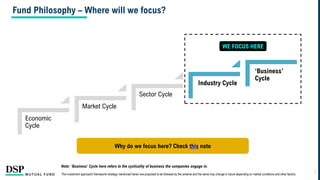
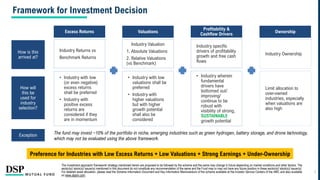
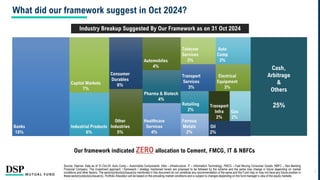
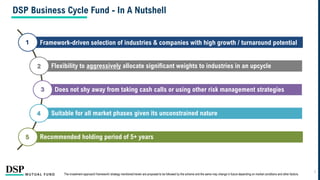
An open ended equity scheme following business cycles based investing theme
Focusing on Industry Cycles
DSP Business Cycle Fund
27-Nov-24 to 11-Dec-24
NFO Period
Fund Philosophy – Where will we focus?
Economic
Cycle
Market Cycle
Sector Cycle
Industry Cycle
‘Business’
Cycle
WE FOCUS HERE
2
The investment approach/ framework/ strategy mentioned herein are proposed to be followed by the scheme and the same may change in future depending on market conditions and other factors.
Why do we focus here? Check this note
Note: ‘Business’ Cycle here refers to the cyclicality of business the companies engage in.
DSP Business Cycle Fund – Focused On Identifying Strong Industry Cycles
3
The investment approach/ framework/ strategy mentioned herein are proposed to be followed by the scheme and the same may change in future depending on market conditions and other factors.
Large caps are defined as top 100 stocks on market capitalization, mid caps as 101-250, small caps as 251 and above. Micro caps denote top 250 small cap companies beyond the Nifty 500
constituents.
• Unconstrained by
market cap & can
include companies
from
• Large caps
• Mid caps
• Small caps
• Micro caps
Wide Investment
Universe
• Grouping
investment
universe into
various broader
sectors
Sector Grouping
• Evaluation done at
industry level
wherever
applicable
• Prefer Industries
near bottom of
cycle with the
potential for strong
growth and
improvement in
financials
Industry Grouping
& Analysis
• Dedicated Forensic
Analyst to identify
companies with
weak corporate
governance
• Such companies
shall be excluded
even if they have
strong growth
expectations
Forensic Exclusion
• Identifying stocks
from industries
which have high
growth potential,
improving
fundamentals &
higher potential
upside
• Such stocks shall
be given higher
weights
Active Stock Picking
Framework for Investment Decision
The investment approach/ framework/ strategy mentioned herein are proposed to be followed by the scheme and the same may change in future depending on market conditions and other factors. The
sector(s)/ stock(s)/ issuer(s) mentioned in this document do not constitute any recommendation of the same and the Fund may or may not have any future position in these sector(s)/ stock(s)/ issuer(s).
For detailed asset allocation, please read the Scheme Information Document and Key Information Memorandum of the scheme available at the Investor Service Centers of the AMC and also available
on www.dspim.com.
Preference for Industries with Low Excess Returns + Low Valuations + Strong Earnings + Under-Ownership
Excess Returns Valuations
Industry Returns vs
Benchmark Returns
Industry Valuation
1. Absolute Valuations
2. Relative Valuations
(vs Benchmark)
How is this
arrived at?
• Industry with low
(or even negative)
excess returns
shall be preferred
• Industry with
positive excess
returns are
considered if they
are in momentum
• Industry with low
valuations shall be
preferred
• Industry with
higher valuations
but with higher
growth potential
shall also be
considered
How will
this be
used for
industry
selection?
Profitability &
Cashflow Drivers
Industry specific
drivers of profitability
growth and free cash
flows
• Industry wherein
fundamental
drivers have
bottomed out/
improving/
continue to be
robust with
visibility of strong,
SUSTAINABLE
growth potential
Industry Ownership
Ownership
Limit allocation to
over-owned
industries, especially
when valuations are
also high
Exception
4
The fund may invest ~10% of the portfolio in niche, emerging industries such as green hydrogen, battery storage, and drone technology,
which may not be evaluated using the above framework.
Framework for Portfolio Construction
The investment approach/ framework/ strategy mentioned herein are proposed to be followed by the scheme and the same may change in future depending on market conditions and other factors.
Portfolio Allocation will be based on the prevailing market conditions and is subject to changes depending on the fund manager’s view of the equity markets.
5
Industry Cycle
Potential Upside
Portfolio Construct
Liquidity
• Aggressively positioned to favour industries
entering the upcycle based on the framework
• Stocks (that pass our forensic filter) from
industries with higher growth potential,
improving fundamentals & higher potential
upside shall be given higher weights
• Weights shall be normalized considering risk &
portfolio diversification
• Final allocation shall also be subject to liquidity
of stock
0%
allocation to
sectors / industries
which are very
unattractive based
on our framework,
irrespective of their
significance in the
benchmark
DSP Business Cycle Fund
• Exposure when equity
market opportunities
are scarce and REITs /
InvITs offer attractive
yields
• Up to 10% of portfolio
• Hedge using Put
options during periods
of high valuations/
significant events
• No put hedge when
the cost to benefit
(premium vs potential
gain) is unfavorable
• May increase cash
holdings when
valuations are
expensive,
opportunities are
scarce, or the outlook
is negative
• Maximum cash
allocation up to 20%
• Proxy for cash used to
hedge equity risk
• Hedge only for stocks
with active futures &
options market
Risk Management Via Portfolio Hedging
Put
Options
Cash
calls
Arbitrage
REITs &
InvITs
Given the aggressive positioning across industries, the potential downsides can be higher especially when
the investment thesis does not play out as expected.
6
The investment approach/ framework/ strategy mentioned herein are proposed to be followed by the scheme and the same may change in future depending on market conditions and other factors.
For detailed asset allocation, please read the Scheme Information Document and Key Information Memorandum of the scheme available at the Investor Service Centers of the AMC and also
available on www.dspim.com.
The fund may employ the below risk management tools to mitigate this downside risk
What did our framework suggest in Oct 2024?
Source: Internal. Data as of 31-Oct-24. Auto Comp – Automobile Components. Infra – Infrastructure. IT – Information Technology. FMCG – Fast Moving Consumer Goods. NBFC – Non-Banking
Financial Company. The investment approach / framework / strategy mentioned herein are proposed to be followed by the scheme and the same may change in future depending on market
conditions and other factors. The sector(s)/stock(s)/issuer(s) mentioned in this document do not constitute any recommendation of the same and the Fund may or may not have any future position in
these sector(s)/stock(s)/issuer(s). Portfolio Allocation will be based on the prevailing market conditions and is subject to changes depending on the fund manager’s view of the equity markets.
7
Industry Breakup Suggested By Our Framework as on 31 Oct 2024
Our framework indicated ZERO allocation to Cement, FMCG, IT & NBFCs
Cash,
Arbitrage
&
Others
25%
What did our framework suggest in Oct 2024?
Source: Internal. Data as of 31-Oct-24. EBITDA – Earnings Before Interest, Tax, Depreciation & Amortization. SD – Standard Deviation. The investment approach / framework / strategy mentioned
herein are proposed to be followed by the scheme and the same may change in future depending on market conditions and other factors. Portfolio Allocation will be based on the prevailing market
conditions and is subject to changes depending on the fund manager’s view of the equity markets.
8
Business Cycle
Early Mid Advance Late
Cash, Arbitrage &
Others
Grand
Total
Valuation
Cycle
Attractive - 5% 4% - - 9%
Low 3% 7% 7% 6% - 23%
High 7% 9% 6% 6% - 28%
Excessive 6% 2% 1% 6% - 15%
Cash, Arbitrage &
Others
- - - - 25% 25%
Grand Total 16% 23% 18% 18% 25% 100%
Business Cycle Stage: Categorization predominantly based on quartile positioning 3-year rolling revenue growth and
EBITDA margins (percentile upto 25th – Early, upto 25-50th – Mid, 50-75th – Advance, above 75th – Late)
Valuation: Categorization predominantly based on valuations relative to history (below -1 SD – Attractive,
-1 SD to Average – Low, Average to +1 SD – High, above +1SD – Excessive)
Business Cycle vs Valuation Breakup Suggested By Our Framework as on 31 Oct 2024
DSP Business Cycle Fund - In A Nutshell
Framework-driven selection of industries & companies with high growth / turnaround potential
Flexibility to aggressively allocate significant weights to industries in an upcycle
Does not shy away from taking cash calls or using other risk management strategies
Suitable for all market phases given its unconstrained nature
Recommended holding period of 5+ years
9
1
2
3
4
5
The investment approach/ framework/ strategy mentioned herein are proposed to be followed by the scheme and the same may change in future depending on market conditions and other factors.
Framework Illustration
10
87%
67%
-50%
0%
50%
100%
150%
200%
Sep-06 Sep-09 Sep-12 Sep-15 Sep-18 Sep-21 Sep-24
Valuation Premium of Auto Ancillaries over Nifty 50 using
trailing 12 month PE
(60)
(30)
-
30
60
90
120
Sep-06 Sep-09 Sep-12 Sep-15 Sep-18 Sep-21 Sep-24
Excess Return of Auto Ancillaries
12 Month Rolling Return Differential (Auto Ancillaries - Nifty)
This is when sector
will be favored for
investment
Illustration – Evaluation of Excess Returns & Valuations
Excess Return is calculated as rolling return difference between Industry & Market.
Industry Valuation Premium is calculated using the percentage difference between valuation ratios of Industry & Market.
This is when sector will be
favored for investment
Source: Bloomberg, Internal. Data as on 30-Sep-24. Auto Ancillaries is represented by companies falling under Auto Components industry as categorized by AMFI. PE - Price to Earnings. The
investment approach/ framework/ strategy mentioned herein are proposed to be followed by the scheme and the same may change in future depending on market conditions and other factors. The
sector(s)/ stock(s)/ issuer(s) mentioned in this document do not constitute any recommendation of the same and the Fund may or may not have any future position in these sector(s)/ stock(s)/ issuer(s).
Past performance may or may not be sustained in future and should not be used as a basis for comparison with other investments. These figures pertain to performance of the index and do
not in any manner indicate the returns/performance of this scheme.
11
Excess return is favorable, but
industry may not be preferred as
valuations are not as favorable
Illustration of Valuation Metrics Used
Source: Internal. Data as on 31-Oct-24. EV – Enterprise Value. EBITDA – Earnings Before Interest, Tax, Depreciation and Amortization. FMCG – Fast Moving Consumer Goods. The investment
approach/ framework/ strategy mentioned herein are proposed to be followed by the scheme and the same may change in future depending on market conditions and other factors. The sector(s)/
stock(s)/ issuer(s) mentioned in this document do not constitute any recommendation of the same and the Fund may or may not have any future position in these sector(s)/ stock(s)/ issuer(s).
Every industry is evaluated on different valuation parameters...
Price to Earnings Price to Book EV to EBITDA
FMCG
Information
Technology
Consumer
Durables
Banks
Utilities
Insurance
Auto
Pharma
Cement
Asset Management
Companies
12
Illustration – Drivers of Profitability & Cashflows
Industry Key Drivers To Understand How The Industry Is Currently Positioned
Banks/ NBFCs PPOP / NIM GNPA / NNPA Credit Growth CASA Ratio
Auto Volume Growth Launch Pipeline Interest Rates Rural Outlook
Consumer Staples Rural Outlook Volume Growth Distribution Expansion Market Share Changes
IT Services Hiring And Attrition Margins Outlook Demand Outlook Offshore / Onshore Mix
Infra & Capital Goods Government Capex
Private Project
Announcements
Capacity Utilization Technology Capability
Materials Global Demand Supply Spreads Capacity Utilization Balance Sheet Strength
Real Estate Affordability Levels Inventory Levels Interest Rates Cash Flow Conversion
Consumer Discretionary Rising Income Levels Increasing Penetration Interest Rates Distribution Expansion
Chemicals Capacity Addition Specialty Chemicals Mix Demand Supply Spreads
Source: Internal. Data as on 31-Oct-24. NBFC – Non-Banking Financial Company. PPOP – Pre-Provision Operating Profit. NIM – Net Interest Margin. GNPA – Gross Non-Performing Assets. NNPA –
Net Non-Performing Assets. CASA – Current Account and Savings Account. The investment approach/ framework/ strategy mentioned herein are proposed to be followed by the scheme and the same
may change in future depending on market conditions and other factors. The sector(s)/ stock(s)/ issuer(s) mentioned in this document do not constitute any recommendation of the same and the Fund
may or may not have any future position in these sector(s)/ stock(s)/ issuer(s).
13
Industry Case Studies
14
Illustration – Pharma & FMCG
Source: IQVIA, Goldman Sachs, Bloomberg, Internal. Data as of 30-Sep-24. FMCG – Fast Moving Consumer Goods. The sector(s)/stock(s)/issuer(s) mentioned in this document do not constitute any
recommendation of the same and the Fund may or may not have any future position in these sector(s)/stock(s)/issuer(s). Past performance may or may not be sustained in future and should not be
used as a basis for comparison with other investments. These figures pertain to performance of the index and do not in any manner indicate the returns/performance of this scheme.
FMCG – Returns tend to have inverse relationship with
inflation expectations
-20%
-10%
0%
10%
20%
30%
40%
1
2
3
4
5
6
7
8
Mar/14
Sep/14
Mar/15
Sep/15
Mar/16
Sep/16
Mar/17
Sep/17
Mar/18
Sep/18
Mar/19
Sep/19
Mar/20
Sep/20
Mar/21
Sep/21
Mar/22
Sep/22
Mar/23
Sep/23
Mar/24
Sep/24
Nifty FMCG - Last 1Y Return (RHS)
India CPI (YoY, %)
Pharma - Improvement in US Generics pricing
environment leads to better future returns
15
-50%
-25%
0%
25%
50%
75%
-20%
-10%
0%
10%
20%
30%
Mar-07
Mar-08
Mar-09
Mar-10
Mar-11
Mar-12
Mar-13
Mar-14
Mar-15
Mar-16
Mar-17
Mar-18
Mar-19
Mar-20
Mar-21
Mar-22
Mar-23
Mar-24
Phase of Price Improvement US Generics Price Change (YoY %)
Nifty Pharma - Next 1Y Return (RHS)
Illustration – Real Estate & Building Materials
Source: Anarock, Bloomberg, Internal. Data as of FY24. RE – Real Estate. The sector(s)/ stock(s)/ issuer(s) mentioned in this document do not constitute any recommendation of the same and the Fund
may or may not have any future position in these sector(s)/ stock(s)/ issuer(s).
-20%
-10%
0%
10%
20%
30%
40%
-30%
-20%
-10%
0%
10%
20%
30%
40%
50%
FY11
FY12
FY13
FY14
FY15
FY16
FY17
FY18
FY19
FY20
FY21
FY22
FY23
FY24
RE Completion Growth
Wood Panel Industry Growth (RHS)
Real Estate Completion Cycle & Building Materials Industry Growth tend to have high positive correlation
-10%
-5%
0%
5%
10%
15%
20%
25%
30%
-30%
-20%
-10%
0%
10%
20%
30%
40%
50%
FY11
FY12
FY13
FY14
FY15
FY16
FY17
FY18
FY19
FY20
FY21
FY22
FY23
FY24
RE Completion Growth
Bathware Industry Growth (RHS)
Tiles Industry Growth (RHS)
16
Source: Bloomberg, BigMint, Internal. Data as of 30-Sep-24. HRC – Hot Rolled Coil. The sector(s)/ stock(s)/ issuer(s) mentioned in this document do not constitute any recommendation of the same and
the Fund may or may not have any future position in these sector(s)/ stock(s)/ issuer(s). Past performance may or may not be sustained in future and should not be used as a basis for
comparison with other investments. These figures pertain to performance of the index and do not in any manner indicate the returns/performance of this scheme.
Indian Steel Price tends to follow credit conditions in China Metals prices are inversely related to US Dollar
-15%
-10%
-5%
0%
5%
10%
15%
20%
-40%
-20%
0%
20%
40%
60%
80%
Sep/94
Sep/96
Sep/98
Sep/00
Sep/02
Sep/04
Sep/06
Sep/08
Sep/10
Sep/12
Sep/14
Sep/16
Sep/18
Sep/20
Sep/22
Sep/24
CRB Metals Index
US Dollar Index (RHS)
-30%
-20%
-10%
0%
10%
20%
30%
40%
50%
60%
70%
20
22
24
26
28
30
32
34
36
Sep/14
Sep/15
Sep/16
Sep/17
Sep/18
Sep/19
Sep/20
Sep/21
Sep/22
Sep/23
Sep/24
Bloomberg China Credit Impulse
India HRC Steel - Next 6M Price Change (RHS)
17
Illustration – Metals
Illustration – Telecom & Agriculture
Agriculture - Output as measured by GVA tends to
follow rainfall levels
-40%
-20%
0%
20%
40%
60%
80%
100%
0
100
200
300
400
500
600
FY04
FY05
FY06
FY07
FY08
FY09
FY10
FY11
FY12
FY13
FY14
FY15
FY16
FY17
FY18
FY19
FY20
FY21
FY22
FY23
FY24
Next 1Y Return (RHS)
ARPU (Rs)
Telecom - Forward Returns are higher when there is
improvement in ARPU
Source: I-Sec, Bloomberg, Internal. Data as of 30-Sep-24. Bharti Airtel numbers are considered for Telecom. ARPU – Average Revenue Per User. LPA – Long Period Average. GVA – Gross Value
Added. The sector(s)/ stock(s)/ issuer(s) mentioned in this document do not constitute any recommendation of the same and the Fund may or may not have any future position in these sector(s)/ stock(s)/
issuer(s). Past performance may or may not be sustained in future and should not be used as a basis for comparison with other investments. These figures pertain to performance of the index
and do not in any manner indicate the returns/performance of this scheme.
-1
0
1
2
3
4
5
6
7
8
85
90
95
100
105
110
115
FY13
FY14
FY15
FY16
FY17
FY18
FY19
FY20
FY21
FY22
FY23
FY24
Rainfall (as a % of LPA)
Agriculture Real GVA (YoY %, RHS)
18
Illustration – Emerging Sector: Defence
Source: MFI Explorer, Ministry of Defence, Internal. Data as of 31-Oct-24. The sector(s)/ stock(s)/ issuer(s) mentioned in this document do not constitute any recommendation of the same and the Fund
may or may not have any future position in these sector(s)/ stock(s)/ issuer(s). Past performance may or may not be sustained in future and should not be used as a basis for comparison with
other investments. These figures pertain to performance of the index and do not in any manner indicate the returns/performance of this scheme.
Defence – Sector came into spotlight after Government’s announcement of localization measures
19
0
1000
2000
3000
4000
5000
6000
7000
8000
9000
10000
Apr-18
Oct-18
Apr-19
Oct-19
Apr-20
Oct-20
Apr-21
Oct-21
Apr-22
Oct-22
Apr-23
Oct-23
Apr-24
Oct-24
Nifty India Defence TRI
Positive
Indigenisation
List
Announcement
Date
No of Items/
Components to be
localized
Annualized
Returns Since
Announcement
Date
List 1 21-Aug-20 101 64%
List 2 31-May-21 108 75%
List 3 07-Apr-22 101 79%
List 4 19-Oct-22 101 75%
List 5 05-Oct-23 98 96%
Investment Team
20
Charanjit Singh
VP & Fund Manager, Capital
Goods, Infra, Power Utilities,
Consumer Durables
Fund Manager
Role
Experience
Previous Roles
Education
▪ Joined DSP in Sep 2018 to cover Industrials, Utilities, Infrastructure
and Consumer Durables sectors
▪ > 19 years of work experience
▪ Rated as No. 2 analyst in 2017 Asia Money Polls in Industrials sector
▪ Consistently voted in top quartile by leading investment managers in
previous roles
▪ B&K securities – Heading Industrials, Utilities, Infrastructure and
Consumer Durables sectors
▪ Axis Capital
▪ BNP Paribas
▪ HSBC
▪ MBA in Finance from IIT Madras DOMS
▪ Electronics and Communication Engineer
Funds Managed ▪ DSP India T.I.G.E.R. Fund (The Infrastructure Growth and Economic
Reforms Fund)
21
Details of funds managed are as on 31-Oct-24. For latest information with respect to funds managed, please refer to notice cum addenda available on www.dspim.com.
Fund Manager History Of Identifying Trends Early In The Cycle
Source: Bloomberg, Internal. Data as of 31-Oct-24. T.I.G.E.R. - The Infrastructure Growth and Economic Reforms. The sector(s)/ stock(s)/ issuer(s) mentioned in this document do not
constitute any recommendation of the same and the Fund may or may not have any future position in these sector(s)/ stock(s)/ issuer(s). Past performance may or may not be sustained in
future and should not be used as a basis for comparison with other investments. The performance details provided herein are of Regular Plan – Growth Option. For performance data in
SEBI specified format, refer Annexure.
Defence Story – Theme identified early
in cycle with the current framework
Evidence of ability to ride industry cycles in DSP India T.I.G.E.R. Fund
The fund has outperformed the benchmark
& broader index in the last 10 years
22
0
100
200
300
400
500
600
Sep-14
Sep-15
Sep-16
Sep-17
Sep-18
Sep-19
Sep-20
Sep-21
Sep-22
Sep-23
Sep-24
DSP India
T.I.G.E.R.
Fund
BSE India
Infrastructure
TRI
Nifty 500 TRI
18.0% 16.0% 14.2%
0%
1%
2%
3%
4%
5%
0
1000
2000
3000
4000
5000
6000
Sep-21
Dec-21
Mar-22
Jun-22
Sep-22
Dec-22
Mar-23
Jun-23
Sep-23
Dec-23
Mar-24
Jun-24
Sep-24
Hindustan Aeronautics Limited
Last Price
Weight (%)
Fund started
allocation
early in the
cycle
Fund had peak
allocation of ~4%
Fund started to
reduce allocation
as cycle peaked
Equity Investments Team Supporting Fund Manager
Rohit Singhania (23)
Senior Vice President
Co-Head – Equities
Vinit Sambre (26)
Senior Vice President
Head - Equities
Head of Equities
Abhishek Singh (17)
VP, Portfolio Manager
Bhavin Gandhi (20)
AVP, Portfolio Manager
Resham Jain, CFA (19)
VP, Small & Mid Caps, Agri
inputs, Textiles, Chemicals,
Retail
Abhishek Ghosh (16)
AVP, Small & Mid Caps,
Transportation
Dhaval Gada (14)
VP, Banking and
Financial Services
Chirag Dagli (22)
VP, Healthcare
Analyst / Fund Manager
Aniket Pande (9)
AVP, Tech, Telecom,
FMCG, Internet
Vaibhav Shah (5)
Sr. Manager, Auto and
Metals sector
Sarthak Tita (1)
Mgmt Trainee, Oil &
Gas and Cement
sector
Nilesh Aiya (14)
VP, Forensic Research
Plays the role of a SKEPTICAL ANALYST
– a first of its kind role in the domestic
Indian asset management industry
Kaivalya Nadkarni (6)
Sr. Manager
Arbitrage Opportunities
Note: Numbers in brackets indicate years of experience
23
For more details on scheme specific risk factors including risks associated with Equity and Equity-related securities/ investments, please read the Scheme Information Document and Key Information
Memorandum of the scheme available at the Investor Service Centers of the AMC and also available on www.dspim.com.
Risks associated with investment in Sectoral / thematic fund:
Any sectoral or thematic fund will seek to invest in underlying investments belonging to a defined sector or the theme. Investor needs to understand that
a specific sector/theme may not achieve desired result / growth and may also experience unexpected changes adversely affecting the performance, thus
investing in a sectoral /thematic fund could involve potentially higher volatility and risk. Further the fund would be restricted to invest in underlying
investments from the defined sectors/themes and thus the concentration risk is also expected to be high.
Risks associated with mid-cap and small-cap companies
SEBI has defined the market capitalization spectrum as follows:
• Large-Cap Stocks: 1st -100th company in terms of full market capitalization
• Mid-Cap Stocks: 101st -250th company in terms of full market capitalization
• Small-Cap Stocks: 251st company onwards in terms of full market capitalization
Investment in mid-cap and small-cap companies are based on the premise that these companies have the ability to increase their earnings at a faster
pace as compared to large- cap companies and grow into larger, more valuable companies. However, as with all equity investments, there is a risk that
such companies may not achieve their expected earnings results, or there could be an unexpected change in the market, both of which may adversely
affect investment results. Historically, it has been observed that as you go down the capitalization spectrum i.e., from large cap stocks to mid-cap stocks
and beyond, there are higher risks in terms of volatility and market liquidity. Scheme also invests in mid-cap and small-cap companies and hence is
exposed to associated risks.
Liquidity
The ability to execute investment strategies or sell these investments could be limited by the overall trading volume, settlement periods, transfer cycles
on the stock exchanges and may lead to the Scheme incurring losses till the security is finally sold.
Risk Factors
24
Instruments
Indicative Allocations
( % of total assets) Risk Profile
Minimum Maximum
Equity and Equity related instruments based on business cycle 80% 100% Very High Risk
Equity and Equity related instruments other than business cycle 0% 20% Very High Risk
Debt and Money Market Instruments 0% 20% Low to Moderate Risk
Units issued by REITs & InvITs 0% 10% Very High Risk
For scheme specific risk factors, asset allocation details, please read the Scheme Information Document and Key Information Memorandum of the scheme available at the Investor Service Centers of
the AMC and also available on www.dspim.com.
Under normal circumstances, the asset allocation of the Scheme will be as follows:
Asset Allocation as per Scheme Information Document
25
Annexure – Performance of DSP India T.I.G.E.R. Fund (The Infrastructure Growth
and Economic Reforms Fund) In SEBI Format
Fund Manager
Charanjit Singh – Managing since Jan 2021
^ Fund Benchmark. # Additional Benchmark.
Data as on 31-Oct-2024. Date of allotment: 11-Jun-2004. Period for which fund's performance has been provided is computed based on last day of the month-end preceding the date of advertisement.
Different plans shall have a different expense structure. The performance details provided herein are of Regular Plan – Growth Option. Since inception returns have been calculated from the date of
allotment till 31-Oct-2024. Past performance may or may not be sustained in future and should not be used as a basis for comparison with other investments. As on 31-Oct-2024, the fund
manager only manages DSP India T.I.G.E.R. Fund (The Infrastructure Growth and Economic Reforms Fund).
26
This Fund BSE India Infrastructure TRI ^ NIFTY 50 TRI #
CAGR Current Value CAGR Current Value CAGR Current Value
1 Year 61.81% ₹ 16,202 75.66% ₹ 17,593 28.31% ₹ 12,839
3 years 32.07% ₹ 23,089 36.87% ₹ 25,709 12.35% ₹ 14,195
5 Years 28.91% ₹ 35,645 31.99% ₹ 40,127 16.61% ₹ 21,582
Since Inception 18.67% ₹ 328,947 NA NA 16.04% ₹ 208,136
NAV / Index Value ₹ 328.95 ₹ 916 ₹ 35,971
Name of scheme DSP Business Cycle Fund
Type of scheme An open ended equity scheme following business cycles based investing theme
Category Thematic Fund
Investment Objective
The investment objective of the scheme is to provide long-term capital appreciation by
investing in equity and equity related securities with a focus on riding business cycles through
dynamic allocation across various sectors / themes / stocks at different stages of business cycle.
There is no assurance that the investment objective of the Scheme will be achieved.
Plans
- Regular
- Direct
Options
- Growth option
- Income Distribution cum capital withdrawal (IDCW) – Payout & Reinvestment option
Minimum Application Amount
(First purchase and for subsequent purchase)
Rs. 100/– and any amount thereafter
Exit Load Holding period from the date of allotment: <= 1 month – 0.5%, > 1 month – Nil
Fund Managers Charanjit Singh
Benchmark Nifty 500 TRI
SIP/STP/SWP Available
Minimum Installment Amount for SIP/SWP/STP Rs. 100/– and any amount thereafter
Taxation Equity Taxation
Expense ratio*
Regular Plan – Upto 2.25%
Direct Plan – Upto 0.5%
*Expense ratio is subject to change in future depending on various factors. SIP – Systematic Investment Plan. STP – Systematic Transfer Plan. SWP – Systematic Withdrawal Plan.
Scheme Features
27
Disclaimers: This presentation/ note is for information purposes only. It should not be construed as investment advice to any party. In this material DSP Asset Managers Pvt. Ltd. (the
AMC) has used information that is publicly available, including information developed in-house. Information gathered and used in this material is believed to be from reliable sources.
While utmost care has been exercised while preparing this document, the AMC nor any person connected does not warrant the completeness or accuracy of the information and disclaims
all liabilities, losses and damages arising out of the use of this information. The recipient(s) before acting on any information herein should make his/their own investigation and seek
appropriate professional advice. The statements contained herein may include statements of future expectations and other forward-looking statements that are based on prevailing market
conditions/ various other factors and involve known and unknown risks and uncertainties that could cause actual results, performance or events to differ materially from those expressed
or implied in such statements. Past performance may or may not be sustained in the future and should not be used as a basis for comparison with other investments. The sector(s)/
stock(s)/ issuer(s) mentioned in this presentation do not constitute any research report/recommendation of the same and the schemes of DSP Mutual Fund may or may not have any
future position in these sector(s)/ stock(s)/ issuer(s). Large-caps are defined as top 100 stocks on market capitalization, mid-caps as 101-250, small-caps as 251 and above. Data
provided is as on 31 Oct 2024 (unless otherwise specified) The figures pertain to performance of the index and do not in any manner indicate the returns/performance of the Scheme. It
is not possible to invest directly in an index. All opinions, figures, charts/graphs and data included in this presentation are as on date and are subject to change without notice. For
complete details on investment objective, investment strategy, asset allocation, scheme specific risk factors and more details, please read the Scheme Information Document, Statement
of Additional Information and Key Information Memorandum of respective scheme available on ISC of AMC and also available on www.dspim.com. There is no assurance of any
returns/capital protection/capital guarantee to the investors in above mentioned Scheme. The presentation indicates the strategy/investment approach proposed to be followed by the
above mentioned Scheme and the same may change in future depending on market conditions and other factors.
Mutual Fund investments are subject to market risks, read all scheme related documents carefully.
The product labelling assigned during the New Fund Offer (‘NFO’) is based on internal assessment of the Scheme Characteristics or model portfolio and the same may vary post NFO when actual investments are made.
DSP Business Cycle
Fund
(An open ended
equity scheme
following business
cycles based
investing theme)
This scheme is suitable for investors who are seeking*
• Long term capital growth
• Investment in equity and equity related securities
with a focus on riding business cycles through
dynamic allocation across various sectors / themes /
stocks at different stages of business cycle
*Investors should consult their financial advisers if in
doubt about whether the scheme is suitable for them.
SCHEME RISKOMETER BENCHMARK [Nifty 500 TRI]
RISKOMETER
Disclaimer & Product Labelling
28
The date of release of this material is 08-Nov-2024
#INVESTFORGOOD
29

DSP Business Cycle Fund - NFO Presentation

  • 1.
    An open endedequity scheme following business cycles based investing theme Focusing on Industry Cycles DSP Business Cycle Fund 27-Nov-24 to 11-Dec-24 NFO Period
  • 2.
    Fund Philosophy –Where will we focus? Economic Cycle Market Cycle Sector Cycle Industry Cycle ‘Business’ Cycle WE FOCUS HERE 2 The investment approach/ framework/ strategy mentioned herein are proposed to be followed by the scheme and the same may change in future depending on market conditions and other factors. Why do we focus here? Check this note Note: ‘Business’ Cycle here refers to the cyclicality of business the companies engage in.
  • 3.
    DSP Business CycleFund – Focused On Identifying Strong Industry Cycles 3 The investment approach/ framework/ strategy mentioned herein are proposed to be followed by the scheme and the same may change in future depending on market conditions and other factors. Large caps are defined as top 100 stocks on market capitalization, mid caps as 101-250, small caps as 251 and above. Micro caps denote top 250 small cap companies beyond the Nifty 500 constituents. • Unconstrained by market cap & can include companies from • Large caps • Mid caps • Small caps • Micro caps Wide Investment Universe • Grouping investment universe into various broader sectors Sector Grouping • Evaluation done at industry level wherever applicable • Prefer Industries near bottom of cycle with the potential for strong growth and improvement in financials Industry Grouping & Analysis • Dedicated Forensic Analyst to identify companies with weak corporate governance • Such companies shall be excluded even if they have strong growth expectations Forensic Exclusion • Identifying stocks from industries which have high growth potential, improving fundamentals & higher potential upside • Such stocks shall be given higher weights Active Stock Picking
  • 4.
    Framework for InvestmentDecision The investment approach/ framework/ strategy mentioned herein are proposed to be followed by the scheme and the same may change in future depending on market conditions and other factors. The sector(s)/ stock(s)/ issuer(s) mentioned in this document do not constitute any recommendation of the same and the Fund may or may not have any future position in these sector(s)/ stock(s)/ issuer(s). For detailed asset allocation, please read the Scheme Information Document and Key Information Memorandum of the scheme available at the Investor Service Centers of the AMC and also available on www.dspim.com. Preference for Industries with Low Excess Returns + Low Valuations + Strong Earnings + Under-Ownership Excess Returns Valuations Industry Returns vs Benchmark Returns Industry Valuation 1. Absolute Valuations 2. Relative Valuations (vs Benchmark) How is this arrived at? • Industry with low (or even negative) excess returns shall be preferred • Industry with positive excess returns are considered if they are in momentum • Industry with low valuations shall be preferred • Industry with higher valuations but with higher growth potential shall also be considered How will this be used for industry selection? Profitability & Cashflow Drivers Industry specific drivers of profitability growth and free cash flows • Industry wherein fundamental drivers have bottomed out/ improving/ continue to be robust with visibility of strong, SUSTAINABLE growth potential Industry Ownership Ownership Limit allocation to over-owned industries, especially when valuations are also high Exception 4 The fund may invest ~10% of the portfolio in niche, emerging industries such as green hydrogen, battery storage, and drone technology, which may not be evaluated using the above framework.
  • 5.
    Framework for PortfolioConstruction The investment approach/ framework/ strategy mentioned herein are proposed to be followed by the scheme and the same may change in future depending on market conditions and other factors. Portfolio Allocation will be based on the prevailing market conditions and is subject to changes depending on the fund manager’s view of the equity markets. 5 Industry Cycle Potential Upside Portfolio Construct Liquidity • Aggressively positioned to favour industries entering the upcycle based on the framework • Stocks (that pass our forensic filter) from industries with higher growth potential, improving fundamentals & higher potential upside shall be given higher weights • Weights shall be normalized considering risk & portfolio diversification • Final allocation shall also be subject to liquidity of stock 0% allocation to sectors / industries which are very unattractive based on our framework, irrespective of their significance in the benchmark DSP Business Cycle Fund
  • 6.
    • Exposure whenequity market opportunities are scarce and REITs / InvITs offer attractive yields • Up to 10% of portfolio • Hedge using Put options during periods of high valuations/ significant events • No put hedge when the cost to benefit (premium vs potential gain) is unfavorable • May increase cash holdings when valuations are expensive, opportunities are scarce, or the outlook is negative • Maximum cash allocation up to 20% • Proxy for cash used to hedge equity risk • Hedge only for stocks with active futures & options market Risk Management Via Portfolio Hedging Put Options Cash calls Arbitrage REITs & InvITs Given the aggressive positioning across industries, the potential downsides can be higher especially when the investment thesis does not play out as expected. 6 The investment approach/ framework/ strategy mentioned herein are proposed to be followed by the scheme and the same may change in future depending on market conditions and other factors. For detailed asset allocation, please read the Scheme Information Document and Key Information Memorandum of the scheme available at the Investor Service Centers of the AMC and also available on www.dspim.com. The fund may employ the below risk management tools to mitigate this downside risk
  • 7.
    What did ourframework suggest in Oct 2024? Source: Internal. Data as of 31-Oct-24. Auto Comp – Automobile Components. Infra – Infrastructure. IT – Information Technology. FMCG – Fast Moving Consumer Goods. NBFC – Non-Banking Financial Company. The investment approach / framework / strategy mentioned herein are proposed to be followed by the scheme and the same may change in future depending on market conditions and other factors. The sector(s)/stock(s)/issuer(s) mentioned in this document do not constitute any recommendation of the same and the Fund may or may not have any future position in these sector(s)/stock(s)/issuer(s). Portfolio Allocation will be based on the prevailing market conditions and is subject to changes depending on the fund manager’s view of the equity markets. 7 Industry Breakup Suggested By Our Framework as on 31 Oct 2024 Our framework indicated ZERO allocation to Cement, FMCG, IT & NBFCs Cash, Arbitrage & Others 25%
  • 8.
    What did ourframework suggest in Oct 2024? Source: Internal. Data as of 31-Oct-24. EBITDA – Earnings Before Interest, Tax, Depreciation & Amortization. SD – Standard Deviation. The investment approach / framework / strategy mentioned herein are proposed to be followed by the scheme and the same may change in future depending on market conditions and other factors. Portfolio Allocation will be based on the prevailing market conditions and is subject to changes depending on the fund manager’s view of the equity markets. 8 Business Cycle Early Mid Advance Late Cash, Arbitrage & Others Grand Total Valuation Cycle Attractive - 5% 4% - - 9% Low 3% 7% 7% 6% - 23% High 7% 9% 6% 6% - 28% Excessive 6% 2% 1% 6% - 15% Cash, Arbitrage & Others - - - - 25% 25% Grand Total 16% 23% 18% 18% 25% 100% Business Cycle Stage: Categorization predominantly based on quartile positioning 3-year rolling revenue growth and EBITDA margins (percentile upto 25th – Early, upto 25-50th – Mid, 50-75th – Advance, above 75th – Late) Valuation: Categorization predominantly based on valuations relative to history (below -1 SD – Attractive, -1 SD to Average – Low, Average to +1 SD – High, above +1SD – Excessive) Business Cycle vs Valuation Breakup Suggested By Our Framework as on 31 Oct 2024
  • 9.
    DSP Business CycleFund - In A Nutshell Framework-driven selection of industries & companies with high growth / turnaround potential Flexibility to aggressively allocate significant weights to industries in an upcycle Does not shy away from taking cash calls or using other risk management strategies Suitable for all market phases given its unconstrained nature Recommended holding period of 5+ years 9 1 2 3 4 5 The investment approach/ framework/ strategy mentioned herein are proposed to be followed by the scheme and the same may change in future depending on market conditions and other factors.
  • 10.
  • 11.
    87% 67% -50% 0% 50% 100% 150% 200% Sep-06 Sep-09 Sep-12Sep-15 Sep-18 Sep-21 Sep-24 Valuation Premium of Auto Ancillaries over Nifty 50 using trailing 12 month PE (60) (30) - 30 60 90 120 Sep-06 Sep-09 Sep-12 Sep-15 Sep-18 Sep-21 Sep-24 Excess Return of Auto Ancillaries 12 Month Rolling Return Differential (Auto Ancillaries - Nifty) This is when sector will be favored for investment Illustration – Evaluation of Excess Returns & Valuations Excess Return is calculated as rolling return difference between Industry & Market. Industry Valuation Premium is calculated using the percentage difference between valuation ratios of Industry & Market. This is when sector will be favored for investment Source: Bloomberg, Internal. Data as on 30-Sep-24. Auto Ancillaries is represented by companies falling under Auto Components industry as categorized by AMFI. PE - Price to Earnings. The investment approach/ framework/ strategy mentioned herein are proposed to be followed by the scheme and the same may change in future depending on market conditions and other factors. The sector(s)/ stock(s)/ issuer(s) mentioned in this document do not constitute any recommendation of the same and the Fund may or may not have any future position in these sector(s)/ stock(s)/ issuer(s). Past performance may or may not be sustained in future and should not be used as a basis for comparison with other investments. These figures pertain to performance of the index and do not in any manner indicate the returns/performance of this scheme. 11 Excess return is favorable, but industry may not be preferred as valuations are not as favorable
  • 12.
    Illustration of ValuationMetrics Used Source: Internal. Data as on 31-Oct-24. EV – Enterprise Value. EBITDA – Earnings Before Interest, Tax, Depreciation and Amortization. FMCG – Fast Moving Consumer Goods. The investment approach/ framework/ strategy mentioned herein are proposed to be followed by the scheme and the same may change in future depending on market conditions and other factors. The sector(s)/ stock(s)/ issuer(s) mentioned in this document do not constitute any recommendation of the same and the Fund may or may not have any future position in these sector(s)/ stock(s)/ issuer(s). Every industry is evaluated on different valuation parameters... Price to Earnings Price to Book EV to EBITDA FMCG Information Technology Consumer Durables Banks Utilities Insurance Auto Pharma Cement Asset Management Companies 12
  • 13.
    Illustration – Driversof Profitability & Cashflows Industry Key Drivers To Understand How The Industry Is Currently Positioned Banks/ NBFCs PPOP / NIM GNPA / NNPA Credit Growth CASA Ratio Auto Volume Growth Launch Pipeline Interest Rates Rural Outlook Consumer Staples Rural Outlook Volume Growth Distribution Expansion Market Share Changes IT Services Hiring And Attrition Margins Outlook Demand Outlook Offshore / Onshore Mix Infra & Capital Goods Government Capex Private Project Announcements Capacity Utilization Technology Capability Materials Global Demand Supply Spreads Capacity Utilization Balance Sheet Strength Real Estate Affordability Levels Inventory Levels Interest Rates Cash Flow Conversion Consumer Discretionary Rising Income Levels Increasing Penetration Interest Rates Distribution Expansion Chemicals Capacity Addition Specialty Chemicals Mix Demand Supply Spreads Source: Internal. Data as on 31-Oct-24. NBFC – Non-Banking Financial Company. PPOP – Pre-Provision Operating Profit. NIM – Net Interest Margin. GNPA – Gross Non-Performing Assets. NNPA – Net Non-Performing Assets. CASA – Current Account and Savings Account. The investment approach/ framework/ strategy mentioned herein are proposed to be followed by the scheme and the same may change in future depending on market conditions and other factors. The sector(s)/ stock(s)/ issuer(s) mentioned in this document do not constitute any recommendation of the same and the Fund may or may not have any future position in these sector(s)/ stock(s)/ issuer(s). 13
  • 14.
  • 15.
    Illustration – Pharma& FMCG Source: IQVIA, Goldman Sachs, Bloomberg, Internal. Data as of 30-Sep-24. FMCG – Fast Moving Consumer Goods. The sector(s)/stock(s)/issuer(s) mentioned in this document do not constitute any recommendation of the same and the Fund may or may not have any future position in these sector(s)/stock(s)/issuer(s). Past performance may or may not be sustained in future and should not be used as a basis for comparison with other investments. These figures pertain to performance of the index and do not in any manner indicate the returns/performance of this scheme. FMCG – Returns tend to have inverse relationship with inflation expectations -20% -10% 0% 10% 20% 30% 40% 1 2 3 4 5 6 7 8 Mar/14 Sep/14 Mar/15 Sep/15 Mar/16 Sep/16 Mar/17 Sep/17 Mar/18 Sep/18 Mar/19 Sep/19 Mar/20 Sep/20 Mar/21 Sep/21 Mar/22 Sep/22 Mar/23 Sep/23 Mar/24 Sep/24 Nifty FMCG - Last 1Y Return (RHS) India CPI (YoY, %) Pharma - Improvement in US Generics pricing environment leads to better future returns 15 -50% -25% 0% 25% 50% 75% -20% -10% 0% 10% 20% 30% Mar-07 Mar-08 Mar-09 Mar-10 Mar-11 Mar-12 Mar-13 Mar-14 Mar-15 Mar-16 Mar-17 Mar-18 Mar-19 Mar-20 Mar-21 Mar-22 Mar-23 Mar-24 Phase of Price Improvement US Generics Price Change (YoY %) Nifty Pharma - Next 1Y Return (RHS)
  • 16.
    Illustration – RealEstate & Building Materials Source: Anarock, Bloomberg, Internal. Data as of FY24. RE – Real Estate. The sector(s)/ stock(s)/ issuer(s) mentioned in this document do not constitute any recommendation of the same and the Fund may or may not have any future position in these sector(s)/ stock(s)/ issuer(s). -20% -10% 0% 10% 20% 30% 40% -30% -20% -10% 0% 10% 20% 30% 40% 50% FY11 FY12 FY13 FY14 FY15 FY16 FY17 FY18 FY19 FY20 FY21 FY22 FY23 FY24 RE Completion Growth Wood Panel Industry Growth (RHS) Real Estate Completion Cycle & Building Materials Industry Growth tend to have high positive correlation -10% -5% 0% 5% 10% 15% 20% 25% 30% -30% -20% -10% 0% 10% 20% 30% 40% 50% FY11 FY12 FY13 FY14 FY15 FY16 FY17 FY18 FY19 FY20 FY21 FY22 FY23 FY24 RE Completion Growth Bathware Industry Growth (RHS) Tiles Industry Growth (RHS) 16
  • 17.
    Source: Bloomberg, BigMint,Internal. Data as of 30-Sep-24. HRC – Hot Rolled Coil. The sector(s)/ stock(s)/ issuer(s) mentioned in this document do not constitute any recommendation of the same and the Fund may or may not have any future position in these sector(s)/ stock(s)/ issuer(s). Past performance may or may not be sustained in future and should not be used as a basis for comparison with other investments. These figures pertain to performance of the index and do not in any manner indicate the returns/performance of this scheme. Indian Steel Price tends to follow credit conditions in China Metals prices are inversely related to US Dollar -15% -10% -5% 0% 5% 10% 15% 20% -40% -20% 0% 20% 40% 60% 80% Sep/94 Sep/96 Sep/98 Sep/00 Sep/02 Sep/04 Sep/06 Sep/08 Sep/10 Sep/12 Sep/14 Sep/16 Sep/18 Sep/20 Sep/22 Sep/24 CRB Metals Index US Dollar Index (RHS) -30% -20% -10% 0% 10% 20% 30% 40% 50% 60% 70% 20 22 24 26 28 30 32 34 36 Sep/14 Sep/15 Sep/16 Sep/17 Sep/18 Sep/19 Sep/20 Sep/21 Sep/22 Sep/23 Sep/24 Bloomberg China Credit Impulse India HRC Steel - Next 6M Price Change (RHS) 17 Illustration – Metals
  • 18.
    Illustration – Telecom& Agriculture Agriculture - Output as measured by GVA tends to follow rainfall levels -40% -20% 0% 20% 40% 60% 80% 100% 0 100 200 300 400 500 600 FY04 FY05 FY06 FY07 FY08 FY09 FY10 FY11 FY12 FY13 FY14 FY15 FY16 FY17 FY18 FY19 FY20 FY21 FY22 FY23 FY24 Next 1Y Return (RHS) ARPU (Rs) Telecom - Forward Returns are higher when there is improvement in ARPU Source: I-Sec, Bloomberg, Internal. Data as of 30-Sep-24. Bharti Airtel numbers are considered for Telecom. ARPU – Average Revenue Per User. LPA – Long Period Average. GVA – Gross Value Added. The sector(s)/ stock(s)/ issuer(s) mentioned in this document do not constitute any recommendation of the same and the Fund may or may not have any future position in these sector(s)/ stock(s)/ issuer(s). Past performance may or may not be sustained in future and should not be used as a basis for comparison with other investments. These figures pertain to performance of the index and do not in any manner indicate the returns/performance of this scheme. -1 0 1 2 3 4 5 6 7 8 85 90 95 100 105 110 115 FY13 FY14 FY15 FY16 FY17 FY18 FY19 FY20 FY21 FY22 FY23 FY24 Rainfall (as a % of LPA) Agriculture Real GVA (YoY %, RHS) 18
  • 19.
    Illustration – EmergingSector: Defence Source: MFI Explorer, Ministry of Defence, Internal. Data as of 31-Oct-24. The sector(s)/ stock(s)/ issuer(s) mentioned in this document do not constitute any recommendation of the same and the Fund may or may not have any future position in these sector(s)/ stock(s)/ issuer(s). Past performance may or may not be sustained in future and should not be used as a basis for comparison with other investments. These figures pertain to performance of the index and do not in any manner indicate the returns/performance of this scheme. Defence – Sector came into spotlight after Government’s announcement of localization measures 19 0 1000 2000 3000 4000 5000 6000 7000 8000 9000 10000 Apr-18 Oct-18 Apr-19 Oct-19 Apr-20 Oct-20 Apr-21 Oct-21 Apr-22 Oct-22 Apr-23 Oct-23 Apr-24 Oct-24 Nifty India Defence TRI Positive Indigenisation List Announcement Date No of Items/ Components to be localized Annualized Returns Since Announcement Date List 1 21-Aug-20 101 64% List 2 31-May-21 108 75% List 3 07-Apr-22 101 79% List 4 19-Oct-22 101 75% List 5 05-Oct-23 98 96%
  • 20.
  • 21.
    Charanjit Singh VP &Fund Manager, Capital Goods, Infra, Power Utilities, Consumer Durables Fund Manager Role Experience Previous Roles Education ▪ Joined DSP in Sep 2018 to cover Industrials, Utilities, Infrastructure and Consumer Durables sectors ▪ > 19 years of work experience ▪ Rated as No. 2 analyst in 2017 Asia Money Polls in Industrials sector ▪ Consistently voted in top quartile by leading investment managers in previous roles ▪ B&K securities – Heading Industrials, Utilities, Infrastructure and Consumer Durables sectors ▪ Axis Capital ▪ BNP Paribas ▪ HSBC ▪ MBA in Finance from IIT Madras DOMS ▪ Electronics and Communication Engineer Funds Managed ▪ DSP India T.I.G.E.R. Fund (The Infrastructure Growth and Economic Reforms Fund) 21 Details of funds managed are as on 31-Oct-24. For latest information with respect to funds managed, please refer to notice cum addenda available on www.dspim.com.
  • 22.
    Fund Manager HistoryOf Identifying Trends Early In The Cycle Source: Bloomberg, Internal. Data as of 31-Oct-24. T.I.G.E.R. - The Infrastructure Growth and Economic Reforms. The sector(s)/ stock(s)/ issuer(s) mentioned in this document do not constitute any recommendation of the same and the Fund may or may not have any future position in these sector(s)/ stock(s)/ issuer(s). Past performance may or may not be sustained in future and should not be used as a basis for comparison with other investments. The performance details provided herein are of Regular Plan – Growth Option. For performance data in SEBI specified format, refer Annexure. Defence Story – Theme identified early in cycle with the current framework Evidence of ability to ride industry cycles in DSP India T.I.G.E.R. Fund The fund has outperformed the benchmark & broader index in the last 10 years 22 0 100 200 300 400 500 600 Sep-14 Sep-15 Sep-16 Sep-17 Sep-18 Sep-19 Sep-20 Sep-21 Sep-22 Sep-23 Sep-24 DSP India T.I.G.E.R. Fund BSE India Infrastructure TRI Nifty 500 TRI 18.0% 16.0% 14.2% 0% 1% 2% 3% 4% 5% 0 1000 2000 3000 4000 5000 6000 Sep-21 Dec-21 Mar-22 Jun-22 Sep-22 Dec-22 Mar-23 Jun-23 Sep-23 Dec-23 Mar-24 Jun-24 Sep-24 Hindustan Aeronautics Limited Last Price Weight (%) Fund started allocation early in the cycle Fund had peak allocation of ~4% Fund started to reduce allocation as cycle peaked
  • 23.
    Equity Investments TeamSupporting Fund Manager Rohit Singhania (23) Senior Vice President Co-Head – Equities Vinit Sambre (26) Senior Vice President Head - Equities Head of Equities Abhishek Singh (17) VP, Portfolio Manager Bhavin Gandhi (20) AVP, Portfolio Manager Resham Jain, CFA (19) VP, Small & Mid Caps, Agri inputs, Textiles, Chemicals, Retail Abhishek Ghosh (16) AVP, Small & Mid Caps, Transportation Dhaval Gada (14) VP, Banking and Financial Services Chirag Dagli (22) VP, Healthcare Analyst / Fund Manager Aniket Pande (9) AVP, Tech, Telecom, FMCG, Internet Vaibhav Shah (5) Sr. Manager, Auto and Metals sector Sarthak Tita (1) Mgmt Trainee, Oil & Gas and Cement sector Nilesh Aiya (14) VP, Forensic Research Plays the role of a SKEPTICAL ANALYST – a first of its kind role in the domestic Indian asset management industry Kaivalya Nadkarni (6) Sr. Manager Arbitrage Opportunities Note: Numbers in brackets indicate years of experience 23
  • 24.
    For more detailson scheme specific risk factors including risks associated with Equity and Equity-related securities/ investments, please read the Scheme Information Document and Key Information Memorandum of the scheme available at the Investor Service Centers of the AMC and also available on www.dspim.com. Risks associated with investment in Sectoral / thematic fund: Any sectoral or thematic fund will seek to invest in underlying investments belonging to a defined sector or the theme. Investor needs to understand that a specific sector/theme may not achieve desired result / growth and may also experience unexpected changes adversely affecting the performance, thus investing in a sectoral /thematic fund could involve potentially higher volatility and risk. Further the fund would be restricted to invest in underlying investments from the defined sectors/themes and thus the concentration risk is also expected to be high. Risks associated with mid-cap and small-cap companies SEBI has defined the market capitalization spectrum as follows: • Large-Cap Stocks: 1st -100th company in terms of full market capitalization • Mid-Cap Stocks: 101st -250th company in terms of full market capitalization • Small-Cap Stocks: 251st company onwards in terms of full market capitalization Investment in mid-cap and small-cap companies are based on the premise that these companies have the ability to increase their earnings at a faster pace as compared to large- cap companies and grow into larger, more valuable companies. However, as with all equity investments, there is a risk that such companies may not achieve their expected earnings results, or there could be an unexpected change in the market, both of which may adversely affect investment results. Historically, it has been observed that as you go down the capitalization spectrum i.e., from large cap stocks to mid-cap stocks and beyond, there are higher risks in terms of volatility and market liquidity. Scheme also invests in mid-cap and small-cap companies and hence is exposed to associated risks. Liquidity The ability to execute investment strategies or sell these investments could be limited by the overall trading volume, settlement periods, transfer cycles on the stock exchanges and may lead to the Scheme incurring losses till the security is finally sold. Risk Factors 24
  • 25.
    Instruments Indicative Allocations ( %of total assets) Risk Profile Minimum Maximum Equity and Equity related instruments based on business cycle 80% 100% Very High Risk Equity and Equity related instruments other than business cycle 0% 20% Very High Risk Debt and Money Market Instruments 0% 20% Low to Moderate Risk Units issued by REITs & InvITs 0% 10% Very High Risk For scheme specific risk factors, asset allocation details, please read the Scheme Information Document and Key Information Memorandum of the scheme available at the Investor Service Centers of the AMC and also available on www.dspim.com. Under normal circumstances, the asset allocation of the Scheme will be as follows: Asset Allocation as per Scheme Information Document 25
  • 26.
    Annexure – Performanceof DSP India T.I.G.E.R. Fund (The Infrastructure Growth and Economic Reforms Fund) In SEBI Format Fund Manager Charanjit Singh – Managing since Jan 2021 ^ Fund Benchmark. # Additional Benchmark. Data as on 31-Oct-2024. Date of allotment: 11-Jun-2004. Period for which fund's performance has been provided is computed based on last day of the month-end preceding the date of advertisement. Different plans shall have a different expense structure. The performance details provided herein are of Regular Plan – Growth Option. Since inception returns have been calculated from the date of allotment till 31-Oct-2024. Past performance may or may not be sustained in future and should not be used as a basis for comparison with other investments. As on 31-Oct-2024, the fund manager only manages DSP India T.I.G.E.R. Fund (The Infrastructure Growth and Economic Reforms Fund). 26 This Fund BSE India Infrastructure TRI ^ NIFTY 50 TRI # CAGR Current Value CAGR Current Value CAGR Current Value 1 Year 61.81% ₹ 16,202 75.66% ₹ 17,593 28.31% ₹ 12,839 3 years 32.07% ₹ 23,089 36.87% ₹ 25,709 12.35% ₹ 14,195 5 Years 28.91% ₹ 35,645 31.99% ₹ 40,127 16.61% ₹ 21,582 Since Inception 18.67% ₹ 328,947 NA NA 16.04% ₹ 208,136 NAV / Index Value ₹ 328.95 ₹ 916 ₹ 35,971
  • 27.
    Name of schemeDSP Business Cycle Fund Type of scheme An open ended equity scheme following business cycles based investing theme Category Thematic Fund Investment Objective The investment objective of the scheme is to provide long-term capital appreciation by investing in equity and equity related securities with a focus on riding business cycles through dynamic allocation across various sectors / themes / stocks at different stages of business cycle. There is no assurance that the investment objective of the Scheme will be achieved. Plans - Regular - Direct Options - Growth option - Income Distribution cum capital withdrawal (IDCW) – Payout & Reinvestment option Minimum Application Amount (First purchase and for subsequent purchase) Rs. 100/– and any amount thereafter Exit Load Holding period from the date of allotment: <= 1 month – 0.5%, > 1 month – Nil Fund Managers Charanjit Singh Benchmark Nifty 500 TRI SIP/STP/SWP Available Minimum Installment Amount for SIP/SWP/STP Rs. 100/– and any amount thereafter Taxation Equity Taxation Expense ratio* Regular Plan – Upto 2.25% Direct Plan – Upto 0.5% *Expense ratio is subject to change in future depending on various factors. SIP – Systematic Investment Plan. STP – Systematic Transfer Plan. SWP – Systematic Withdrawal Plan. Scheme Features 27
  • 28.
    Disclaimers: This presentation/note is for information purposes only. It should not be construed as investment advice to any party. In this material DSP Asset Managers Pvt. Ltd. (the AMC) has used information that is publicly available, including information developed in-house. Information gathered and used in this material is believed to be from reliable sources. While utmost care has been exercised while preparing this document, the AMC nor any person connected does not warrant the completeness or accuracy of the information and disclaims all liabilities, losses and damages arising out of the use of this information. The recipient(s) before acting on any information herein should make his/their own investigation and seek appropriate professional advice. The statements contained herein may include statements of future expectations and other forward-looking statements that are based on prevailing market conditions/ various other factors and involve known and unknown risks and uncertainties that could cause actual results, performance or events to differ materially from those expressed or implied in such statements. Past performance may or may not be sustained in the future and should not be used as a basis for comparison with other investments. The sector(s)/ stock(s)/ issuer(s) mentioned in this presentation do not constitute any research report/recommendation of the same and the schemes of DSP Mutual Fund may or may not have any future position in these sector(s)/ stock(s)/ issuer(s). Large-caps are defined as top 100 stocks on market capitalization, mid-caps as 101-250, small-caps as 251 and above. Data provided is as on 31 Oct 2024 (unless otherwise specified) The figures pertain to performance of the index and do not in any manner indicate the returns/performance of the Scheme. It is not possible to invest directly in an index. All opinions, figures, charts/graphs and data included in this presentation are as on date and are subject to change without notice. For complete details on investment objective, investment strategy, asset allocation, scheme specific risk factors and more details, please read the Scheme Information Document, Statement of Additional Information and Key Information Memorandum of respective scheme available on ISC of AMC and also available on www.dspim.com. There is no assurance of any returns/capital protection/capital guarantee to the investors in above mentioned Scheme. The presentation indicates the strategy/investment approach proposed to be followed by the above mentioned Scheme and the same may change in future depending on market conditions and other factors. Mutual Fund investments are subject to market risks, read all scheme related documents carefully. The product labelling assigned during the New Fund Offer (‘NFO’) is based on internal assessment of the Scheme Characteristics or model portfolio and the same may vary post NFO when actual investments are made. DSP Business Cycle Fund (An open ended equity scheme following business cycles based investing theme) This scheme is suitable for investors who are seeking* • Long term capital growth • Investment in equity and equity related securities with a focus on riding business cycles through dynamic allocation across various sectors / themes / stocks at different stages of business cycle *Investors should consult their financial advisers if in doubt about whether the scheme is suitable for them. SCHEME RISKOMETER BENCHMARK [Nifty 500 TRI] RISKOMETER Disclaimer & Product Labelling 28 The date of release of this material is 08-Nov-2024
  • 29.