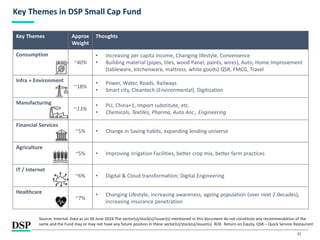
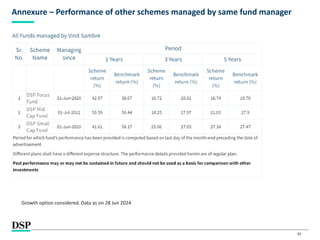
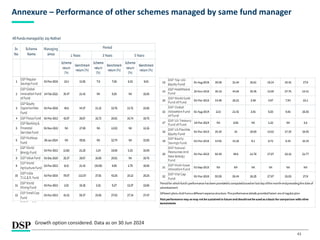
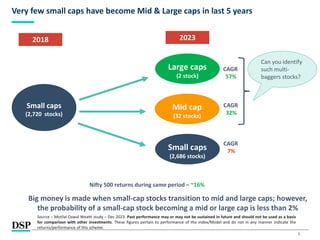
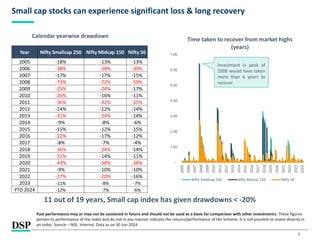
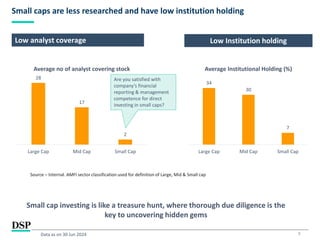
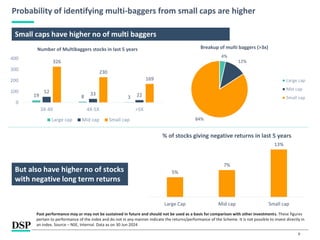
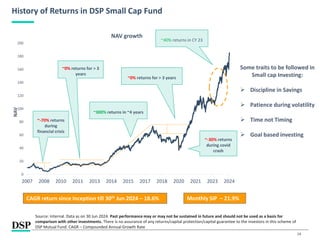
The document provides an overview of the DSP Small Cap Fund, detailing its investment strategy focused on small-cap stocks and the associated risks and potential rewards. It highlights the importance of long-term investing, active management, and the likelihood of high returns over extended holding periods, despite the volatility of small-cap markets. Additionally, it outlines the fund's performance history, management principles, and investor considerations, emphasizing a disciplined and research-driven approach to small-cap investing.
![[Title to come]
[Sub-Title to come]
Strictly for Intended Recipients Only
Date
* DSP India Fund is the Company incorporated in Mauritius, under which ILSF is the corresponding share class
| People | Processes | Performance |
DSP Small Cap Fund
Small Cap Fund - An open ended equity scheme predominantly investing in small cap stocks
#INVESTFORGOOD
Jun 2024](https://image.slidesharecdn.com/dspsmallcap-jun24-240801070306-4eba32b7/85/DSP-Small-Cap-Fund-Presentation-June-24-1-320.jpg)
![[Title to come]
[Sub-Title to come]
Strictly for Intended Recipients Only
Date
* DSP India Fund is the Company incorporated in Mauritius, under which ILSF is the corresponding share class
| People | Processes | Performance |
DSP Small Cap Fund
Small Cap Fund - An open ended equity scheme predominantly investing in small cap stocks
#INVESTFORGOOD
Jun 2024](https://image.slidesharecdn.com/dspsmallcap-jun24-240801070306-4eba32b7/75/DSP-Small-Cap-Fund-Presentation-June-24-1-2048.jpg)


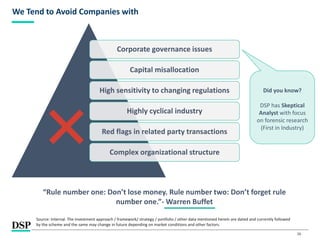
![• We analysed data from Indian Large cap, Mid cap and Small cap companies over the past decade to understand
their return potential
• Historically in the Indian markets, a combination of healthy ROE and high earnings growth has resulted in superior
price performance
29
Why we select companies with High ROE and Earnings growth
Strictly For Use By Intended Recipients Only
Source: Elara Capital, [MOSL Wealth Creation Studies in India]; * companies with an average 10Y RoE > = 16%, used so as to categorize companies
within Small Caps; Constituents of Nifty 500 Index as on 30 June 2024 are back tested from the peak of 2008. All returns in INR terms. To understand
the table better, we take an example of the third row. We considered all the stocks in the Nifty 500 index, and classified them as Small Cap, Mid Cap
and Large Cap based on MSCI definition – please see Appendix. Over the period Jan 2008 market peak to November 2021, we found that 23 companies
grew from being Small Caps to Large & Mid Caps, with an average price appreciation of 23.1%, Profit pool increase of 17.3% and an average RoE of
23.1%. Past performance may or may not be sustained in future and should not be used as a basis for comparison with other investments.
Large & Mid Cap SmallCap
No of
stocks
moved
Profit pool
increase (%
CAGR)
9.6%
17.4%
12.7%
Average
ROE
17.2%
20.6%
21.5%
7.4%
8.6%
Market cap classification
(as on 30 June 2024)
L&M
C
L&M
C
SC
SC
SC
Market cap classification
(as on Jan 2008)
L&M
C
L&M
C
SC
SC
SC
No of stocks
moved
54
23
136*
118
37 NEGATIVE
9.7%
There is a sizable pool of high-quality companies that have the potential to provide superior returns
Elimination
is
Key
12.3%
23.8%
19.2%
10.6%
-0.2%
Average
price
appreciation
Market peak
before GFC](https://image.slidesharecdn.com/dspsmallcap-jun24-240801070306-4eba32b7/85/DSP-Small-Cap-Fund-Presentation-June-24-29-320.jpg)