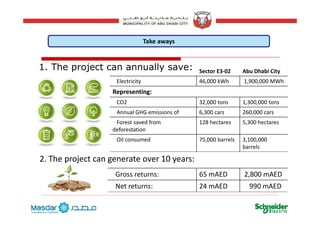
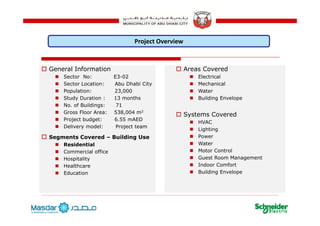
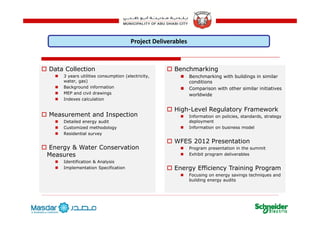
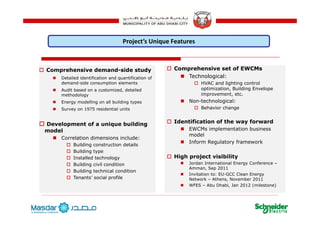
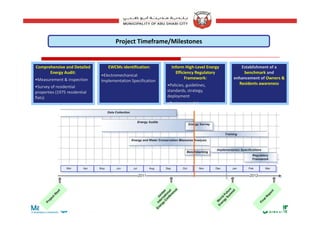
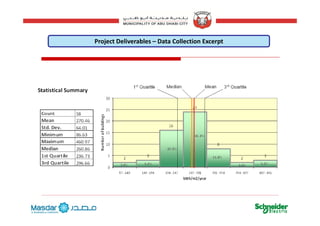
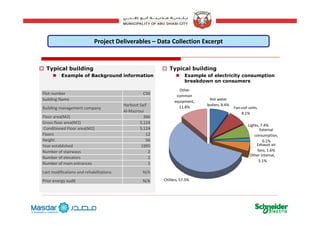
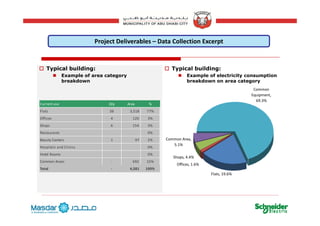
This document summarizes a pilot project conducted by Abu Dhabi Municipality to implement an energy efficiency program for existing buildings. The project involved a comprehensive energy audit of 71 buildings across various sectors to identify energy conservation measures. A phased approach was used starting with assessment, then implementation and monitoring. The project is expected to annually save 46,000 kWh of electricity, 32,000 tons of CO2 emissions and generate gross returns of 6.55 million AED over 10 years. This pilot aims to inform the development of city-wide energy efficiency programs and regulations.


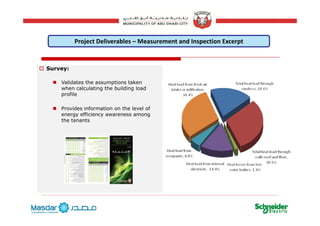
![Project Deliverables – Measurement and Inspection Excerpt
60
70
80
on in kW
Chiller energy consumption logBus-bars thermal temperature reading
10
20
30
40
50
Power Consumptio
Chiller‐1
Chiller‐2
Chiller‐3
0
17:00
18:00
19:00
20:00
21:00
22:00
23:00
00:00
01:00
02:00
03:00
04:00
05:00
06:00
07:00
08:00
09:00
10:00
11:00
12:00
13:00
14:00
15:00
16:00
Time Interval
Chiller coefficient of performance log
Window thermal temperature reading
150
200
250
300
350
400
ower in kW
1.50
2.00
2.50
3.00
3.50
4.00
COP
Window thermal temperature reading
0
50
100
13:30 14:00 14:30 15:00 15:30
Time Interval
Po
0.00
0.50
1.00
Cooling Power [kW] Actual Power [kW] COP
20
g [ ] [ ]](https://image.slidesharecdn.com/2da05269-45f9-407f-b0a6-a6883dcb07d5-150220095616-conversion-gate02/85/Dr-Tamer-Qazi-20-320.jpg)