Dr Dev Kambhampati | CENSUS- International Statistics- Population, Demographics, Births, Deaths etc.
•
1 like•811 views

This document summarizes international statistics sources and classifications. It describes several key international organizations that compile statistics on topics like population, health, agriculture and economics for countries worldwide. These include the UN, IMF, OECD, WHO and FAO. It also outlines changes in international boundaries and country classifications over time due to events like the dissolution of the Soviet Union and Yugoslavia.

Recommended
More Related Content
What's hot
What's hot (17)
Similar to Dr Dev Kambhampati | CENSUS- International Statistics- Population, Demographics, Births, Deaths etc.
Similar to Dr Dev Kambhampati | CENSUS- International Statistics- Population, Demographics, Births, Deaths etc. (20)
More from Dr Dev Kambhampati
More from Dr Dev Kambhampati (20)
Recently uploaded
Recently uploaded (20)
Dr Dev Kambhampati | CENSUS- International Statistics- Population, Demographics, Births, Deaths etc.
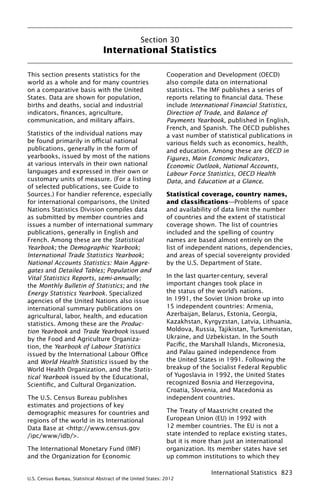
- 1. International Statistics 823 U.S. Census Bureau, Statistical Abstract of the United States: 2012 Section 30 International Statistics This section presents statistics for the world as a whole and for many countries on a comparative basis with the United States. Data are shown for population, births and deaths, social and industrial indicators, finances, agriculture, communication, and military affairs. Statistics of the individual nations may be found primarily in official national publications, generally in the form of yearbooks, issued by most of the nations at various intervals in their own national languages and expressed in their own or customary units of measure. (For a listing of selected publications, see Guide to Sources.) For handier reference, especially for international comparisons, the United Nations Statistics Division compiles data as submitted by member countries and issues a number of international summary publications, generally in English and French. Among these are the Statistical Yearbook; the Demographic Yearbook; International Trade Statistics Yearbook; National Accounts Statistics: Main Aggre- gates and Detailed Tables; Population and Vital Statistics Reports, semi-annually; the Monthly Bulletin of Statistics; and the Energy Statistics Yearbook. Specialized agencies of the United Nations also issue international summary publications on agricultural, labor, health, and education statistics. Among these are the Produc- tion Yearbook and Trade Yearbook issued by the Food and Agriculture Organiza- tion, the Yearbook of Labour Statistics issued by the International Labour Office and World Health Statistics issued by the World Health Organization, and the Statis- tical Yearbook issued by the Educational, Scientific, and Cultural Organization. The U.S. Census Bureau publishes estimates and projections of key demographic measures for countries and regions of the world in its International Data Base at <http://www.census.gov /ipc/www/idb/>. The International Monetary Fund (IMF) and the Organization for Economic Cooperation and Development (OECD) also compile data on international statistics. The IMF publishes a series of reports relating to financial data. These include International Financial Statistics, Direction of Trade, and Balance of Payments Yearbook, published in English, French, and Spanish. The OECD publishes a vast number of statistical publications in various fields such as economics, health, and education. Among these are OECD in Figures, Main Economic Indicators, Economic Outlook, National Accounts, Labour Force Statistics, OECD Health Data, and Education at a Glance. Statistical coverage, country names, and classifications—Problems of space and availability of data limit the number of countries and the extent of statistical coverage shown. The list of countries included and the spelling of country names are based almost entirely on the list of independent nations, dependencies, and areas of special sovereignty provided by the U.S. Department of State. In the last quarter-century, several important changes took place in the status of the world’s nations. In 1991, the Soviet Union broke up into 15 independent countries: Armenia, Azerbaijan, Belarus, Estonia, Georgia, Kazakhstan, Kyrgyzstan, Latvia, Lithuania, Moldova, Russia, Tajikistan, Turkmenistan, Ukraine, and Uzbekistan. In the South Pacific, the Marshall Islands, Micronesia, and Palau gained independence from the United States in 1991. Following the breakup of the Socialist Federal Republic of Yugoslavia in 1992, the United States recognized Bosnia and Herzegovina, Croatia, Slovenia, and Macedonia as independent countries. The Treaty of Maastricht created the European Union (EU) in 1992 with 12 member countries. The EU is not a state intended to replace existing states, but it is more than just an international organization. Its member states have set up common institutions to which they
- 2. 824 International Statistics U.S. Census Bureau, Statistical Abstract of the United States: 2012 delegate some of their sovereignty so that decisions on specific matters of joint interest can be made democrati- cally at a European level. This pooling of sovereignty is also called “European integration.” The EU has grown in size with successive waves of accessions in 1995, 2004, and 2007. The 27 current members of the EU are: Austria, Belgium, Bulgaria, Cyprus, Czech Republic, Denmark, Estonia, Finland, France, Germany, Greece, Hungary, Ireland, Italy, Latvia, Lithuania, Luxembourg, Malta, the Netherlands, Poland, Portugal, Romania, Slovakia, Slovenia, Spain, Sweden, and the United Kingdom. In 1992, the EU decided to establish an economic and monetary union (EMU), with the introduction of a single European currency managed by a European Central Bank. The single currency—the euro— became a reality on January 1, 2002, when euro notes and coins replaced national currencies in 12 of the then 15 countries of the European Union (Belgium, Germany, Greece, Spain, France, Ireland, Italy, Luxembourg, the Netherlands, Austria, Portugal, and Finland). Since then, 12 countries have become members of the EU, but Slovakia, Slovenia, Malta, Cyprus, and Estonia have been the only new members of the EU to adopt the euro as the national currency. On January 1, 1993, Czechoslovakia was succeeded by two independent countries: the Czech Republic and Slovakia. Eritrea announced its independence from Ethiopia in April 1993 and was subse- quently recognized as an independent nation by the United States. In May of 2002, Timor-Leste won independence from Indonesia. Serbia and Montenegro, both former republics of Yugoslavia, became indepen- dent of one another on May 31, 2006. This separation is seen in the population estimates tables (Tables 1332, 1358, and 1404), but some tables may still show both countries as combined. On February 17, 2008, Kosovo declared its independence from Serbia, making it the world’s newest independent state. The Netherlands Antilles dissolved on October 10, 2010. As a result, Cuaçao and Sint Moortan became autonomous territories of the Netherlands. The population estimates and projec- tions used in Tables 1329–1332, 1334, and 1339 were prepared by the Census Bureau. For each country, available data on population, by age and sex, fertility, mortality, and international migration were evaluated and, where necessary, adjusted for inconsistencies and errors in the data. In most instances, compre- hensive projections were made by the cohort-component method, resulting in distributions of the population by age and sex and requiring an assessment of probable future trends of fertility, mortality, and international migration. Economic associations— The Organization for European Economic Co–operation (OEEC), a regional grouping of Western European countries established in 1948 for the purpose of harmonizing national economic policies and condi- tions, was succeeded on September 30, 1961, by the Organization for Economic Cooperation and Development (OECD). The member nations of the OECD are Australia, Austria, Belgium, Canada, Chile, Czech Republic, Denmark, Estonia, Finland, France, Germany, Greece, Hun- gary, Iceland, Ireland, Israel, Italy, Japan, Luxembourg, Mexico, the Netherlands, New Zealand, Norway, Poland, Portugal, Slovakia, Slovenia, South Korea, Spain, Sweden, Switzerland, Turkey, the United Kingdom, and the United States. Quality and comparability of the data—The quality and comparability of the data presented here are affected by a number of factors: (1) The year for which data are presented may not be the same for all subjects for a particular country or for a given subject for different countries, though the data shown are the most recent available. All such variations have been noted. The data shown are for calendar years except as otherwise specified. (2) The bases, methods of estimating, methods of data collection, extent of coverage, precision of definition, scope of territory, and margins of error may vary for different items within a particular country, and for like items for different
- 3. International Statistics 825 U.S. Census Bureau, Statistical Abstract of the United States: 2012 countries. Footnotes and headnotes to the tables give a few of the major time peri- ods and coverage qualifications attached to the figures; considerably more detail is presented in the source publications. Many of the measures shown are, at best, merely rough indicators of magnitude. (3) Figures shown in this section for the United States may not always agree with figures shown in the preceding sections. Disagreements may be attributable to the use of differing original sources, a differ- ence in the definition of geographic limits (the 50 states, conterminous United States only, or the United States including certain outlying areas and possessions), or to possible adjustments made in the United States’ figures by other sources to make them more comparable with figures from other countries. International comparisons of national accounts data—To compare national accounts data for different countries, it is necessary to convert each country’s data into a common unit of currency, usually the U.S. dollar. The market exchange rates, which often are used in converting national currencies, do not necessarily reflect the relative purchasing power in the various countries. It is necessary that the goods and services produced in differ- ent countries be valued consistently if the differences observed are meant to reflect real differences in the volumes of goods and services produced. The use of pur- chasing power parities (see Tables 1347, 1348, and 1394) instead of exchange rates is intended to achieve this objective. The method used to present the data shown in Table 1348 is to construct volume measures directly by revaluing the goods and services sold in different countries at a common set of interna- tional prices. By dividing the ratio of the gross domestic products of two countries expressed in their own national currencies by the corresponding ratio calculated at constant international prices, it is possible to derive the implied purchasing power parity (PPP) between the two currencies concerned. PPPs show how many units of currency are needed in one country to buy the same amount of goods and services that one unit of currency will buy in the other country. For further information, see National Accounts, Main Aggregates, Volume I, issued annually by the Organi- sation for Economic Cooperation and Development, Paris, France. International Standard Industrial Classification—The original version of the International Standard Industrial Classification of All Economic Activities (ISIC) was adopted in 1948. A number of countries have utilized the ISIC as the basis for devising their industrial classifi- cation scheme. Substantial comparability has been attained between the industrial classifi- cations of many other countries, includ- ing the United States and the ISIC by ensuring, as far as practicable, that the categories at detailed levels of classifica- tion in national schemes fit into only one category of the ISIC. The United Nations, the International Labour Organization, the Food and Agriculture Organization, and other international bodies use the ISIC in publishing and analyzing statistical data. Revisions of the ISIC were issued in 1958, 1968, 1989, 2002, and 2008. International maps—A series of regional world maps is provided on pages 826–834. References are included in Table 1331 for easy location of individual countries on the maps. The Robinson map projection is used for this series of maps. A map projection is used to portray all or part of the round Earth on a flat surface, but this cannot be done without some distortion. For the Robinson projection, distortion is very low along the Equator and within 45 degrees of the center but is greatest near the poles. For additional information on map projections and maps, please contact the Earth Sci- ence Information Center, U.S. Geological Survey, 507 National Center, Reston, VA 22092.
- 5. International Statistics 827 U.S. Census Bureau, Statistical Abstract of the United States: 2012 Puerto Rico (U.S.) Galapagos Islands (Ecuador) ALASKA (U.S.) Franz Josef Land (Russia) Saint Pierre and Miquelon (FR.) Bermuda (U.K.) Russia Peru MEXICO Ecuador Cuba Colombia UNITED STATES Svalbard (Norway) Iceland GREENLAND (DENMARK) CANADA Hudson Bay A T L A N T I C O C E A N P A C I F I C O C E A N A R C T I C O C E A N Gulf of Mexico Bering Sea Chukchi Sea Beaufort Sea Baffin Bay Labrador Sea Greenland Sea Caribbean Sea S1 - North American Region
- 6. 828InternationalStatistics U.S.CensusBureau,StatisticalAbstractoftheUnitedStates:2012 BARBADOS GRENADA SAINT VINCENT AND THE GRENADINES ANTIGUA AND BARBUDA Caribbean Sea P A C I F I C O C E A N A T L A N T I C O C E A N Gulf of Mexico JAMAICA CAYMAN ISLANDS (U.K.) MONTSERRAT (U.K.) BRITISH VIRGIN ISLANDS (U.K.) VIRGIN ISLANDS (U.S.) ANGUILLA (U.K.) ARUBA (NETH.) CURAÇO (NETH.) SAINT BARTHELEMY (FR.) SAINT-MARTIN (FR.) SINT MAARTEN (NETH.) TURKS AND CAICOS ISLANDS (U.K.) SAINT LUCIA SAINT KITTS AND NEVIS PUERTO RICO (U.S.) MARTINIQUE (FR.) HAITI GUADELOUPE (FR.) DOMINICAN REPUBLIC DOMINICA CUBA TRINIDAD AND TOBAGO PANAMA NICARAGUA Mexico HONDURAS Guyana GUATEMALA EL SALVADOR COSTA RICA BELIZE THE BAHAMAS VenezuelaColombia United States S2-CentralAmericaandtheCaribbeanRegion
- 7. International Statistics 829 U.S. Census Bureau, Statistical Abstract of the United States: 2012 URUGUAY PARAGUAY GUYANA ECUADOR BOLIVIA VENEZUELA SOUTH GEORGIA AND SOUTH SANDWICH ISLANDS (U.K.) PERU SURINAME FRENCH GUIANA (FR.) COLOMBIA CHILE BRAZIL ARGENTINA FALKLAND ISLANDS (U.K.) A T L A N T I C O C E A N P A C I F I C O C E A N Caribbean Sea S3 - South American Region
- 8. 830 International Statistics U.S. Census Bureau, Statistical Abstract of the United States: 2012 ANDORRALibyaSudanChadRUSSIA SWITZER- LANDLIECHTENSTEIN SICILY (IT) CORSICA (FR)SARDINIA (IT) BALEARIC ISLANDS (SP) CRETE (GR) FAROE ISLANDS (DEN) SHETLAND ISLANDS (U.K.)MALTA FAROE ISLANDS (DEN) SHETLAND ISLANDS (U.K.) GIBRALTAR (U.K.) GUERNSEY (U.K.) JERSEY (U.K.) ISLE OF MAN (U.K.) Libya Chad Sudan UKRAINE UNITED KINGDOM Turkey Tunisia SWEDEN SPAIN PORTUGAL POLAND NORWAY NETHERLANDS Morocco MONACO LUXEMBOURG LITHUANIA LATVIA ITALY ICELAND GERMANY FRANCE FINLAND ESTONIA IRELAND Egypt DENMARK BELARUS BELGIUM Algeria Russia GREECE KOSOVO AUSTRIA GERMANY HOLY SEE ITALY ROMANIA UKRAINE BULGARIA HUNGARY GREECE POLAND CROATIA CZECH REPUBLIC SAN MARINO SERBIA SLOVAKIA M O LD O VA ALBANIA MACEDONIA SLOVENIA BOSNIA AND HERZEGOVINA MONTENEGRO Area Enlarged Below Turkey Mediterranean Sea Black Sea A T L A N T I C O C E A N Adriatic Sea Norwegian Sea Baltic Sea North Sea Celtic Sea Bay of Biscay Ionian SeaTyrrhenian Sea Aegean Sea S4 - European Region
- 9. International Statistics 831 U.S. Census Bureau, Statistical Abstract of the United States: 2012 EQUATORIAL GUINEA CANARY ISLANDS (SPAIN) COMOROS MADEIRA ISLANDS (PORTUGAL) Area Enlarged Below SEYCHELLES MAURITIUS CAPE VERDE MAYOTTE (FRANCE) SAINT HELENA (UNITED KINGDOM) ETHIOPIA ERITREA UGANDA TANZANIA Turkey TUNISIA SAO TOME AND PRINCIPE Syria SUDAN Spain MOROCCO SOMALIA SOUTH AFRICA Saudi Arabia RWANDA Portugal NIGERIA NIGER M OZAM BIQUE MAURITANIA MALI MALAWI MADAGASCAR LIBYA LESOTHO KENYA Iraq Italy Iran Greece GABON EGYPT DJIBOUTI CENTRAL AFRICAN REPUBLIC CA M ERO O N CONGO (KINSHASA) CONGO (BRAZZAVILLE) CHAD BURUNDI BOTSWANA ANGOLA ALGERIA ZIMBABWE ZAMBIA Yemen SWAZILAND WESTERN SAHARA (MOROCCO) NAMIBIA A T L A N T I C O C E A N Red Sea Mediterranean Sea I N D I A N O C E A N S5 - African Region MALI GUINEA GHANA SENEGAL COTE D'IVOIRE BURKINA FASO NIGER BENIN LIBERIA MAURITANIA TOGO SIERRA LEONE GUINEA- BISSAU THE GAMBIA
- 10. 832InternationalStatistics U.S.CensusBureau,StatisticalAbstractoftheUnitedStates:2012 Red Sea Mediterranean Sea Black Sea Caspian Sea Arabian Sea Persian Gulf Gulf of Aden Aegean Sea AdriaticSea WEST BANK GAZA STRIP Gulf of Oman Ethiopia UZBEKISTAN Ukraine TURKMENISTAN TURKEY TAJIKISTAN SYRIA Sudan SAUDI ARABIA Romania QATAR PAKISTAN Nepal OMAN Libya LEBANON Kazakhstan KUWAIT KYRGYZSTAN JORDAN IRAQISRAEL IRAN India Greece GEORGIA Eritrea Egypt Chad Bulgaria BAHRAIN ARMENIA AZERBAIJAN AFGHANISTAN UNITED ARAB EMIRATES Russia YEMEN SOCOTRA (YEM) CYPRUS China S6-MiddleEasternRegion
- 11. InternationalStatistics833 U.S.CensusBureau,StatisticalAbstractoftheUnitedStates:2012 Belarus Kyrgyzstan JAPAN MALDIVES Hong Kong Macau Uzbekistan Ukraine Turkm enistan Sweden Saudi Arabia PHILIPPINES Pakistan NEPAL Oman MONGOLIA KAZAKHSTAN SOUTH KOREA Iraq Iran INDIA Finland Northern Mariana Islands (U.S.) Afghanistan TAIWAN NORTH KOREA SRI LANKA CHINA RUSSIA INDIA CHINA THAILAND LAOS BURMA VIETNAM CAMBODIA BANGLADESH BHUTAN Area Enlarged to Right A R C T I C O C E A N I N D I A N O C E A N Sea of Okhotsk Bay of Bengal Bering Sea S7-AsianRegion Barents Sea Kara Sea Laptev Sea Caspian Sea Arabian Sea South China Sea Philippine Sea Sea of Japan Gulf of Thailand P A C I F I C O C E A N
- 12. 834InternationalStatistics U.S.CensusBureau,StatisticalAbstractoftheUnitedStates:2012 FIJI AMERICAN SAMOA (U.S.) SAMOA HAWAII (U.S.) MARSHALL ISLANDS KIRIBATI FRENCH POLYNESIA (FR.) TONGA NIUE (N.Z.) SOLOMON ISLANDS NAURU PALAU South China Sea Philippine Sea I N D I A N O C E A N P A C I F I C O C E A N Coral Sea Tasman Sea BRUNEI TIMOR-LESTE TUVALU SINGAPORE GUAM (U.S.) COOK ISLANDS (N.Z.) WALLIS AND FUTUNA (FR.) Philippines NEW ZEALAND MALAYSIA INDONESIA FEDERATED STATES OF MICRONESIA NORTHERN MARIANA ISLANDS (U.S.) AUSTRALIA TASMANIA (AU.) VANUATU PAPUA NEW GUINEA Thailand NEW CALEDONIA (FR.) S8-OceaniaRegion
- 13. International Statistics 835 U.S. Census Bureau, Statistical Abstract of the United States: 2012 Table 1329. Total World Population: 1980 to 2050 [As of midyear (4,453 represents 4,453,000,000)] Year Population (mil.) Average annual 1 Year Population (mil.) Average annual 1 Growth rate (percent) Population change (mil.) Growth rate (percent) Population change (mil.) 1980. . . . . . . . . 4,453 1.8 82.7 2015. . . . . . . . 7,231 1.0 74.7 1985. . . . . . . . . 4,858 1.7 83.7 2020. . . . . . . . 7,597 0.9 70.8 1990. . . . . . . . . 5,289 1.6 83.0 2025. . . . . . . . 7,941 0.8 65.6 1995. . . . . . . . . 5,700 1.4 80.1 2030. . . . . . . . 8,259 0.7 60.4 2007. . . . . . . . . 6,624 1.2 77.2 2035. . . . . . . . 8,551 0.6 55.5 2008. . . . . . . . . 6,701 1.1 76.2 2040. . . . . . . . 8,820 0.6 50.8 2009. . . . . . . . . 6,777 1.1 76.1 2045. . . . . . . . 9,064 0.5 45.9 2010. . . . . . . . . 6,853 1.1 76.1 2050. . . . . . . . 9,284 (NA) (NA) NA Not available. 1 Represents change from year shown to immediate succeeding year. Source: U.S. Census Bureau, International Data Base, <http://www.census.gov/ipc/www/idb/>, accessed June 2010. Table 1330. Population by Continent: 1980 to 2050 [In millions, except percent (4,453 represents 4,453,000,000). As of midyear] Year World Africa 1 North America 1 South America 1 Asia Europe 1 Oceania 1980. . . . . . . . . . . . . . . . . . . . . 4,453 479 371 242 2,644 695 23 1990. . . . . . . . . . . . . . . . . . . . . 5,289 630 424 297 3,189 723 26 2000. . . . . . . . . . . . . . . . . . . . . 6,089 803 486 348 3,691 730 30 2010. . . . . . . . . . . . . . . . . . . . . 6,853 1,015 539 396 4,133 734 35 2020. . . . . . . . . . . . . . . . . . . . . 7,597 1,261 595 440 4,531 731 39 2030. . . . . . . . . . . . . . . . . . . . . 8,259 1,532 648 477 4,841 718 43 2040. . . . . . . . . . . . . . . . . . . . . 8,820 1,827 695 504 5,049 698 46 2050. . . . . . . . . . . . . . . . . . . . . 9,284 2,138 739 520 5,167 671 49 PERCENT DISTRIBUTION 1980. . . . . . . . . . . . . . . . . . . . . 100.0 10.7 8.3 5.4 59.4 15.6 0.5 2000. . . . . . . . . . . . . . . . . . . . . 100.0 13.2 8.0 5.7 60.6 12.0 0.5 2050. . . . . . . . . . . . . . . . . . . . . 100.0 23.0 8.0 5.6 55.7 7.2 0.5 1 Estimates and projections for France include the four overseas departments of French Guiana, Guadeloupe, Martinique, and Reunion in the national total. These areas are included in the same regions as France (Europe). Saint Barthelemy and Saint Martin recently voted to become French overseas collectivities apart from Guadeloupe and are included in the totals for North America. Source: U.S. Census Bureau, International Data Base, <http://www.census.gov/ipc/www/idb/>, accessed June 2010. Table 1331. Population and Population Change by Development Status: 1950 to 2050 [(2,557 represents 2,557,000,000). As of midyear. Minus sign (–) indicates decrease. The “less developed” countries include all of Africa, all of Asia except Japan, the Transcaucasian and Central Asian republics of the New Independent States, all of Latin America and the Caribbean, and all of Oceania except Australia, New Zealand, and Hawaii. This category matches the “less developed country” classification employed by the United Nations] Year Number (mil.) Percent of world World Less developed countries 1 More developed countries 1 Less developed countries 1 More developed countries 1 POPULATION 1950. . . . . . . . . . . . . . . 2,557 1,749 807 68.4 31.6 1960. . . . . . . . . . . . . . . 3,042 2,132 911 70.1 29.9 1970. . . . . . . . . . . . . . . 3,713 2,709 1,004 73.0 27.0 1980. . . . . . . . . . . . . . . 4,453 3,371 1,082 75.7 24.3 1990. . . . . . . . . . . . . . . 5,289 4,145 1,144 78.4 21.6 2000. . . . . . . . . . . . . . . 6,089 4,895 1,193 80.4 19.6 2010. . . . . . . . . . . . . . . 6,853 5,622 1,231 82.0 18.0 2020. . . . . . . . . . . . . . . 7,597 6,338 1,259 83.4 16.6 2030. . . . . . . . . . . . . . . 8,259 6,984 1,275 84.6 15.4 2040. . . . . . . . . . . . . . . 8,820 7,539 1,281 85.5 14.5 2050. . . . . . . . . . . . . . . 9,284 8,005 1,279 86.2 13.8 POPULATION CHANGE 1950–1960. . . . . . . . . . 486 382 104 78.7 21.3 1960–1970. . . . . . . . . . 670 578 93 86.2 13.8 1970–1980. . . . . . . . . . 740 662 78 89.4 10.6 1980–1990. . . . . . . . . . 836 774 62 92.5 7.5 1990–2000. . . . . . . . . . 800 751 49 93.8 6.2 2000–2010. . . . . . . . . . 764 727 38 95.1 4.9 2010–2020. . . . . . . . . . 744 716 28 96.2 3.8 2020–2030. . . . . . . . . . 662 646 16 97.6 2.4 2030–2040. . . . . . . . . . 561 555 6 99.0 1.0 2040–2050. . . . . . . . . . 464 466 –2 100.3 –0.3 1 See footnote 1, Table 1330. Source: U.S. Census Bureau, International Data Base, <http://www.census.gov/ipc/www/idb/>, accessed June 2010.
- 14. 836 International Statistics U.S. Census Bureau, Statistical Abstract of the United States: 2012 Table 1332. Population by Country or Area: 1990 to 2020 [5,288,828 represents 5,288,828,000. Covers countries or areas with populations of 5,000 or more in 2010. Population data generally are de facto figures for the present territory. Population estimates were derived from information available as of spring 2010. See text of this section for general comments concerning the data. For details of methodology, coverage, and reliability, see source. Minus sign (–) indicates decrease] Country or area Map refer- ence 1 Mid-year population (1,000) Popula- tion rank, 2010 Annual rate of growth,2 2010 to 2020 (percent) Popula- tion per sq. mile, 2010 Area 3 (sq. mile)1990 2000 2010 2020, proj. World. . . . . . . . . . . . . . . S0 5,288,828 6,088,684 6,853,019 7,597,239 (X) 1.0 134 50,972,239 Afghanistan. . . . . . . . . . . . . S6 13,449 22,021 29,121 35,975 41 2.1 116 251,826 Albania. . . . . . . . . . . . . . . . . S4 3,245 3,158 2,987 3,075 135 0.3 282 10,578 Algeria. . . . . . . . . . . . . . . . . S5 25,089 30,429 34,586 38,594 35 1.1 38 919,591 Andorra. . . . . . . . . . . . . . . . S4 53 65 85 86 199 0.1 468 181 Angola. . . . . . . . . . . . . . . . . S5 8,297 10,377 13,068 15,898 70 2.0 27 481,351 Antigua and Barbuda. . . . . . S2 64 75 87 98 198 1.2 508 171 Argentina. . . . . . . . . . . . . . . S3 33,036 37,336 41,343 45,379 32 0.9 39 1,056,637 Armenia. . . . . . . . . . . . . . . . S6 3,377 3,043 2,967 3,017 137 0.2 272 10,889 Australia. . . . . . . . . . . . . . . . S8 16,956 19,053 21,516 23,939 54 1.1 7 2,966,138 Austria. . . . . . . . . . . . . . . . . S4 7,723 8,113 8,214 8,220 92 (Z) 258 31,832 Azerbaijan. . . . . . . . . . . . . . S6 7,200 7,809 8,304 9,058 91 0.9 260 31,903 Bahamas, The. . . . . . . . . . . S2 245 283 310 338 177 0.8 80 3,865 Bahrain . . . . . . . . . . . . . . . . S6 501 635 738 827 163 1.1 2,580 286 Bangladesh. . . . . . . . . . . . . S7 112,213 132,151 156,118 183,109 7 1.6 3,106 50,258 Barbados. . . . . . . . . . . . . . . S2 262 274 286 295 180 0.3 1,721 166 Belarus . . . . . . . . . . . . . . . . S4 10,201 10,034 9,613 9,249 88 –0.4 123 78,340 Belgium. . . . . . . . . . . . . . . . S4 9,969 10,264 10,423 10,465 79 (Z) 892 11,690 Belize. . . . . . . . . . . . . . . . . . S2 191 248 315 380 176 1.9 36 8,805 Benin. . . . . . . . . . . . . . . . . . S5 4,705 6,619 9,056 11,956 90 2.8 212 42,711 Bhutan. . . . . . . . . . . . . . . . . S7 615 606 700 782 164 1.1 47 14,824 Bolivia. . . . . . . . . . . . . . . . . S3 6,574 8,195 9,947 11,640 84 1.6 24 418,263 Bosnia and Herzegovina. . . S4 4,424 4,035 4,622 4,592 120 –0.1 234 19,763 Botswana. . . . . . . . . . . . . . . S5 1,265 1,680 2,029 2,312 144 1.3 9 218,815 Brazil. . . . . . . . . . . . . . . . . . S3 151,170 176,320 201,103 222,608 5 1.0 62 3,266,183 Brunei . . . . . . . . . . . . . . . . . S8 253 325 395 464 175 1.6 194 2,033 Bulgaria. . . . . . . . . . . . . . . . S4 8,894 7,818 7,149 6,569 98 –0.8 171 41,888 Burkina Faso. . . . . . . . . . . . S5 8,361 11,588 16,242 21,978 61 3.0 154 105,714 Burma. . . . . . . . . . . . . . . . . S7 40,464 47,439 53,414 59,126 24 1.0 212 252,320 Burundi . . . . . . . . . . . . . . . . S5 5,536 6,823 9,863 13,429 85 3.1 995 9,915 Cambodia . . . . . . . . . . . . . . S7 9,368 12,351 14,454 16,927 66 1.6 212 68,152 Cameroon. . . . . . . . . . . . . . S5 11,884 15,343 19,294 23,471 58 2.0 106 182,513 Canada. . . . . . . . . . . . . . . . S1 27,791 31,100 33,760 36,387 36 0.7 10 3,511,006 Cape Verde. . . . . . . . . . . . . S5 340 430 509 583 169 1.4 327 1,557 Central African Republic. . . S5 3,085 3,980 4,845 5,991 116 2.1 20 240,534 Chad. . . . . . . . . . . . . . . . . . S5 5,841 7,943 10,543 12,756 78 1.9 22 486,177 Chile . . . . . . . . . . . . . . . . . . S3 13,129 15,156 16,746 18,058 60 0.8 58 287,186 China 4 . . . . . . . . . . . . . . . . . S7 1,148,364 1,263,638 1,330,141 1,384,545 1 0.4 360 3,694,942 Colombia. . . . . . . . . . . . . . . S3 33,147 38,910 44,205 49,085 29 1.0 103 428,225 Comoros. . . . . . . . . . . . . . . S5 429 579 773 1,001 160 2.6 896 863 Congo (Brazzaville) 5 . . . . . . S5 2,266 3,104 4,126 5,444 126 2.8 31 131,853 Congo (Kinshasa) 5 . . . . . . . S5 39,047 51,849 70,916 95,605 19 3.0 81 875,308 Costa Rica. . . . . . . . . . . . . . S2 3,023 3,883 4,516 5,098 122 1.2 229 19,714 Cote d’Ivoire . . . . . . . . . . . . S5 12,491 16,885 21,059 25,504 57 1.9 172 122,781 Croatia. . . . . . . . . . . . . . . . . S4 4,508 4,411 4,487 4,427 123 –0.1 208 21,612 Cuba. . . . . . . . . . . . . . . . . . S2 10,513 11,106 11,477 11,647 73 0.1 271 42,402 Cyprus. . . . . . . . . . . . . . . . . S6 745 920 1,103 1,267 157 1.4 309 3,568 Czech Republic. . . . . . . . . . S4 10,310 10,270 10,202 10,013 81 –0.2 342 29,825 Denmark. . . . . . . . . . . . . . . S4 5,141 5,337 5,516 5,642 109 0.2 337 16,384 Djibouti. . . . . . . . . . . . . . . . . S5 499 669 741 922 162 2.2 83 8,950 Dominica. . . . . . . . . . . . . . . S2 70 71 73 74 201 0.2 251 290 Dominican Republic. . . . . . . S2 7,084 8,469 9,824 11,109 86 1.2 527 18,656 Ecuador. . . . . . . . . . . . . . . . S3 10,318 12,446 14,791 16,905 65 1.3 138 106,888 Egypt. . . . . . . . . . . . . . . . . . S5 54,907 65,159 80,472 96,260 16 1.8 209 384,344 El Salvador . . . . . . . . . . . . . S2 5,110 5,850 6,052 6,217 106 0.3 756 8,000 Equatorial Guinea. . . . . . . . S5 371 491 651 836 166 2.5 60 10,830 Eritrea. . . . . . . . . . . . . . . . . S5 3,138 4,197 5,793 7,260 108 2.3 149 38,996 Estonia. . . . . . . . . . . . . . . . . S4 1,569 1,380 1,291 1,203 154 –0.7 79 16,366 Ethiopia. . . . . . . . . . . . . . . . S5 48,397 64,165 88,013 120,420 14 3.1 228 386,100 Fiji. . . . . . . . . . . . . . . . . . . . S8 740 805 876 936 158 0.7 124 7,056 Finland. . . . . . . . . . . . . . . . . S4 4,986 5,169 5,255 5,272 112 (Z) 45 117,303 France. . . . . . . . . . . . . . . . . S4 58,168 61,137 64,768 67,518 21 0.4 262 247,125 Gabon. . . . . . . . . . . . . . . . . S5 938 1,236 1,545 1,877 151 1.9 16 99,485 Gambia, The. . . . . . . . . . . . S5 949 1,368 1,824 2,317 147 2.4 472 3,861 Georgia. . . . . . . . . . . . . . . . S6 5,426 4,777 4,601 4,440 121 –0.4 171 26,911 Germany 6 . . . . . . . . . . . . . . S4 79,380 82,188 82,283 81,422 15 –0.1 611 134,622 Ghana. . . . . . . . . . . . . . . . . S5 15,408 19,752 24,340 28,784 47 1.7 277 87,851 Greece. . . . . . . . . . . . . . . . . S4 10,130 10,559 10,750 10,742 75 (–Z) 213 50,443 Grenada. . . . . . . . . . . . . . . . S2 94 102 108 113 191 0.5 812 133 Guatemala. . . . . . . . . . . . . . S2 8,966 11,085 13,550 16,264 68 1.8 328 41,374 Guinea. . . . . . . . . . . . . . . . . S5 6,118 8,350 10,324 13,420 80 2.6 109 94,871 Guinea-Bissau. . . . . . . . . . . S5 996 1,279 1,565 1,893 150 1.9 144 10,857 Guyana. . . . . . . . . . . . . . . . S3 772 786 748 754 161 0.1 10 76,003 Haiti. . . . . . . . . . . . . . . . . . . S2 6,798 8,413 9,649 10,693 87 1.0 907 10,641 Honduras. . . . . . . . . . . . . . . S2 4,794 6,359 7,989 9,465 93 1.7 185 43,201 Hungary. . . . . . . . . . . . . . . . S4 10,372 10,147 9,992 9,772 83 –0.2 289 34,598 Iceland. . . . . . . . . . . . . . . . . S1 255 281 309 329 178 0.6 8 38,707 India. . . . . . . . . . . . . . . . . . . S7 838,159 1,006,300 1,173,108 1,326,093 2 1.2 1,022 1,147,951 Indonesia. . . . . . . . . . . . . . . S8 181,770 213,829 242,968 267,532 4 1.0 347 699,447 Iran . . . . . . . . . . . . . . . . . . . S6 58,100 68,632 76,923 86,543 18 1.2 130 591,349 See footnotes at end of table.
- 15. International Statistics 837 U.S. Census Bureau, Statistical Abstract of the United States: 2012 Table 1332. Population by Country or Area: 1990 to 2020—Con. [See headnote, page 836] Country or area Map refer- ence 1 Mid-year population (1,000) Popula- tion rank, 2010 Annual rate of growth, 2 2010 to 2020 (percent) Popula- tion per sq. mile, 2010 Area 3 (sq. mile)1990 2000 2010 2020, proj. Iraq . . . . . . . . . . . . . . . . . . . . . . . . . S6 18,140 22,679 29,672 36,889 40 2.2 176 168,868 Ireland. . . . . . . . . . . . . . . . . . . . . . . S4 3,508 3,822 4,623 5,177 119 1.1 174 26,596 Israel. . . . . . . . . . . . . . . . . . . . . . . . S6 4,478 6,115 7,354 8,479 96 1.4 880 8,356 Italy. . . . . . . . . . . . . . . . . . . . . . . . . S4 56,743 57,719 58,091 57,028 23 –0.2 512 113,568 Jamaica. . . . . . . . . . . . . . . . . . . . . . S2 2,347 2,616 2,847 3,051 138 0.7 681 4,182 Japan. . . . . . . . . . . . . . . . . . . . . . . . S7 123,537 126,729 126,804 121,633 10 –0.4 901 140,728 Jordan. . . . . . . . . . . . . . . . . . . . . . . S6 3,267 4,688 6,407 7,278 102 1.3 187 34,286 Kazakhstan. . . . . . . . . . . . . . . . . . . S7 16,398 15,032 15,460 15,977 63 0.3 15 1,042,355 Kenya. . . . . . . . . . . . . . . . . . . . . . . . S5 23,354 30,508 40,047 48,319 33 1.9 182 219,745 Kiribati. . . . . . . . . . . . . . . . . . . . . . . S8 71 85 99 112 195 1.2 318 313 Korea, North . . . . . . . . . . . . . . . . . . S7 20,019 21,263 22,757 23,433 50 0.3 490 46,490 Korea, South. . . . . . . . . . . . . . . . . . S7 42,869 46,839 48,636 49,362 26 0.1 1,300 37,421 Kosovo. . . . . . . . . . . . . . . . . . . . . . . S4 1,862 1,700 1,815 1,933 148 0.6 432 4,203 Kuwait. . . . . . . . . . . . . . . . . . . . . . . S6 2,142 1,974 2,789 3,744 139 2.9 405 6,880 Kyrgyzstan. . . . . . . . . . . . . . . . . . . . S6 4,382 4,851 5,509 6,314 110 1.4 74 74,054 Laos. . . . . . . . . . . . . . . . . . . . . . . . . S7 4,210 5,397 6,368 7,447 104 1.6 71 89,112 Latvia. . . . . . . . . . . . . . . . . . . . . . . . S4 2,664 2,376 2,218 2,077 141 –0.7 92 24,034 Lebanon. . . . . . . . . . . . . . . . . . . . . . S6 3,440 3,791 4,125 4,243 127 0.3 1,044 3,950 Lesotho. . . . . . . . . . . . . . . . . . . . . . S5 1,703 1,916 1,920 1,969 146 0.3 164 11,720 Liberia. . . . . . . . . . . . . . . . . . . . . . . S5 2,139 2,601 3,685 4,727 129 2.5 99 37,189 Libya . . . . . . . . . . . . . . . . . . . . . . . . S5 4,146 5,125 6,461 7,759 101 1.8 10 679,359 Liechtenstein. . . . . . . . . . . . . . . . . . S4 29 32 35 37 211 0.5 567 62 Lithuania. . . . . . . . . . . . . . . . . . . . . S4 3,695 3,654 3,545 3,435 130 –0.3 146 24,201 Luxembourg. . . . . . . . . . . . . . . . . . . S4 383 439 498 556 170 1.1 498 998 Macedonia. . . . . . . . . . . . . . . . . . . . S4 1,861 2,015 2,072 2,113 143 0.2 211 9,820 Madagascar. . . . . . . . . . . . . . . . . . . S5 11,633 15,742 21,282 28,374 56 2.9 95 224,533 Malawi. . . . . . . . . . . . . . . . . . . . . . . S5 9,546 11,802 15,448 20,204 64 2.7 425 36,324 Malaysia . . . . . . . . . . . . . . . . . . . . . S8 17,882 23,151 28,275 32,652 43 1.4 223 126,895 Maldives . . . . . . . . . . . . . . . . . . . . . S7 217 300 396 392 174 –0.1 3,439 115 Mali. . . . . . . . . . . . . . . . . . . . . . . . . S5 8,327 10,621 13,796 17,890 67 2.6 29 471,116 Malta. . . . . . . . . . . . . . . . . . . . . . . . S4 359 390 407 419 173 0.3 3,334 122 Marshall Islands. . . . . . . . . . . . . . . . S8 46 53 66 78 204 1.7 942 70 Mauritania. . . . . . . . . . . . . . . . . . . . S5 1,925 2,501 3,205 4,005 133 2.2 8 397,954 Mauritius. . . . . . . . . . . . . . . . . . . . . S5 1,062 1,186 1,294 1,379 153 0.6 1,651 784 Mexico. . . . . . . . . . . . . . . . . . . . . . . S1 84,914 99,927 112,469 124,654 11 1.0 150 750,558 Micronesia, Federated States of. . . S8 109 108 107 102 192 –0.5 395 271 Moldova. . . . . . . . . . . . . . . . . . . . . . S4 4,394 4,391 4,317 4,267 124 –0.1 340 12,699 Monaco. . . . . . . . . . . . . . . . . . . . . . S4 30 32 31 31 213 0.1 39,609 1 Mongolia. . . . . . . . . . . . . . . . . . . . . S7 2,218 2,664 3,087 3,535 134 1.4 5 599,828 Montenegro. . . . . . . . . . . . . . . . . . . S4 583 732 667 639 165 –0.4 128 5,194 Morocco. . . . . . . . . . . . . . . . . . . . . . S5 24,000 28,113 31,627 34,956 38 1.0 184 172,317 Mozambique. . . . . . . . . . . . . . . . . . S5 12,667 18,125 22,061 26,480 52 1.8 73 303,622 Namibia. . . . . . . . . . . . . . . . . . . . . . S5 1,471 1,893 2,128 2,263 142 0.6 7 317,873 Nauru. . . . . . . . . . . . . . . . . . . . . . . . S8 9 10 9 10 223 0.5 1,143 8 Nepal. . . . . . . . . . . . . . . . . . . . . . . . S7 18,918 24,818 28,952 34,209 42 1.7 523 55,348 Netherlands. . . . . . . . . . . . . . . . . . . S4 14,952 15,908 16,783 17,332 59 0.3 1,283 13,086 New Zealand. . . . . . . . . . . . . . . . . . S8 3,414 3,802 4,252 4,615 125 0.8 41 103,363 Nicaragua . . . . . . . . . . . . . . . . . . . . S2 3,685 4,935 5,996 7,030 107 1.6 129 46,328 Niger. . . . . . . . . . . . . . . . . . . . . . . . S5 7,842 10,951 15,878 22,749 62 3.6 32 489,073 Nigeria. . . . . . . . . . . . . . . . . . . . . . . S5 96,604 123,179 152,217 182,344 8 1.8 433 351,648 Norway. . . . . . . . . . . . . . . . . . . . . . . S4 4,242 4,492 4,676 4,836 118 0.3 40 117,483 Oman. . . . . . . . . . . . . . . . . . . . . . . . S6 1,794 2,432 2,968 3,635 136 2.0 25 119,498 Pakistan. . . . . . . . . . . . . . . . . . . . . . S6 118,816 152,429 184,405 213,719 6 1.5 620 297,635 Palau. . . . . . . . . . . . . . . . . . . . . . . . S8 15 19 21 22 218 0.4 118 177 Panama. . . . . . . . . . . . . . . . . . . . . . S2 2,393 2,900 3,411 3,894 132 1.3 119 28,703 Papua New Guinea. . . . . . . . . . . . . S8 3,683 4,813 6,065 7,259 105 1.8 35 174,849 Paraguay. . . . . . . . . . . . . . . . . . . . . S3 4,200 5,418 6,376 7,192 103 1.2 42 153,398 Peru. . . . . . . . . . . . . . . . . . . . . . . . . S3 21,600 26,087 29,907 33,230 39 1.1 61 494,207 Philippines. . . . . . . . . . . . . . . . . . . . S7 65,088 81,222 99,900 119,329 12 1.8 868 115,124 Poland. . . . . . . . . . . . . . . . . . . . . . . S4 38,119 38,654 38,464 37,949 34 –0.1 327 117,473 Portugal. . . . . . . . . . . . . . . . . . . . . . S4 9,923 10,336 10,736 10,842 76 0.1 304 35,317 Qatar. . . . . . . . . . . . . . . . . . . . . . . . S6 446 627 841 905 159 0.7 188 4,473 Romania . . . . . . . . . . . . . . . . . . . . . S4 22,866 22,447 21,959 21,303 53 –0.3 247 88,761 Russia. . . . . . . . . . . . . . . . . . . . . . . S7 147,973 146,710 139,390 132,242 9 –0.5 22 6,323,451 Rwanda. . . . . . . . . . . . . . . . . . . . . . S5 6,999 8,398 11,056 14,327 74 2.6 1,161 9,524 Saint Kitts and Nevis. . . . . . . . . . . . S2 42 46 50 54 208 0.8 495 101 Saint Lucia. . . . . . . . . . . . . . . . . . . . S2 138 153 161 166 188 0.3 688 234 Saint Vincent and the Grenadines. . S2 107 108 104 101 194 –0.3 694 150 Samoa. . . . . . . . . . . . . . . . . . . . . . . S8 163 176 192 204 185 0.6 176 1,089 San Marino . . . . . . . . . . . . . . . . . . . S4 23 27 31 34 212 0.8 1,336 24 Sao Tome and Principe. . . . . . . . . . S5 116 141 176 211 187 1.8 472 372 Saudi Arabia. . . . . . . . . . . . . . . . . . S6 16,061 21,312 25,732 29,819 46 1.5 31 829,996 Senegal. . . . . . . . . . . . . . . . . . . . . . S5 7,348 9,469 12,323 15,736 71 2.4 166 74,336 Serbia . . . . . . . . . . . . . . . . . . . . . . . S4 7,786 7,604 7,345 7,012 97 –0.5 246 29,913 Seychelles. . . . . . . . . . . . . . . . . . . . S5 71 79 88 96 197 0.8 503 176 Sierra Leone. . . . . . . . . . . . . . . . . . S5 4,228 3,809 5,246 6,625 113 2.3 190 27,653 Singapore . . . . . . . . . . . . . . . . . . . . S8 3,047 4,037 4,701 5,015 117 0.6 17,723 265 Slovakia. . . . . . . . . . . . . . . . . . . . . . S4 5,263 5,400 5,470 5,494 111 (Z) 295 18,573 Slovenia. . . . . . . . . . . . . . . . . . . . . . S4 1,991 2,011 2,003 1,951 145 –0.3 257 7,780 Solomon Islands. . . . . . . . . . . . . . . S8 321 434 559 685 168 2.0 52 10,805 Somalia. . . . . . . . . . . . . . . . . . . . . . S5 6,692 7,386 10,112 13,272 82 2.7 42 242,215 See footnotes at end of table.
- 16. 838 International Statistics U.S. Census Bureau, Statistical Abstract of the United States: 2012 Table 1332. Population by Country or Area: 1990 to 2020—Con. [See headnote, page 836] Country or area Map refer- ence 1 Mid-year population (1,000) Popula- tion rank, 2010 Annual rate of growth, 2 2010 to 2020 (percent) Popula- tion per sq. mile, 2010 Area 3 (sq. mile)1990 2000 2010 2020, proj. South Africa. . . . . . . . . . . . . . S5 38,476 45,064 49,109 48,530 25 –0.1 105 468,907 Spain. . . . . . . . . . . . . . . . . . . S4 39,351 40,589 46,506 50,016 27 0.7 241 192,656 Sri Lanka. . . . . . . . . . . . . . . . S7 17,365 19,436 21,514 23,112 55 0.7 862 24,954 Sudan . . . . . . . . . . . . . . . . . . S5 25,888 34,109 43,940 56,292 30 2.5 48 917,374 Suriname. . . . . . . . . . . . . . . . S3 395 432 487 537 172 1.0 8 60,232 Swaziland . . . . . . . . . . . . . . . S5 882 1,144 1,354 1,513 152 1.1 204 6,642 Sweden. . . . . . . . . . . . . . . . . S4 8,601 8,924 9,074 9,245 89 0.2 57 158,430 Switzerland. . . . . . . . . . . . . . S4 6,837 7,267 7,623 7,751 94 0.2 494 15,443 Syria . . . . . . . . . . . . . . . . . . . S6 12,500 16,471 22,198 24,744 51 1.1 313 70,900 Tajikistan. . . . . . . . . . . . . . . . S6 5,272 6,230 7,487 8,874 95 1.7 137 54,637 Tanzania . . . . . . . . . . . . . . . . S5 25,214 33,712 41,893 49,989 31 1.8 122 342,008 Thailand. . . . . . . . . . . . . . . . . S7 55,197 62,157 67,090 70,768 20 0.5 340 197,255 Timor-Leste. . . . . . . . . . . . . . S8 746 847 1,155 1,389 156 1.8 201 5,743 Togo. . . . . . . . . . . . . . . . . . . . S5 3,721 4,992 6,587 8,608 100 2.7 314 20,998 Tonga. . . . . . . . . . . . . . . . . . . S8 92 102 123 141 189 1.4 443 277 Trinidad and Tobago . . . . . . . S2 1,255 1,252 1,229 1,209 155 –0.2 621 1,980 Tunisia. . . . . . . . . . . . . . . . . . S5 8,211 9,568 10,589 11,559 77 0.9 177 59,985 Turkey. . . . . . . . . . . . . . . . . . S6 56,561 67,329 77,804 86,757 17 1.1 262 297,155 Turkmenistan. . . . . . . . . . . . . S6 3,658 4,385 4,941 5,529 115 1.1 27 181,440 Tuvalu . . . . . . . . . . . . . . . . . . S8 9 10 10 11 222 0.8 1,043 10 Uganda. . . . . . . . . . . . . . . . . S5 17,456 23,956 33,399 47,691 37 3.6 439 76,100 Ukraine . . . . . . . . . . . . . . . . . S4 51,622 49,005 45,416 42,561 28 –0.6 203 223,679 United Arab Emirates . . . . . . S6 1,826 3,219 4,976 6,495 114 2.7 154 32,278 United Kingdom. . . . . . . . . . . S4 57,411 59,140 62,348 65,761 22 0.5 667 93,409 United States. . . . . . . . . . . . S1 249,623 282,172 310,233 341,387 3 1.0 88 3,537,438 Uruguay. . . . . . . . . . . . . . . . . S3 3,110 3,328 3,510 3,653 131 0.4 52 67,573 Uzbekistan. . . . . . . . . . . . . . . S6 20,530 25,042 27,866 30,565 44 0.9 170 164,247 Vanuatu. . . . . . . . . . . . . . . . . S8 154 190 222 251 184 1.2 47 4,706 Venezuela. . . . . . . . . . . . . . . S3 19,325 23,493 27,223 31,276 45 1.4 80 340,560 Vietnam. . . . . . . . . . . . . . . . . S7 67,258 79,178 89,571 98,721 13 1.0 748 119,718 Yemen. . . . . . . . . . . . . . . . . . S6 12,416 17,407 23,495 29,727 48 2.4 115 203,849 Zambia. . . . . . . . . . . . . . . . . . S5 7,858 10,345 13,460 18,065 69 2.9 47 287,026 Zimbabwe. . . . . . . . . . . . . . . S5 10,156 11,820 11,652 15,832 72 3.1 78 149,362 OTHER Taiwan 4 . . . . . . . . . . . . . . . . . S7 20,278 22,183 23,025 23,278 49 0.1 1,849 12,456 AREAS OF SPECIAL SOVEREIGNTY AND DEPENDENCIES American Samoa. . . . . . . . . . S8 47 58 66 75 203 1.2 865 77 Anguilla. . . . . . . . . . . . . . . . . S1 8 11 15 18 220 2.0 420 35 Aruba. . . . . . . . . . . . . . . . . . . S1 63 90 105 119 193 1.3 1,505 69 Bermuda. . . . . . . . . . . . . . . . S1 58 63 68 72 202 0.5 3,274 21 Cayman Islands. . . . . . . . . . . S1 26 38 50 62 207 2.1 493 102 Cook Islands. . . . . . . . . . . . . S8 18 16 11 9 221 –2.9 126 91 Faroe Islands. . . . . . . . . . . . . S4 47 46 49 52 209 0.5 91 538 French Polynesia. . . . . . . . . . S8 202 249 291 329 179 1.2 197 1,478 Gaza Strip 7 . . . . . . . . . . . . . . S6 646 1,130 1,604 2,121 149 2.8 11,542 139 Gibraltar. . . . . . . . . . . . . . . . . S4 29 27 29 30 215 0.2 11,506 3 Greenland. . . . . . . . . . . . . . . S1 56 57 58 58 206 (–Z) (Z) 160,075 Guam. . . . . . . . . . . . . . . . . . . S8 134 155 181 204 186 1.2 861 210 Guernsey. . . . . . . . . . . . . . . . S4 63 62 65 67 205 0.3 2,151 30 Hong Kong. . . . . . . . . . . . . . . S7 5,688 6,659 7,090 7,328 99 0.3 17,422 407 Isle of Man. . . . . . . . . . . . . . . S4 69 76 84 90 200 0.8 380 221 Jersey. . . . . . . . . . . . . . . . . . S4 84 87 93 101 196 0.8 2,085 45 Macau. . . . . . . . . . . . . . . . . . S7 352 432 568 614 167 0.8 52,163 11 Mayotte. . . . . . . . . . . . . . . . . S5 90 156 231 312 182 3.0 1,601 144 Montserrat. . . . . . . . . . . . . . . S2 11 4 5 5 227 0.5 130 39 Netherlands Antilles 8 . . . . . . S2 189 210 229 243 183 0.6 740 309 New Caledonia . . . . . . . . . . . S8 169 211 252 290 181 1.4 36 7,056 Northern Mariana Islands. . . S8 44 70 48 49 210 0.1 270 179 Puerto Rico. . . . . . . . . . . . . . S2 3,537 3,814 3,979 4,051 128 0.2 1,162 3,425 Saint Barthelemy. . . . . . . . . . S2 5 7 7 7 225 –0.4 913 8 Saint Helena. . . . . . . . . . . . . S5 7 7 8 8 224 0.2 64 119 Saint Martin. . . . . . . . . . . . . . S2 30 28 30 33 214 0.7 1,439 21 Saint Pierre and Miquelon. . . S1 6 6 6 5 226 –1.1 64 93 Turks and Caicos Islands. . . . S2 12 18 24 29 217 2.2 64 366 Virgin Islands. . . . . . . . . . . . . S2 104 109 110 108 190 –0.1 822 134 Virgin Islands, British. . . . . . . S2 16 20 25 29 216 1.5 428 58 Wallis and Futuna. . . . . . . . . S8 13 15 15 16 219 0.3 280 55 West Bank 7 . . . . . . . . . . . . . . S6 1,253 1,980 2,515 3,058 140 2.0 1,155 2,178 Western Sahara. . . . . . . . . . . S5 217 336 492 652 171 2.8 5 102,703 X Not applicable. Z Less than 0.05 percent or less than one person per square mile. 1 See maps on pp. 826–834 for geographic locations. 2 Computed by the exponential method. For explanation of average annual percent change, see Guide to Tabular Presentation. 3 Source: Central Intelligence Agency, “CIA World Factbook,” accessed August 2010. (Data converted from square kilometers to square miles). 4 With the establishment of diplomatic relations with China on January 1, 1979, the U.S. government recognized the People’s Republic of China as the sole legal government of China and acknowledged the Chinese position that there is only one China and that Taiwan is part of China. 5 “Congo” is the official short-form name for both the Republic of Congo and the Democratic Republic of the Congo. To distinguish one from the other the U.S. Department of State adds the capital in parentheses. This practice is unofficial and provisional. 6 Data for 1990 are for former West Germany and East Germany combined. 7 The Gaza Strip and West Bank are Israeli occupied with interim status subject to Israeli/Palestinian negotiations. The final status is yet to be determined. 8 See footnote 4, Table 1398. Source: Except as noted, U.S. Census Bureau, International Data Base, <http://www.census.gov/ipc/www/idb/>, accessed June 2010.
- 17. International Statistics 839 U.S. Census Bureau, Statistical Abstract of the United States: 2012 Table 1334. Age Distribution by Country or Area: 2010 and 2020 [In percent. Covers countries with 13 million or more population in 2010] Country or area 2010 2020, proj. Country or area 2010 2020, proj. Under 15 years old 65 years old and over Under 15 years old 65 years old and over Under 15 years old 65 years old and over Under 15 years old 65 years old and over World. . . . . . . . . . . . . . 26.5 7.8 24.6 9.6 Madagascar. . . . . . . 43.3 3.0 41.4 3.3 Malawi. . . . . . . . . . . 45.3 2.7 43.1 2.8 Afghanistan. . . . . . . . . . 42.9 2.4 38.2 2.7 Malaysia . . . . . . . . . 29.9 4.8 26.8 6.9 Algeria. . . . . . . . . . . . . . 24.7 5.1 21.9 6.9 Mali. . . . . . . . . . . . . 47.5 3.0 44.9 2.9 Angola. . . . . . . . . . . . . . 43.4 2.7 41.5 2.5 Mexico. . . . . . . . . . . 28.7 6.4 25.0 8.3 Argentina. . . . . . . . . . . . 25.5 10.9 23.7 12.4 Morocco. . . . . . . . . . 28.2 6.0 24.9 7.5 Australia. . . . . . . . . . . . . 18.4 13.7 17.6 17.0 Mozambique. . . . . . 44.1 2.9 42.1 3.1 Bangladesh. . . . . . . . . . 34.8 4.6 28.3 5.8 Nepal. . . . . . . . . . . . 35.6 4.3 27.6 5.1 Brazil. . . . . . . . . . . . . . . 26.5 6.6 23.6 8.8 Netherlands. . . . . . . 17.2 15.2 15.5 19.4 Burkina Faso. . . . . . . . . 46.0 2.5 44.3 2.4 Niger. . . . . . . . . . . . 49.7 2.3 48.4 2.3 Burma. . . . . . . . . . . . . . 27.9 5.0 24.7 6.2 Nigeria. . . . . . . . . . . 41.2 3.1 37.9 3.4 Cambodia . . . . . . . . . . . 32.5 3.7 30.2 4.6 Pakistan. . . . . . . . . . 36.1 4.2 29.7 4.8 Cameroon. . . . . . . . . . . 40.7 3.3 37.4 3.7 Peru. . . . . . . . . . . . . 28.5 5.8 24.4 7.6 Canada. . . . . . . . . . . . . 15.9 15.5 15.4 20.1 Philippines. . . . . . . . 34.9 4.2 31.6 5.4 Chile . . . . . . . . . . . . . . . 22.7 9.3 19.9 12.4 Poland. . . . . . . . . . . 14.8 13.5 14.6 18.6 China 1 . . . . . . . . . . . . . . 17.9 8.6 17.0 12.4 Romania . . . . . . . . . 14.9 14.8 14.1 17.6 Colombia. . . . . . . . . . . . 27.2 6.0 23.3 8.4 Russia. . . . . . . . . . . 15.0 13.3 16.3 16.0 Congo (Kinshasa) 2 . . . . 46.7 2.5 44.4 2.6 Saudi Arabia. . . . . . 30.1 2.9 25.0 3.8 Cote d’Ivoire . . . . . . . . . 40.2 2.9 35.6 3.7 South Africa. . . . . . . 28.6 5.5 26.9 7.4 Ecuador. . . . . . . . . . . . . 30.6 6.3 25.8 8.1 Spain. . . . . . . . . . . . 15.0 16.9 15.0 18.5 Egypt. . . . . . . . . . . . . . . 32.8 4.4 30.3 6.0 Sri Lanka. . . . . . . . . 23.6 8.3 21.1 11.5 Ethiopia. . . . . . . . . . . . . 46.2 2.7 45.4 2.7 Sudan . . . . . . . . . . . 42.5 2.6 39.6 3.1 France. . . . . . . . . . . . . . 18.6 16.5 17.8 20.0 Syria . . . . . . . . . . . . 35.8 3.7 30.0 4.6 Germany. . . . . . . . . . . . 13.5 20.4 12.9 22.6 Taiwan 1 . . . . . . . . . . 16.2 10.8 12.9 15.5 Ghana. . . . . . . . . . . . . . 36.8 3.6 32.4 4.0 Tanzania . . . . . . . . . 42.5 2.9 36.4 3.3 Guatemala. . . . . . . . . . . 38.7 3.8 33.0 4.9 Thailand. . . . . . . . . . 20.1 8.9 17.9 12.3 India. . . . . . . . . . . . . . . . 30.1 5.3 26.3 6.7 Turkey. . . . . . . . . . . 26.9 6.2 23.4 8.1 Indonesia. . . . . . . . . . . . 27.7 6.1 23.8 7.7 Uganda. . . . . . . . . . 50.0 2.1 49.5 1.9 Iran . . . . . . . . . . . . . . . . 24.4 5.0 23.3 6.1 Ukraine . . . . . . . . . . 13.7 15.5 14.5 17.8 Iraq . . . . . . . . . . . . . . . . 38.4 3.1 33.7 3.9 United Kingdom. . . . 17.4 16.3 17.6 18.5 Italy. . . . . . . . . . . . . . . . 13.4 20.3 12.0 23.1 United States. . . . . 20.1 13.0 20.0 16.1 Japan. . . . . . . . . . . . . . . 13.3 22.6 11.3 28.3 Uzbekistan. . . . . . . . 27.3 4.7 23.2 5.9 Kazakhstan. . . . . . . . . . 21.6 7.6 22.2 9.5 Venezuela. . . . . . . . 30.0 5.3 26.1 7.4 Kenya. . . . . . . . . . . . . . . 42.3 2.7 36.4 3.3 Vietnam. . . . . . . . . . 25.6 5.5 22.6 6.9 Korea, North . . . . . . . . . 20.9 9.6 19.6 10.6 Yemen. . . . . . . . . . . 43.5 2.6 37.3 3.0 Korea, South. . . . . . . . . 16.2 11.1 12.6 15.6 Zambia. . . . . . . . . . . 46.7 2.5 46.2 2.5 1 See footnote 4, Table 1332. 2 See footnote 5, Table 1332. Source: U.S. Census Bureau, International Data Base, <http://www.census.gov/ipc/www/idb/>, accessed June 2010. Table 1333. Foreign or Foreign-Born Population, Labor Force, and Net Migration in Selected OECD Countries: 2000 and 2007 [31,108 represents 31,108,000. In Australia and the United States, the data refer to people present in the country who are foreign born. In the European countries and Japan, they generally refer to foreigners and represent the nationalities of residents. Minus sign (–) indicates net loss] Country Foreign population 1 Foreign labor force 2 Average net migration 1990–2007 3 (per 1,000 population) Number (1,000) Percent of total population Number (1,000) Percent of total population 2000 2007 2000 2007 2000 2007 2000 2007 United States. . . . . . . . 31,108 41,100 11.0 13.6 18,029 24,778 12.9 16.3 4.0 Australia. . . . . . . . . . . . . 4,412 5,254 23.0 25.0 2,373 2,827 24.7 25.8 5.7 Austria. . . . . . . . . . . . . . 702 840 8.7 10.1 346 452 10.6 13.1 3.9 Belgium. . . . . . . . . . . . . 862 971 8.4 9.1 388 449 8.6 9.5 3.2 Denmark. . . . . . . . . . . . 259 299 4.8 5.5 97 127 3.4 4.4 2.2 France. . . . . . . . . . . . . . (NA) (NA) (NA) (NA) 1,578 1,486 6.0 5.4 1.3 Germany. . . . . . . . . . . . 7,297 6,745 8.9 8.2 3,546 3,874 8.8 9.4 3.0 Italy 4 . . . . . . . . . . . . . . . 1,380 3,433 2.4 5.8 838 1,638 3.9 6.6 3.8 Japan 5 . . . . . . . . . . . . . . 1,686 2,151 1.3 1.7 155 194 0.2 0.3 –0.1 Luxembourg. . . . . . . . . . 165 206 37.3 43.2 153 222 58.0 66.6 9.8 Netherlands. . . . . . . . . . 668 688 4.2 4.2 300 314 3.9 3.6 1.8 Spain 6 . . . . . . . . . . . . . . 1,371 5,221 3.4 11.6 455 1,981 2.5 9.0 7.0 Sweden. . . . . . . . . . . . . 477 525 5.4 5.7 222 (NA) 5.0 (NA) 3.0 Switzerland 7 . . . . . . . . . 1,384 1,571 19.3 20.8 717 876 20.1 21.3 4.3 United Kingdom 8 . . . . . . 2,342 3,824 4.0 6.5 1,107 2,035 4.0 7.2 0.7 NA Not available. 1 Data are from population registers of foreigners except for France, Greece, Mexico, and Poland (census), Ireland and the United Kingdom (Labour Force Survey), Portugal (residence permits), Australia (inter- and post-censal estimates), and the United States (Current Population Survey). 2 Includes unemployed except for Belgium, Greece, Norway, Luxembourg, Netherlands, and the United Kingdom. Germany, Luxembourg, and Netherlands include cross-border workers. Belgium and Italy include the self-employed. Data for Austria, Germany, and Luxembourg are from social security registers, and for Denmark, from the register of population. Data for Italy, Spain, and Switzerland are from residence or work permits. Figures for Japan and Netherlands are estimates. Data for other countries are from labor force surveys. 3 Or latest period available. 4 Children under 18 who are registered on their parents’ permit are not counted. 5 Data are based on registered foreign nationals which include foreigners staying in Japan for more than 90 days. 6 Number of foreigners with a residence permit. Permits of short duration (less than 6 months) as well as students are excluded. 7 Number of foreigners with an annual residence permit or with a settlement permit (permanent permit). Seasonal and frontier workers are excluded. 8 Estimated from the annual labour force survey. Fluctuations from year to year may be due to sampling error. Source: Organization for Economic Cooperation and Development (OECD), 2010, “International migration database”, OECD International Migration Statistics database and “Population and vital statistics,” Labour Force Statistics database (copyright), <http://dx.doi.org/10.1787/data-00287-en> and <http://dx.doi.org/10.1787/data-00342-en>, accessed May 2010.
- 18. 840 International Statistics U.S. Census Bureau, Statistical Abstract of the United States: 2012 Table 1335. Births to Unmarried Women by Country: 1980 to 2008 [Percent of all live births] Country 1980 1990 2000 2005 2006 2007 2008 United States. . . . . . . . . . . 18.4 28.0 33.2 36.9 38.5 39.7 40.6 Canada. . . . . . . . . . . . . . . . 12.8 24.4 28.3 25.6 27.1 27.3 (NA) Japan. . . . . . . . . . . . . . . . . . 0.8 1.1 1.6 2.0 2.1 (NA) (NA) Denmark. . . . . . . . . . . . . . . 33.2 46.4 44.6 45.7 46.4 46.1 46.2 France. . . . . . . . . . . . . . . . . 11.4 30.1 43.6 48.4 50.5 51.7 52.6 Germany 1 . . . . . . . . . . . . . . (X) 15.1 23.4 29.2 30.0 30.8 32.1 Ireland. . . . . . . . . . . . . . . . . 5.9 14.6 31.5 31.8 32.7 (NA) (NA) Italy. . . . . . . . . . . . . . . . . . . 4.3 6.5 9.7 15.2 16.2 17.7 (NA) Netherlands. . . . . . . . . . . . . 4.1 11.4 24.9 34.9 37.1 39.5 41.2 Spain. . . . . . . . . . . . . . . . . . 3.9 9.6 17.7 26.6 28.4 30.2 31.7 Sweden. . . . . . . . . . . . . . . . 39.7 47.0 55.3 55.4 55.5 54.8 54.7 United Kingdom. . . . . . . . . . 11.5 27.9 39.5 42.9 43.7 (NA) (NA) NA Not available. X Not applicable. 1 Data are for 1991 instead of 1990. Source: U.S. Bureau of Labor Statistics, updated and revised from “Families and Work Transition in 12 Countries, 1980–2001,” Monthly Labor Review, September 2003, with national sources, some of which may be unpublished. Table 1336. Marriage and Divorce Rates by Country: 1980 to 2008 [Per 1,000 population aged 15–64 years] Country Marriage rate Divorce rate 1980 1990 2000 2008 1980 1990 2000 2008 United States 1 . . . . . . . . 15.9 14.9 12.5 10.6 7.9 7.2 6.2 5.2 Canada. . . . . . . . . . . . . . 11.5 10.0 7.5 6.4 3.7 4.2 3.4 (NA) Japan. . . . . . . . . . . . . . . . 9.8 8.4 9.2 (NA) 1.8 1.8 3.1 (NA) Denmark. . . . . . . . . . . . . 8.0 9.1 10.8 10.3 4.1 4.0 4.0 4.1 France. . . . . . . . . . . . . . . 9.7 7.7 7.9 6.6 2.4 2.8 3.0 (NA) Germany 2 . . . . . . . . . . . . (X) 8.2 7.6 6.9 (X) 2.5 3.5 3.5 Ireland 3 . . . . . . . . . . . . . . 10.9 8.3 7.6 (NA) (NA) (NA) 1.0 (NA) Italy. . . . . . . . . . . . . . . . . 8.7 8.2 7.3 6.3 0.3 0.7 1.0 1.3 Netherlands. . . . . . . . . . . 9.6 9.4 8.2 6.7 2.7 2.8 3.2 2.9 Spain. . . . . . . . . . . . . . . . 9.4 8.5 7.9 6.2 (NA) 0.9 1.4 3.5 Sweden. . . . . . . . . . . . . . 7.1 7.4 7.0 8.3 3.7 3.5 3.8 3.5 United Kingdom. . . . . . . . 11.6 10.0 8.0 (NA) 4.1 4.1 4.0 (NA) NA Not available. X Not applicable. 1 Divorce rates exclude data for California, Georgia, Hawaii, Indiana, Louisiana, and Minnesota in 2008. 2 Data are for 1991 instead of 1990. 3 Divorce not allowed by law prior to 1997. Source: U.S. Bureau of Labor Statistics, updated and revised from “Families and Work in Transition in 12 Countries, 1980–2001,” Monthly Labor Review, September 2003, with national sources, some of which may be unpublished. Table 1337. Single-Parent Households: 1980 to 2009 [In thousands (6,061 represents 6,061,000), except for percent. For the United Kingdom in 1981, children are defined as those under 15 and those who are 15, 16, or 17 and attended school full-time; for later years, children are defined as those under 16 and those who are 16 or 17 and attend school full-time. For Ireland, children are defined as those under 15. For Denmark for 2009 and France, children are defined as those under 25. For Canada for 2001 onward and for Germany for 1995 onward, children are of all ages. For Germany in 1991 and all other countries, children are defined as those under 18 living at home, or away at school. Data are generally for the entire year, but in some instances they are only for a particular month within the year] Country and year Number (1,000) Percent of all households with children Country and year Number (1,000) Percent of all households with children United States: 1980. . . . . . . . . . . . . . . . . . 6,061 19.5 Germany: 1990. . . . . . . . . . . . . . . . . . 7,752 24.0 1991. . . . . . . . . . . . . . . . . 1,429 15.2 2000. . . . . . . . . . . . . . . . . . 9,357 27.0 1995 1 . . . . . . . . . . . . . . . 2,496 18.8 2008. . . . . . . . . . . . . . . . . . 10,536 29.5 2000 1 . . . . . . . . . . . . . . . 2,274 17.6 Canada: 2008. . . . . . . . . . . . . . . . . 2,616 21.7 1981. . . . . . . . . . . . . . . . . . 437 12.7 Ireland: 2 1991. . . . . . . . . . . . . . . . . . 572 16.2 1981. . . . . . . . . . . . . . . . . 30 7.2 2001 1 . . . . . . . . . . . . . . . . 1,184 23.5 1991. . . . . . . . . . . . . . . . . 44 10.7 2006. . . . . . . . . . . . . . . . . . 1,276 24.6 2002. . . . . . . . . . . . . . . . . 50 17.4 Japan: 2006. . . . . . . . . . . . . . . . . 78 22.6 1980. . . . . . . . . . . . . . . . . . 796 4.9 Netherlands: 1990. . . . . . . . . . . . . . . . . . 934 6.5 1988. . . . . . . . . . . . . . . . . 179 9.6 2000. . . . . . . . . . . . . . . . . . 996 8.3 2000. . . . . . . . . . . . . . . . . 240 13.0 2005. . . . . . . . . . . . . . . . . . 1,163 10.2 2009 1 . . . . . . . . . . . . . . . 310 16.0 Denmark: 2 Sweden: 1980. . . . . . . . . . . . . . . . . . 99 13.4 1985. . . . . . . . . . . . . . . . . 117 11.2 1990. . . . . . . . . . . . . . . . . . 117 17.8 1995 1 . . . . . . . . . . . . . . . 189 17.4 2001. . . . . . . . . . . . . . . . . . 120 18.4 2000. . . . . . . . . . . . . . . . . 233 21.4 2009 1 . . . . . . . . . . . . . . . . 165 21.7 2008. . . . . . . . . . . . . . . . . 200 18.7 France: United Kingdom: 3 1982. . . . . . . . . . . . . . . . . . 887 10.2 1981. . . . . . . . . . . . . . . . . 1,010 13.9 1990. . . . . . . . . . . . . . . . . . 1,175 13.2 1991. . . . . . . . . . . . . . . . . 1,344 19.4 1999. . . . . . . . . . . . . . . . . . 1,494 17.4 2000. . . . . . . . . . . . . . . . . 1,434 20.7 2005 1 . . . . . . . . . . . . . . . . 1,725 19.8 2008. . . . . . . . . . . . . . . . . 1,750 25.0 1 Break in series. 2 Data are from family-based, rather than household-based, statistics. 3 Great Britain only (excludes Northern Ireland). Source: U.S. Bureau of Labor Statistics, updated and revised from “Families and Work in Transition in 12 Countries, 1980–2001,” Monthly Labor Review, September 2003, with national sources, some of which may be unpublished.
- 19. International Statistics 841 U.S. Census Bureau, Statistical Abstract of the United States: 2012 Table 1338. Percent Distribution of Households by Type and Country: 1980 to 2009 [Data are generally for the entire year, but in some instances they are only for a particular month within the year] Year Total Married-couple households 1 Single parent 2 One person Other 3 Total With children 2 Without children 2 United States: 1980. . . . . . . . . . . . . 100.0 60.8 30.9 29.9 7.5 22.7 9.0 1990. . . . . . . . . . . . . 100.0 56.0 26.3 29.8 8.3 24.6 11.0 1995. . . . . . . . . . . . . 100.0 54.4 25.5 28.9 9.1 25.0 11.5 2000. . . . . . . . . . . . . 100.0 52.8 24.1 28.7 8.9 25.5 12.7 2008. . . . . . . . . . . . . 100.0 50.0 21.6 28.4 9.0 27.5 13.5 Canada: 1981. . . . . . . . . . . . . 100.0 66.8 36.3 30.5 5.3 20.3 7.6 1991. . . . . . . . . . . . . 100.0 62.8 29.6 33.2 5.7 22.9 8.6 2001 4 . . . . . . . . . . . 100.0 58.5 33.4 25.2 10.2 25.7 5.5 2006. . . . . . . . . . . . . 100.0 57.4 31.4 26.1 10.3 26.8 5.5 Japan: 1980. . . . . . . . . . . . . 100.0 68.4 42.9 25.6 2.2 19.8 9.5 1990. . . . . . . . . . . . . 100.0 65.2 33.1 32.1 2.3 23.1 9.4 1995. . . . . . . . . . . . . 100.0 62.8 27.4 35.4 2.0 25.6 9.6 2000. . . . . . . . . . . . . 100.0 60.3 23.6 36.7 2.1 27.6 10.0 2005. . . . . . . . . . . . . 100.0 57.6 20.8 36.8 2.4 29.5 10.5 Denmark: 5 1980. . . . . . . . . . . . . 100.0 50.3 25.0 25.3 3.9 44.9 1.0 1990. . . . . . . . . . . . . 100.0 45.6 19.5 26.1 4.2 49.6 0.6 1995. . . . . . . . . . . . . 100.0 44.9 18.2 26.6 4.2 50.4 0.5 2001. . . . . . . . . . . . . 100.0 45.7 18.5 27.2 4.2 49.6 0.6 2009 4 . . . . . . . . . . . 100.0 47.4 21.2 26.1 5.9 46.2 0.6 France: 1982. . . . . . . . . . . . . 100.0 67.5 39.8 27.7 4.5 24.6 3.4 1990. . . . . . . . . . . . . 100.0 64.0 35.9 28.1 5.5 27.1 3.4 1999. . . . . . . . . . . . . 100.0 59.3 29.9 29.4 6.3 31.0 3.4 2005 4 . . . . . . . . . . . 100.0 56.4 27.2 29.2 6.7 32.8 4.1 Germany: 1991. . . . . . . . . . . . . 100.0 55.3 31.6 23.7 7.1 33.6 4.0 1995. . . . . . . . . . . . . 100.0 53.3 29.2 24.0 6.8 34.9 5.1 2000 4 . . . . . . . . . . . 100.0 56.8 28.0 28.8 6.0 36.1 1.2 2005. . . . . . . . . . . . . 100.0 54.7 25.5 29.1 6.4 37.5 1.4 2008. . . . . . . . . . . . . 100.0 52.6 23.6 29.0 6.5 39.4 1.5 Ireland: 1981. . . . . . . . . . . . . 100.0 (NA) (NA) (NA) (NA) 16.9 (NA) 1991. . . . . . . . . . . . . 100.0 61.6 47.9 13.7 10.6 20.2 7.6 1996. . . . . . . . . . . . . 100.0 59.6 44.5 15.1 11.2 21.5 7.7 2002. . . . . . . . . . . . . 100.0 59.2 41.4 17.7 11.7 21.6 7.6 2006. . . . . . . . . . . . . 100.0 57.3 37.4 20.0 11.6 22.4 8.7 Netherlands: 1988. . . . . . . . . . . . . 100.0 64.7 37.3 27.4 5.4 28.7 1.2 1993. . . . . . . . . . . . . 100.0 63.1 33.3 29.9 5.0 30.9 1.0 2000 4 . . . . . . . . . . . 100.0 60.2 30.6 29.6 5.6 33.4 0.7 2005. . . . . . . . . . . . . 100.0 58.5 29.4 29.1 6.3 34.5 0.7 2007. . . . . . . . . . . . . 100.0 57.7 28.7 28.9 6.4 35.3 0.7 2009. . . . . . . . . . . . . 100.0 57.0 28.1 28.9 6.5 35.8 0.7 Sweden: 1985. . . . . . . . . . . . . 100.0 54.8 23.8 31.0 3.2 36.1 5.9 1990. . . . . . . . . . . . . 100.0 52.1 21.9 30.2 3.9 39.6 4.4 1995 4 . . . . . . . . . . . 100.0 50.7 21.2 29.4 4.6 42.3 2.4 2000. . . . . . . . . . . . . 100.0 45.8 19.1 26.7 5.3 46.5 2.3 2008. . . . . . . . . . . . . 100.0 44.5 18.6 25.9 4.4 48.1 3.0 United Kingdom: 6 1981. . . . . . . . . . . . . 100.0 65.0 31.0 34.0 5.0 22.0 8.0 1991. . . . . . . . . . . . . 100.0 61.0 25.0 36.0 6.0 27.0 6.0 1994–95. . . . . . . . . . 100.0 58.0 25.0 33.0 7.0 27.0 8.0 2000. . . . . . . . . . . . . 100.0 58.0 23.0 35.0 6.0 29.0 7.0 2008. . . . . . . . . . . . . 100.0 56.0 21.0 35.0 7.0 30.0 7.0 NA Not available. 1 May include unmarried cohabitating couples. Such couples are explicitly included under married couples in Canada, Denmark, Ireland, France, the Netherlands, Sweden, and the United Kingdom. In Germany, cohabitants are grouped with married couples beginning in 2000. In other countries, some unmarried cohabitants are included as married couples, while some are classified under “other households.” 2 Children are defined as unmarried children living at home according to the following age limits: under 18 years old in the United States, Canada (1981–96), Japan, Denmark (1980–2007), Sweden, and the United Kingdom, except that the United Kingdom includes 15-, 16-, and 17-year-olds in 1981 and 16- and 17-year-olds thereafter only if they are attending school full-time; under 25 years old in Denmark (2009 only) and France; and children of all ages in Canada (2001 onward), Germany, Ireland, and the Netherlands. 3 Includes both family and nonfamily households not elsewhere classified. These households comprise, for example, siblings residing together, other households composed of relatives, and households made up of roommates. Some unmarried cohabitating couples may also be included in the “other” group. See footnote 1. 4 Break in series. 5 From family-based statistics. However, one person living alone constitutes a family in Denmark. In this respect, the Danish data are closer to household statistics. 6 Great Britain only (excludes Northern Ireland). Source: U.S. Bureau of Labor Statistics, updated and revised from “Families and Work in Transition in 12 Countries, 1980–2001,” Monthly Labor Review, September 2003, with national sources, some of which may be unpublished.
- 20. 842 International Statistics U.S. Census Bureau, Statistical Abstract of the United States: 2012 Table 1339. Births, Deaths, and Life Expectancy by Country or Area: 2010 and 2020 [Covers countries with 13 million or more population in 2010] Country or area Crude birth rate 1 Crude death rate 2 Expectation of life at birth (years) Infant mortality rate 3 Total fertility rate per woman 4 2010 2020, proj. 2010 2020, proj. 2010 2020, proj. 2010 2020, proj. 2010 2020, proj. United States. . . . . . . . . . 13.8 13.5 8.4 8.5 78.2 79.5 6.1 5.4 2.06 2.06 Afghanistan. . . . . . . . . . . . 38.1 34.4 17.7 15.2 44.7 48.3 151.5 129.1 5.50 4.38 Algeria. . . . . . . . . . . . . . . . 16.7 14.9 4.7 5.0 74.3 76.5 26.8 18.7 1.76 1.70 Angola. . . . . . . . . . . . . . . . 43.3 39.1 23.7 20.5 38.5 41.4 178.1 156.0 6.05 5.16 Argentina. . . . . . . . . . . . . . 17.8 15.6 7.4 7.3 76.8 78.5 11.1 8.5 2.33 2.15 Australia. . . . . . . . . . . . . . . 12.4 11.9 6.8 7.5 81.7 82.5 4.7 4.1 1.78 1.76 Bangladesh. . . . . . . . . . . . 23.4 19.5 5.8 5.6 69.4 72.4 52.5 36.8 2.65 2.24 Brazil. . . . . . . . . . . . . . . . . 18.1 15.5 6.4 6.6 72.3 74.8 21.9 15.9 2.19 2.06 Burkina Faso. . . . . . . . . . . 44.0 39.9 13.0 10.6 53.3 56.9 83.0 67.8 6.21 5.49 Burma. . . . . . . . . . . . . . . . 19.5 17.3 8.2 7.9 64.5 68.0 50.8 37.2 2.28 2.09 Cambodia . . . . . . . . . . . . . 25.6 21.3 8.2 7.3 62.3 65.9 56.9 43.7 2.90 2.39 Cameroon. . . . . . . . . . . . . 33.6 28.3 12.0 10.7 54.0 57.0 62.2 50.4 4.25 3.47 Canada. . . . . . . . . . . . . . . 10.3 10.1 7.9 9.0 81.3 82.2 5.0 4.4 1.58 1.61 Chile . . . . . . . . . . . . . . . . . 14.5 13.2 5.9 6.7 77.5 79.2 7.5 6.0 1.90 1.77 China 5 . . . . . . . . . . . . . . . . 12.2 11.0 6.9 8.3 74.5 76.0 16.5 12.6 1.54 1.58 Colombia. . . . . . . . . . . . . . 17.8 15.4 5.2 5.6 74.3 76.6 16.9 12.3 2.18 1.94 Congo (Kinshasa) 6 . . . . . . 42.3 37.7 11.4 9.4 54.7 58.1 79.4 61.8 6.11 5.16 Cote d’Ivoire . . . . . . . . . . . 31.5 26.1 10.4 9.1 56.2 59.9 66.4 51.6 4.01 3.15 Ecuador. . . . . . . . . . . . . . . 20.3 17.0 5.0 5.2 75.5 77.5 20.3 15.0 2.46 2.09 Egypt. . . . . . . . . . . . . . . . . 25.0 20.8 4.9 4.8 72.4 74.9 26.2 17.9 3.01 2.67 Ethiopia. . . . . . . . . . . . . . . 43.3 39.8 11.3 9.1 55.8 59.4 79.0 61.7 6.07 5.53 France. . . . . . . . . . . . . . . . 12.4 11.3 8.7 9.6 81.1 82.0 3.3 3.1 1.97 1.90 Germany. . . . . . . . . . . . . . 8.2 8.4 11.0 12.2 79.4 80.7 4.0 3.6 1.42 1.49 Ghana. . . . . . . . . . . . . . . . 28.1 22.7 8.9 7.3 60.6 65.3 49.9 38.1 3.57 2.75 Guatemala. . . . . . . . . . . . . 27.4 22.7 5.0 4.6 70.6 73.4 26.9 19.2 3.36 2.57 India. . . . . . . . . . . . . . . . . . 21.3 18.2 7.5 7.3 66.5 69.7 49.1 35.4 2.65 2.35 Indonesia. . . . . . . . . . . . . . 18.5 15.6 6.3 6.6 71.1 73.7 28.9 20.4 2.28 2.04 Iran . . . . . . . . . . . . . . . . . . 18.5 16.2 5.9 6.0 69.8 72.4 43.5 33.6 1.89 1.81 Iraq . . . . . . . . . . . . . . . . . . 29.4 23.4 4.9 4.3 70.3 73.1 43.2 30.3 3.76 2.96 Italy. . . . . . . . . . . . . . . . . . 8.0 7.3 10.8 12.0 80.3 81.4 5.4 4.6 1.32 1.42 Japan. . . . . . . . . . . . . . . . . 7.4 6.7 9.8 12.5 82.2 82.9 2.8 2.7 1.20 1.30 Kazakhstan. . . . . . . . . . . . 16.7 14.1 9.4 9.1 68.2 71.2 24.9 18.2 1.87 1.83 Kenya. . . . . . . . . . . . . . . . . 35.1 20.8 9.3 7.9 58.8 61.8 53.5 42.4 4.38 2.57 Korea, North . . . . . . . . . . . 14.6 13.1 10.6 11.2 64.1 67.6 50.2 38.0 1.94 1.82 Korea, South. . . . . . . . . . . 8.7 8.2 6.2 7.6 78.8 81.1 4.2 3.6 1.22 1.29 Madagascar. . . . . . . . . . . . 37.9 33.8 8.0 6.4 63.3 66.8 52.8 40.2 5.09 4.44 Malawi. . . . . . . . . . . . . . . . 41.3 36.5 13.7 10.9 50.9 55.3 83.5 63.1 5.51 4.68 Malaysia . . . . . . . . . . . . . . 21.4 18.3 4.9 5.3 73.6 75.9 15.5 11.4 2.70 2.43 Mali. . . . . . . . . . . . . . . . . . 46.1 41.0 14.6 11.4 52.2 56.6 113.7 91.9 6.54 5.51 Mexico. . . . . . . . . . . . . . . . 19.4 17.0 4.8 5.3 76.3 78.1 17.8 13.2 2.31 2.14 Morocco. . . . . . . . . . . . . . . 19.4 16.9 4.7 5.0 75.7 77.7 28.6 19.5 2.23 2.07 Mozambique. . . . . . . . . . . 37.8 36.2 19.8 18.2 41.4 43.2 103.8 86.2 5.13 4.58 Nepal. . . . . . . . . . . . . . . . . 22.4 19.7 6.9 6.4 65.8 69.2 46.0 33.2 2.53 2.11 Netherlands. . . . . . . . . . . . 10.3 10.3 8.8 9.6 79.6 80.8 4.7 4.1 1.66 1.67 Niger. . . . . . . . . . . . . . . . . 51.1 46.7 14.5 11.3 53.0 57.0 114.5 92.9 7.68 6.79 Nigeria. . . . . . . . . . . . . . . . 36.1 30.6 16.3 14.1 47.2 50.5 93.0 78.7 4.82 3.92 Pakistan. . . . . . . . . . . . . . . 25.3 20.7 7.1 6.2 65.6 69.0 65.3 47.2 3.28 2.42 Peru. . . . . . . . . . . . . . . . . . 19.0 16.3 6.1 6.3 71.0 73.7 27.7 20.2 2.32 2.00 Philippines. . . . . . . . . . . . . 25.7 22.2 5.1 4.9 71.4 74.0 19.9 14.7 3.23 2.83 Poland. . . . . . . . . . . . . . . . 10.0 8.8 10.1 10.8 75.9 77.8 6.7 5.6 1.29 1.39 Romania . . . . . . . . . . . . . . 9.6 8.5 11.8 12.0 73.7 76.0 11.3 8.7 1.27 1.38 Russia. . . . . . . . . . . . . . . . 11.1 9.3 16.0 15.6 66.2 68.6 10.3 8.6 1.41 1.48 Saudi Arabia. . . . . . . . . . . 19.4 17.8 3.3 3.4 73.9 76.1 16.7 12.0 2.35 2.04 South Africa. . . . . . . . . . . . 19.6 18.1 17.0 17.3 49.2 51.4 43.8 36.8 2.33 2.12 Spain. . . . . . . . . . . . . . . . . 10.9 8.7 8.7 9.3 81.1 82.0 3.4 3.2 1.47 1.51 Sri Lanka. . . . . . . . . . . . . . 15.9 13.3 6.2 6.8 75.3 77.3 18.1 13.2 1.96 1.85 Sudan . . . . . . . . . . . . . . . . 36.6 31.2 11.7 6.9 54.2 64.4 72.4 38.9 4.93 4.04 Syria . . . . . . . . . . . . . . . . . 24.4 19.7 3.7 3.7 74.5 76.6 16.1 11.7 3.02 2.34 Taiwan 5 . . . . . . . . . . . . . . . 9.0 8.2 6.9 8.2 78.2 79.7 5.3 4.6 1.15 1.23 Tanzania . . . . . . . . . . . . . . 33.4 25.6 12.3 11.2 52.5 54.9 68.1 56.4 4.31 3.00 Thailand. . . . . . . . . . . . . . . 13.0 11.7 6.5 7.5 75.0 77.1 16.7 12.3 1.65 1.68 Turkey. . . . . . . . . . . . . . . . 18.3 15.1 6.1 6.3 72.2 74.8 24.8 17.3 2.18 1.96 Uganda. . . . . . . . . . . . . . . 47.6 45.4 11.9 10.3 53.0 55.2 63.7 51.7 6.73 6.31 Ukraine . . . . . . . . . . . . . . . 9.6 8.5 15.7 15.4 68.5 70.7 8.7 7.3 1.27 1.35 United Kingdom. . . . . . . . . 12.3 11.9 9.3 9.5 79.9 81.1 4.7 4.1 1.92 1.86 Uzbekistan. . . . . . . . . . . . . 17.5 16.1 5.3 5.4 72.2 74.8 22.7 16.3 1.92 1.74 Venezuela. . . . . . . . . . . . . 20.3 18.1 5.1 5.6 73.8 75.3 21.1 17.0 2.45 2.22 Vietnam. . . . . . . . . . . . . . . 17.3 14.5 6.0 6.0 71.9 74.4 21.6 15.7 1.93 1.77 Yemen. . . . . . . . . . . . . . . . 34.4 25.6 7.2 5.7 63.4 66.9 56.8 41.9 4.81 3.20 Zambia. . . . . . . . . . . . . . . . 44.6 38.9 12.8 11.0 52.0 54.1 68.4 50.6 6.07 5.26 1 Number of births during 1 year per 1,000 persons (based on midyear population). 2 Number of deaths during 1 year per 1,000 persons (based on midyear population). 3 Number of deaths of children under 1 year of age per 1,000 live births in a calendar year. 4 Average number of children that would be born if all women lived to the end of their childbearing years and, at each year of childbearing age, they experienced the birth rates occurring in the specified year. 5 See footnote 4, Table 1332. 6 See footnote 5, Table 1332. Source: U.S. Census Bureau, International Data Base, <http://www.census.gov/ipc/www/idb/>, accessed June 2010.
- 21. International Statistics 843 U.S. Census Bureau, Statistical Abstract of the United States: 2012 Table 1340. Life Expectancy at Birth and at Age 65 by Sex— Selected Countries: 1990 and 2008 Country Life expectancy at birth (years) Life expectancy at age 65 (years) Females Males Females Males 1990 2008 1990 2008 1990 2008 1990 2008 United States 1 . . . . . 78.8 80.3 71.8 75.3 18.9 19.8 15.1 17.1 Australia. . . . . . . . . . . 80.1 83.7 73.9 79.2 19.0 21.6 15.2 18.6 Austria. . . . . . . . . . . . 79.0 83.3 72.3 77.8 18.1 21.1 14.4 17.7 Belgium. . . . . . . . . . . 79.5 (NA) 72.7 (NA) 18.8 (NA) 14.3 (NA) Canada. . . . . . . . . . . 80.8 (NA) 74.4 (NA) 19.9 (NA) 15.7 (NA) Czech Republic. . . . . 75.5 80.5 67.6 74.1 15.3 18.8 11.7 15.3 Denmark. . . . . . . . . . 77.8 81.0 72.0 76.5 17.9 19.5 14.0 16.6 Finland. . . . . . . . . . . . 79.0 83.3 71.0 76.5 17.8 21.4 13.8 17.5 France. . . . . . . . . . . . 80.9 84.3 72.8 77.6 19.8 (NA) 15.5 (NA) Germany. . . . . . . . . . 78.5 82.7 72.0 77.6 17.7 20.7 14.0 17.6 Greece. . . . . . . . . . . . 79.5 82.5 74.6 77.5 18.0 19.9 15.7 17.7 Hungary. . . . . . . . . . . 73.7 77.8 65.1 69.8 15.3 17.5 12.0 13.6 Iceland. . . . . . . . . . . . 80.5 83.0 75.4 79.6 19.5 20.5 16.2 18.2 Ireland. . . . . . . . . . . . 77.7 82.3 72.1 77.5 17.0 20.4 13.3 17.2 Italy. . . . . . . . . . . . . . 80.3 (NA) 73.8 (NA) 19.0 (NA) 15.2 (NA) Japan. . . . . . . . . . . . . 81.9 86.1 75.9 79.3 20.0 23.6 16.2 18.6 Korea, South. . . . . . . 75.5 83.3 67.3 76.5 16.3 21.0 12.4 16.6 Mexico. . . . . . . . . . . . 73.5 77.5 67.7 72.7 17.8 18.3 16.0 16.8 Netherlands. . . . . . . . 80.1 82.3 73.8 78.0 18.9 20.5 14.4 17.0 New Zealand. . . . . . . 78.4 82.4 72.5 78.4 18.3 20.8 14.6 18.3 Norway. . . . . . . . . . . . 79.8 83.0 73.4 78.3 18.6 20.5 14.6 17.5 Poland. . . . . . . . . . . . 75.2 80.0 66.2 71.3 16.1 19.0 12.4 14.7 Portugal. . . . . . . . . . . 77.5 82.4 70.6 76.2 17.1 20.3 14.0 16.9 Slovakia. . . . . . . . . . . 75.4 78.7 66.6 70.9 15.7 17.5 12.2 13.8 Spain. . . . . . . . . . . . . 80.6 84.3 73.4 78.0 19.3 21.9 15.5 18.0 Sweden. . . . . . . . . . . 80.4 83.2 74.8 79.1 19.0 20.8 15.3 17.9 Switzerland. . . . . . . . 80.9 84.6 74.0 79.8 19.7 22.3 15.3 18.9 Turkey. . . . . . . . . . . . 69.5 75.8 65.4 71.4 14.3 15.8 12.8 14.0 United Kingdom. . . . . 78.5 (NA) 72.9 (NA) 17.9 (NA) 14.0 (NA) NA Not available. 1 Source of 2008 life expectancy data: U.S. National Center for Health Statistics, National Vital Statistics Reports (NVSR), “United States Life Tables,” Vol. 58, No. 21, June 2010, and unpublished data. Source: Except as noted, Organization for Economic Cooperation and Development (OECD), 2011, “OECD Health Data,” OECD Health Statistics database (copyright), <http://www.oecd.org/health/healthdata>, accessed April 2011. Table 1341. People Infected With HIV and AIDS-Related Deaths by Region: 2001 and 2008 [In thousands (29,000 represents 29,000,000), except percent. Estimates are based on ranges, called ‘plausibility bounds,’ which reflect the certainty associated with each estimate and define the boundaries within which the actual numbers lie] Region Adults and children living with HIV Adults and children newly infected with HIV Adult (15–49 yrs.) prevalence (percent) Adult and child deaths due to AIDS 2001 2008 2001 2008 2001 2008 2001 2008 Total. . . . . . . . . . . . . . . . . . . . . . . . . . 29,000 33,400 3,200 2,700 0.8 0.8 1,900 2,000 Sub-Saharan Africa. . . . . . . . . . . . . . . . 19,700 22,400 2,300 1,900 5.8 5.2 1,400 1,400 North Africa and Middle East. . . . . . . . . 200 310 30 35 0.2 0.2 11 20 South and South-East Asia. . . . . . . . . . 4,000 3,800 310 280 0.3 0.3 260 270 East Asia. . . . . . . . . . . . . . . . . . . . . . . . 560 850 99 75 (Z) (Z) 22 59 Oceania. . . . . . . . . . . . . . . . . . . . . . . . . 36 59 6 4 0.2 0.3 (Z) 2 Latin America. . . . . . . . . . . . . . . . . . . . . 1,600 2,000 150 170 0.5 0.6 66 77 Caribbean. . . . . . . . . . . . . . . . . . . . . . . 220 240 21 20 1.1 1.0 20 12 Eastern Europe and Central Asia. . . . . 900 1,500 280 110 0.5 0.7 26 87 Western and Central Europe. . . . . . . . . 660 850 40 30 0.2 0.3 8 13 North America. . . . . . . . . . . . . . . . . . . . 1,200 1,400 52 55 0.6 0.6 19 25 Z Less than 0.1 percent or 1,000 deaths. Source: Joint United Nations Programme on HIV/AIDS (UNAIDS) and World Health Organization (WHO), AIDS Epidemic Update: December 2009 (copyright). See also <http://www.unaids.org/en/KnowledgeCentre/HIVData/EpiUpdate /EpiUpdArchive/2009/default.asp>. Table 1342. Percentage of the Adult Population Considered to Be Obese: 2008 [Obesity rates are defined as the percentage of the population with a Body Mass Index (BMI) over 30 kg/m2 . The BMI is a single number that evaluates an individual’s weight status in relation to height (weight/height 2 , with weight in kilograms and height in meters). For the United States, Australia, Canada, Ireland, Japan, South Korea, Luxembourg, Mexico, New Zealand, and the United Kingdom, figures are based on health examinations, rather than self-reported information. Obesity estimates derived from health examinations are generally higher and more reliable than those coming from self-reports because they preclude any misreporting of people’s height and weight. However, health examinations are only conducted regularly in a few countries. For more information on methods by country, see <http://www.irdes.fr/EspaceAnglais/home.html>] Country 2008 Country 2008 Country 2008 United States. . . . . 33.8 France. . . . . . . . . . . 11.2 Luxembourg. . . . . . . 1 20.0 Australia. . . . . . . . . . 1 24.8 Germany. . . . . . . . . 3 13.6 Mexico. . . . . . . . . . . 2 30.0 Austria. . . . . . . . . . . 2 12.4 Greece. . . . . . . . . . . 18.1 New Zealand. . . . . . 1 26.5 Belgium. . . . . . . . . . 13.8 Hungary. . . . . . . . . . 4 18.8 Norway. . . . . . . . . . . 10.0 Canada. . . . . . . . . . 24.2 Ireland. . . . . . . . . . . 1 23.0 Spain. . . . . . . . . . . . 2 14.9 Czech Republic. . . . 17.1 Italy. . . . . . . . . . . . . 9.9 Sweden. . . . . . . . . . 10.0 Denmark. . . . . . . . . 3 11.4 Japan. . . . . . . . . . . . 3.4 Switzerland. . . . . . . 1 8.1 Finland. . . . . . . . . . . 15.7 Korea, South. . . . . . 3.8 United Kingdom. . . . 24.5 1 2007 data. 2 2006 data. 3 2005 data. 4 2003 data. Source: Except as noted, Organization for Economic Cooperation and Development (OECD), 2011, “OECD Health Data,” OECD Health Statistics database (copyright), accessed April 2011. See also <http://www.oecd.org>.
- 22. 844 International Statistics U.S. Census Bureau, Statistical Abstract of the United States: 2012 Table 1343. Daily Tobacco Consumption by Country and Sex: 1990 and 2009 [Daily smokers as percent of population. Includes tobacco forms consumed by smoking only] Country Total Females Males 1990 2009 1990 2009 1990 2009 United States. . . . . . 25.5 1 16.5 22.8 1 15.1 28.4 1 17.9 Australia. . . . . . . . . . . 2 28.6 3 16.6 2 27.0 3 15.2 2 30.2 3 18.0 Canada. . . . . . . . . . . 28.2 1 17.5 26.7 1 15.1 29.8 1 19.9 Denmark. . . . . . . . . . 44.5 16.0 42.0 14.0 47.0 18.0 Finland. . . . . . . . . . . . 25.9 1 20.4 20.0 1 17.6 32.4 1 24.0 France. . . . . . . . . . . . 30.0 1 26.2 20.0 1 22.3 38.0 1 30.6 Greece. . . . . . . . . . . . 38.5 1 39.7 26.0 1 33.5 51.0 1 46.3 Iceland. . . . . . . . . . . . 30.3 15.8 29.9 15.7 30.8 15.9 Ireland. . . . . . . . . . . . 30.0 3 29.0 29.0 3 27.0 31.0 3 31.0 Italy. . . . . . . . . . . . . . 27.8 23.3 17.8 17.1 37.8 29.9 Japan. . . . . . . . . . . . . 37.4 24.9 14.3 11.9 60.5 38.9 Luxembourg. . . . . . . . 4 33.0 1 20.0 4 25.0 1 18.0 4 41.0 1 23.0 Netherlands. . . . . . . . 37.0 28.0 32.0 24.0 43.0 32.0 New Zealand. . . . . . . 28.0 3 18.1 27.0 3 17.0 28.0 3 19.3 Norway. . . . . . . . . . . . 35.0 21.0 33.0 20.0 36.0 21.0 Poland. . . . . . . . . . . . (NA) 5 26.3 (NA) 5 19.3 (NA) 5 33.9 Sweden. . . . . . . . . . . 25.8 1 14.0 25.9 1 15.7 25.8 1 12.2 United Kingdom. . . . . 30.0 1 22.0 30.0 1 21.0 31.0 1 22.0 NA Not available. 1 2008 data. 2 1989 data. 3 2007 data. 4 1987 data. 5 2004 data. Source: Organization for Economic Cooperation and Development (OECD), 2011, “OECD Health Data,” OECD Health Statistics database (copyright), <http://www.oecd.org/health/healthdata>, accessed April 2011. Table 1345. Suicide Rates by Sex and Country: 2008 [Per 100,000 persons. Data are for 2008, except as indicated] Country Total Men Women Country Total Men Women OECD average 1 . . 11.1 17.6 5.2 Italy 4 . . . . . . . . . . . 4.9 8.0 2.1 United States 2 . . . . . 10.1 16.6 4.0 Japan. . . . . . . . . . . 19.4 28.3 10.7 Australia 1 . . . . . . . . . . 7.5 11.9 3.3 Korea 1 . . . . . . . . . . 21.5 32.0 13.2 Austria. . . . . . . . . . . . 11.9 19.6 5.3 Luxembourg 1 . . . . . 12.0 18.6 6.2 Belgium 3 . . . . . . . . . . 16.3 24.8 8.4 Mexico 4 . . . . . . . . . 4.3 7.5 1.4 Canada 3 . . . . . . . . . . 10.2 15.7 4.9 Netherlands 4 . . . . . 7.1 10.1 4.2 Czech Republic. . . . . 11.0 18.9 3.8 New Zealand 1 . . . . 12.3 18.6 6.3 Denmark 1 . . . . . . . . . 9.9 15.0 5.3 Norway 4 . . . . . . . . 9.6 13.5 5.7 Finland. . . . . . . . . . . . 17.3 27.1 7.8 Poland. . . . . . . . . . 12.9 23.2 3.5 France. . . . . . . . . . . . 13.5 21.1 6.8 Portugal 5 . . . . . . . . 8.7 14.6 3.8 Germany 1 . . . . . . . . . 9.1 14.5 4.3 Slovakia 2 . . . . . . . . 10.9 20.0 2.9 Greece. . . . . . . . . . . . 2.6 4.5 0.9 Spain 2 . . . . . . . . . . 6.3 10.0 2.9 Hungary. . . . . . . . . . . 19.6 33.8 7.8 Sweden 4 . . . . . . . . 10.6 15.2 6.1 Iceland. . . . . . . . . . . . 11.2 15.3 6.7 Switzerland 4 . . . . . 14.3 20.6 8.7 Ireland. . . . . . . . . . . . 9.1 14.3 4.0 United Kingdom 4 . . 5.8 9.2 2.5 1 2006 data. 2 2005 data. 3 2004 data. 4 2007 data. 5 2003 data. Source: Organization for Economic Cooperation and Development (OECD), 2011, “OECD Health Data,” OECD Health Statistics database (copyright), <http://www.oecd.org/health/healthdata>. Country 1990 2000 2005 2008 2009 United States 1 . . . . 44,599 41,945 43,443 37,261 33,808 Australia. . . . . . . . . . 2,331 1,817 1,627 1,441 1,502 Austria. . . . . . . . . . . 1,391 976 768 679 633 Belgium. . . . . . . . . . 1,976 1,470 1,089 944 (NA) Canada. . . . . . . . . . 3,963 2,927 2,905 2,729 (NA) Czech Republic. . . . (NA) 1,486 1,286 1,076 901 Denmark 2 . . . . . . . . 634 498 331 406 303 Estonia. . . . . . . . . . . 436 204 170 132 100 Finland. . . . . . . . . . . 649 396 379 344 279 France 3 . . . . . . . . . . 11,215 8,079 5,318 4,275 4,273 Germany. . . . . . . . . 7,906 7,503 5,361 4,477 4,152 Greece. . . . . . . . . . . 1,737 2,037 1,658 1,553 (NA) Hungary. . . . . . . . . . 2,432 1,200 1,278 996 (NA) Iceland. . . . . . . . . . . 24 32 19 12 17 India. . . . . . . . . . . . . (NA) 78,911 94,968 (NA) (NA) Ireland. . . . . . . . . . . 478 415 396 279 (NA) Italy. . . . . . . . . . . . . 7,151 7,061 5,818 4,731 (NA) Country 1990 2000 2005 2008 2009 Japan. . . . . . . . . . . 14,595 10,403 7,931 6,023 5,772 Korea, South. . . . . 14,174 10,236 6,376 5,870 (NA) Luxembourg. . . . . . 71 76 47 35 48 Mexico. . . . . . . . . . 5,469 5,224 4,710 5,379 4,870 Netherlands. . . . . . 1,376 1,166 817 750 720 New Zealand. . . . . 729 462 405 366 384 Norway. . . . . . . . . . 332 341 224 255 212 Poland. . . . . . . . . . 7,333 6,294 5,444 5,437 4,572 Portugal. . . . . . . . . 2,646 1,857 1,247 885 737 Russia. . . . . . . . . . 35,366 29,594 33,957 29,936 26,084 Slovakia. . . . . . . . . (NA) 648 600 606 384 Slovenia. . . . . . . . . 517 313 258 214 171 Spain. . . . . . . . . . . 6,948 5,776 3,857 3,100 2,714 Sweden. . . . . . . . . 772 591 440 397 358 Switzerland. . . . . . 954 592 409 357 349 Turkey. . . . . . . . . . 6,317 5,510 4,505 4,236 4,300 United Kingdom. . . 5,402 3,580 3,336 2,645 2,337 Table 1344. Road Fatalities by Country: 1990 to 2009 [Fatalities include any person killed immediately or dying within 30 days as a result of an injury accident. For countries that do not apply the threshold of 30 days, conversion coefficients are estimated so that comparisons on the basis of the 30 day-definition can be made] NA Not available. 1 As of July 1. 2 As of January 1. 3 Data on January 1 of the following year. Source: Organization for Economic Cooperation and Development (OECD), 2011, “Road Injury Accidents,” Transport Statistics, OECD Publishing (copyright). See also <http://stats.oecd.org//Index.aspx?QueryId=28912>.
- 23. International Statistics 845 U.S. Census Bureau, Statistical Abstract of the United States: 2012 Table 1346. Health Expenditures by Country: 1980 to 2008 [In percent. GDP = gross domestic product; for explanation, see text, Section 13] Country Total expenditures on health (percent of GDP) Public expenditures on health (percent of total) 1980 1990 2000 2005 2008 1980 1990 2000 2005 2008 United States. . . . . . . 9.0 12.2 13.4 15.4 16.0 40.8 39.2 43.2 44.4 46.5 Australia. . . . . . . . . . . . 6.1 6.7 8.0 8.4 (NA) 62.6 66.2 66.8 66.9 (NA) Austria. . . . . . . . . . . . . 7.4 8.3 9.9 10.4 10.5 68.8 73.4 76.8 76.1 76.9 Belgium. . . . . . . . . . . . 6.3 7.2 9.0 10.6 11.1 (NA) (NA) (NA) (NA) (NA) Canada. . . . . . . . . . . . 7.0 8.9 8.8 9.9 10.4 75.6 74.5 70.4 70.3 70.2 Czech Republic. . . . . . (NA) 4.7 6.5 7.2 7.1 96.8 97.4 90.3 87.3 82.5 Denmark. . . . . . . . . . . 8.9 8.3 8.3 9.5 (NA) 87.8 82.7 82.4 83.7 (NA) Finland. . . . . . . . . . . . . 6.3 7.7 7.2 8.4 8.4 79.0 80.9 71.1 73.5 74.2 France. . . . . . . . . . . . . 7.0 8.4 10.1 11.1 11.2 80.1 76.6 79.4 79.3 77.8 Germany 1 . . . . . . . . . . 8.4 8.3 10.3 10.7 10.5 78.7 76.2 79.8 76.8 76.8 Greece. . . . . . . . . . . . . 5.9 6.6 7.9 9.5 (NA) 55.6 53.7 60.0 60.1 (NA) Hungary. . . . . . . . . . . . (NA) (NA) 7.0 8.3 7.3 (NA) (NA) 70.7 72.3 71.0 Iceland. . . . . . . . . . . . . 6.3 7.8 9.5 9.4 9.1 88.2 86.6 81.1 81.4 83.2 Ireland. . . . . . . . . . . . . 8.2 6.1 6.1 7.5 8.7 82.0 71.7 75.3 76.6 76.9 Italy. . . . . . . . . . . . . . . (NA) 7.7 8.1 8.9 9.1 (NA) 79.5 72.5 76.2 77.2 Japan. . . . . . . . . . . . . . 6.5 6.0 7.7 8.2 (NA) 71.3 77.6 81.3 82.7 (NA) Korea, South. . . . . . . . 3.9 4.2 4.8 5.7 6.5 20.0 36.3 45.5 52.1 55.3 Luxembourg. . . . . . . . . 5.2 5.4 7.5 7.9 6.8 92.8 93.1 85.1 84.9 84.1 Mexico. . . . . . . . . . . . . (NA) 4.4 5.1 5.9 5.9 (NA) 40.4 46.6 45.0 46.9 Netherlands. . . . . . . . . 7.4 8.0 8.0 9.8 9.9 69.4 67.1 63.1 (NA) (NA) New Zealand. . . . . . . . 5.9 6.9 7.7 8.9 9.9 88.0 82.4 78.0 77.1 80.4 Norway. . . . . . . . . . . . . 7.0 7.6 8.4 9.1 8.5 85.1 82.8 82.5 83.5 84.2 Poland. . . . . . . . . . . . . (NA) 4.8 5.5 6.2 7.0 (NA) 91.7 70.0 69.3 72.2 Portugal. . . . . . . . . . . . 5.3 5.9 8.8 10.2 (NA) 64.3 65.5 72.5 71.8 (NA) Slovakia. . . . . . . . . . . . (NA) (NA) 5.5 7.0 8.0 (NA) (NA) 89.4 74.4 67.8 Spain. . . . . . . . . . . . . . 5.3 6.5 7.2 8.3 9.0 79.9 78.7 71.6 70.6 72.5 Sweden. . . . . . . . . . . . 8.9 8.2 8.2 9.2 9.4 92.5 89.9 84.9 81.6 81.9 Switzerland. . . . . . . . . 7.3 8.2 10.2 11.2 10.7 (NA) 52.4 55.4 59.5 59.1 Turkey. . . . . . . . . . . . . 2.4 2.7 4.9 5.4 6.2 29.4 61.0 62.9 67.8 71.2 United Kingdom. . . . . . 5.6 5.9 7.0 8.3 8.7 89.4 83.6 79.3 81.9 82.6 NA Not available. 1 Data prior to 1991 are for former West Germany. Source: Organization for Economic Cooperation and Development (OECD), 2011, “OECD Health Data,” OECD Health Statistics database (copyright), <http://www.oecd.org/health/healthdata>, accessed April 2011. Table 1347. Physicians and Inpatient Care—Selected Countries: 2000 to 2008 Country Practicing physicians per 1,000 population Acute inpatient care Beds per 1,000 population Average length of stay (days) 2000 2005 2008 2000 2005 2008 2000 2005 2008 United States. . . . . . . . 2.3 2.4 2.4 2.9 2.7 1 2.7 5.8 5.6 5.5 Australia. . . . . . . . . . . . . 2.5 2.8 1 3.0 3.6 3.5 (NA) 6.1 6.0 (NA) Austria. . . . . . . . . . . . . . 3.9 4.3 4.6 6.2 5.8 5.6 7.6 6.9 6.8 Belgium. . . . . . . . . . . . . 3.9 4.0 3.0 4.7 4.4 4.3 7.7 7.7 1 7.0 Canada. . . . . . . . . . . . . (NA) (NA) (NA) 3.2 2.9 1 2.7 7.2 7.2 1 7.5 Czech Republic. . . . . . . 3.4 3.6 3.6 5.7 5.3 5.2 8.7 8.0 7.4 Denmark. . . . . . . . . . . . 2.9 3.3 1 3.4 3.5 3.2 3.0 3.8 3.5 (NA) Finland. . . . . . . . . . . . . . 2.5 2.6 2.7 2.4 2.2 1.9 5.7 5.5 5.5 France. . . . . . . . . . . . . . (NA) (NA) (NA) 4.1 3.7 3.5 5.6 5.4 5.2 Germany. . . . . . . . . . . . 3.3 3.4 3.6 6.4 5.9 5.7 9.2 8.1 7.6 Greece. . . . . . . . . . . . . . (NA) (NA) (NA) 3.7 3.9 4.0 6.2 5.6 (NA) Hungary. . . . . . . . . . . . . 2.7 2.8 3.1 5.8 5.5 4.1 7.1 6.5 6.0 Iceland. . . . . . . . . . . . . . 3.4 3.7 3.7 (NA) (NA) (NA) 6.1 5.4 5.6 Ireland. . . . . . . . . . . . . . (NA) (NA) (NA) 2.8 2.8 1 2.7 6.4 6.5 6.2 Italy. . . . . . . . . . . . . . . . (NA) (NA) (NA) 4.1 3.3 3.0 7.0 6.7 1 6.7 Japan. . . . . . . . . . . . . . . 1.9 (NA) 2.2 9.6 8.2 8.1 24.8 19.8 18.8 Korea, South. . . . . . . . . 1.3 1.6 1.9 3.9 4.6 5.4 11.0 (NA) (NA) Luxembourg. . . . . . . . . . 2.2 2.4 1 2.8 (NA) 4.5 4.5 7.5 7.6 1 7.3 Mexico. . . . . . . . . . . . . . 1.6 1.8 2.0 1.8 1.7 1.6 4.0 4.0 3.9 Netherlands. . . . . . . . . . (NA) (NA) (NA) 3.2 3.1 2.9 9.0 7.2 5.9 New Zealand. . . . . . . . . 2.2 2.1 2.5 (NA) (NA) 2.2 4.3 5.4 (NA) Norway. . . . . . . . . . . . . . (NA) 3.6 4.0 3.1 2.9 2.5 6.0 5.2 4.8 Poland. . . . . . . . . . . . . . 2.2 2.1 2.2 5.2 4.7 4.4 8.9 6.5 5.7 Portugal. . . . . . . . . . . . . (NA) (NA) (NA) 3.1 2.9 2.8 7.7 7.1 1 6.8 Slovakia. . . . . . . . . . . . . 3.2 (NA) 1 3.0 5.7 5.0 4.9 8.5 7.3 6.9 Spain. . . . . . . . . . . . . . . 3.3 3.8 3.6 2.8 2.6 2.6 7.1 6.7 6.5 Sweden. . . . . . . . . . . . . 3.1 3.5 (NA) 2.4 2.2 (NA) 5.0 4.6 1 4.5 Switzerland. . . . . . . . . . (NA) (NA) 3.8 4.1 3.6 3.3 9.3 8.5 7.7 Turkey. . . . . . . . . . . . . . (NA) (NA) (NA) 1.9 2.1 2.2 5.4 5.1 4.3 United Kingdom. . . . . . . 2.0 2.4 2.6 3.1 3.0 2.7 8.2 7.9 7.1 NA Not available. 1 2007 data. Source: Organization for Economic Cooperation and Development (OECD), 2011, “OECD Health Data,” OECD Health Statistics database (copyright); <http://www.oecd.org/health/healthdata>, accessed April 2011.
- 24. 846 International Statistics U.S. Census Bureau, Statistical Abstract of the United States: 2012 Table 1348. Gross National Income (GNI) by Country: 2000 and 2009 [49 represents $49,000,000,000. GNI measures the total domestic and foreign value added claimed by residents. GNI comprises GDP plus net receipts of primary income (compensation of employees and property income) from nonresident sources] Country Gross national income 1 GNI on purchasing power parity basis 2 Total (bil. dol.) Per capita (dol.) Total (bil. dol.) Per capita (dol.) 2000 2009 2000 2009 2000 2009 2000 2009 Algeria. . . . . . . . . . . . . 49 154 1,610 4,420 156 283 5,410 8,110 Argentina. . . . . . . . . . . 276 304 7,460 7,550 328 568 8,560 14,090 Australia. . . . . . . . . . . . 407 958 21,260 43,770 492 842 26,740 38,510 Bangladesh. . . . . . . . . 50 93 350 580 115 251 870 1,550 Belarus . . . . . . . . . . . . 14 54 1,380 5,560 52 123 5,600 12,740 Belgium. . . . . . . . . . . . 260 488 25,400 45,270 290 395 28,930 36,610 Brazil. . . . . . . . . . . . . . 674 1,564 3,870 8,070 1,189 1,968 6,920 10,160 Bulgaria. . . . . . . . . . . . 13 46 1,640 6,060 50 101 6,870 13,260 Burkina Faso. . . . . . . . 3 8 250 510 9 18 850 1,170 Cambodia . . . . . . . . . . 4 10 280 650 11 27 940 1,820 Cameroon. . . . . . . . . . 10 23 620 1,190 24 43 1,620 2,190 Canada. . . . . . . . . . . . 681 1,416 22,130 41,980 851 1,258 28,440 37,280 Chile . . . . . . . . . . . . . . 75 161 4,840 9,470 137 228 9,310 13,420 China 3 . . . . . . . . . . . . . 1,169 4,856 930 3,650 2,949 9,170 2,560 6,890 Colombia. . . . . . . . . . . 94 228 2,350 4,990 228 392 5,840 8,600 Congo (Kinshasa) 4 . . . 4 11 80 160 10 20 200 300 Cote d’Ivoire . . . . . . . . 11 23 620 1,070 25 34 1,450 1,640 Czech Republic. . . . . . 60 182 5,800 17,310 151 251 15,630 23,940 Ecuador. . . . . . . . . . . . 16 54 1,340 3,970 55 110 4,850 8,100 Egypt. . . . . . . . . . . . . . 97 172 1,390 2,070 251 471 3,720 5,680 Ethiopia. . . . . . . . . . . . 8 27 130 330 30 77 500 930 France. . . . . . . . . . . . . 1,482 5 2,751 24,450 5 42,620 1,556 2,191 27,070 33,950 Germany. . . . . . . . . . . 2,097 3,476 25,510 42,450 2,113 3,017 26,590 36,850 Ghana. . . . . . . . . . . . . 6 28 330 1,190 18 37 940 1,530 Greece. . . . . . . . . . . . . 137 328 12,560 29,040 202 325 20,050 28,800 Guatemala. . . . . . . . . . 19 37 1,730 2,650 39 64 3,560 4,570 Hong Kong. . . . . . . . . . 177 221 26,570 31,570 177 312 27,530 44,540 Hungary. . . . . . . . . . . . 48 130 4,700 12,980 120 191 12,910 19,090 India. . . . . . . . . . . . . . . 458 1,406 450 1,220 1,576 3,786 1,650 3,280 Indonesia. . . . . . . . . . . 119 471 580 2,050 452 855 2,260 3,720 Iran . . . . . . . . . . . . . . . 107 331 1,670 4,530 435 836 7,110 11,470 Italy. . . . . . . . . . . . . . . 1,190 2,114 20,890 35,110 1,446 1,919 26,950 31,870 Japan. . . . . . . . . . . . . . 4,393 4,857 34,620 38,080 3,292 4,265 26,630 33,440 Kazakhstan. . . . . . . . . 19 110 1,260 6,920 66 164 5,260 10,320 Kenya. . . . . . . . . . . . . . 13 30 420 760 35 62 1,160 1,570 Korea, South. . . . . . . . 466 967 9,910 19,830 804 1,328 18,110 27,240 Madagascar. . . . . . . . . 4 9 250 430 12 19 840 990 Malawi. . . . . . . . . . . . . 2 4 150 290 7 12 520 780 Malaysia . . . . . . . . . . . 80 202 3,450 7,350 195 377 8,500 13,710 Mexico. . . . . . . . . . . . . 501 962 5,110 8,960 878 1,506 9,090 14,020 Montenegro. . . . . . . . . (NA) 4 (NA) 6,650 4 8 6,580 13,110 Morocco. . . . . . . . . . . . 38 90 1,310 2,770 73 143 2,730 4,400 Mozambique. . . . . . . . 4 10 230 440 8 20 460 880 Nepal. . . . . . . . . . . . . . 5 13 220 440 20 35 840 1,180 Niger. . . . . . . . . . . . . . 2 5 170 340 6 10 550 680 Nigeria. . . . . . . . . . . . . 33 185 270 1,190 141 321 1,220 2,070 Pakistan. . . . . . . . . . . . 68 170 490 1,000 233 455 1,720 2,680 Peru. . . . . . . . . . . . . . . 53 122 2,050 4,200 124 237 4,820 8,120 Philippines. . . . . . . . . . 76 165 970 1,790 178 326 2,340 3,540 Poland. . . . . . . . . . . . . 177 468 4,590 12,260 403 698 10,920 18,290 Portugal. . . . . . . . . . . . 123 233 12,070 21,910 178 256 17,990 24,080 Romania . . . . . . . . . . . 38 179 1,690 8,330 126 312 6,370 14,540 Russia. . . . . . . . . . . . . 250 1,324 1,710 9,340 974 2,599 7,260 18,330 Saudi Arabia. . . . . . . . 168 437 8,150 17,210 362 610 17,550 24,020 Senegal. . . . . . . . . . . . 5 13 510 1,040 13 23 1,330 1,810 Serbia 6 . . . . . . . . . . . . 11 44 1,400 6,000 44 86 6,230 11,700 Singapore . . . . . . . . . . 94 186 23,350 37,220 133 248 32,080 49,780 South Africa. . . . . . . . . 134 284 3,050 5,760 291 496 6,750 10,050 Spain. . . . . . . . . . . . . . 621 1,476 15,420 32,120 851 1,447 22,230 31,490 Sri Lanka. . . . . . . . . . . 16 40 880 1,990 50 96 2,680 4,720 Sudan . . . . . . . . . . . . . 11 52 320 1,220 37 84 1,150 1,990 Sweden. . . . . . . . . . . . 262 454 29,500 48,840 246 354 28,030 38,050 Switzerland. . . . . . . . . 289 506 40,280 65,430 245 364 33,840 47,100 Syria . . . . . . . . . . . . . . 16 51 960 2,410 52 97 3,330 4,620 Tanzania . . . . . . . . . . . 10 21 300 500 25 58 800 1,360 Thailand. . . . . . . . . . . . 122 255 1,960 3,760 303 518 4,970 7,640 Turkey. . . . . . . . . . . . . 265 652 3,990 8,720 580 1,010 8,110 13,500 Uganda. . . . . . . . . . . . 7 15 270 460 16 39 700 1,190 Ukraine . . . . . . . . . . . . 34 129 700 2,800 156 284 3,630 6,180 United Kingdom. . . . . . 1,526 2,558 25,910 41,370 1,532 2,217 27,740 35,860 United States. . . . . . . 9,846 14,234 34,890 46,360 10,071 14,011 36,440 45,640 Uzbekistan. . . . . . . . . . 15 31 630 1,100 35 81 1,490 2,910 Venezuela. . . . . . . . . . 100 286 4,100 10,090 204 347 8,660 12,220 Vietnam. . . . . . . . . . . . 30 88 390 1,000 108 244 1,510 2,790 Yemen. . . . . . . . . . . . . 7 25 400 1,060 31 55 1,750 2,330 Zimbabwe. . . . . . . . . . 6 5 480 360 (NA) (NA) (NA) (NA) NA Not available. 1 Gross national income calculated using the World Bank Atlas method; for details, see source. 2 For explanation of Purchasing Power Parity, see headnote, Table 1349. 3 See footnote 4, Table 1332. 4 See footnote 5, Table 1332. 5 Includes the French overseas departments of French Guiana, Guadeloupe, Martinique, and Reunion. 6 See footnote 4, Table 1404. Source: The World Bank, Washington, DC, World Development Indicators, annual (copyright). See also <http://data.worldbank.org>, accessed May 2011