Download as PDF, PPTX


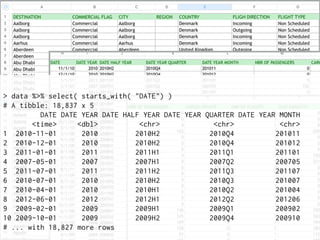
![All caps column names with spaces
> names(data)
[1] "DESTINATION" "COMMERCIAL FLAG" "CITY" "REGION"
[5] "COUNTRY" "FLIGH DIRECTION" "FLIGHT TYPE" "DATE"
[9] "DATE YEAR" "DATE HALF YEAR" "DATE YEAR QUARTER" "DATE YEAR MONTH"
[13] "NBR OF PASSENGERS" "CARGO WEIGHT" "NBR OF FLIGHTS" "SEAT CAPACITY"](https://image.slidesharecdn.com/romainfrancoissatrday-160904105421/85/dplyr-use-case-7-320.jpg)
![> unique( data[["COMMERCIAL FLAG"]] )
[1] "Commercial"
> summary( as.factor( data[["REGION"]] ) )
China VH China ZB China ZS Germany ED Germany ET India VA India VI
68 127 3 2160 9 3 1
Japan RJ Russia UI Russia UL Russia UN Russia UR Russia US Russia UU
63 1 167 7 62 59 340
Russia UW Spain GC Spain LE USA KA USA KB USA KC USA KD
6 205 870 4 7 5 19
USA KE USA KI USA KJ USA KM USA KP USA KT USA KW
3 1 114 2 4 2 5
NA's
14520](https://image.slidesharecdn.com/romainfrancoissatrday-160904105421/85/dplyr-use-case-8-320.jpg)
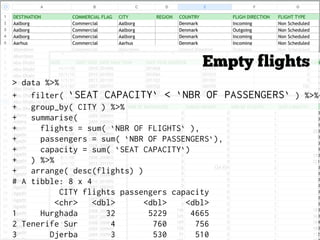
![> data %>%
+ filter( `NBR OF PASSENGERS` == 0 & `CARGO WEIGHT` == 0 ) %>%
+ group_by( CITY, `DATE YEAR MONTH`, `FLIGH DIRECTION` ) %>%
+ summarise( flights = sum( `NBR OF FLIGHTS` ) ) %>%
+ arrange( desc(flights) )
Source: local data frame [2,417 x 4]
Groups: CITY, DATE YEAR MONTH [2,023]
CITY DATE YEAR MONTH FLIGH DIRECTION flights
<chr> <chr> <chr> <dbl>
1 Timisoara 200911 Incoming 26
2 Arad 200701 Incoming 23
3 Arad 200801 Outgoing 22
4 Cluj Napoca 201110 Incoming 22
5 Arad 200801 Incoming 21
# ...
Empty flights](https://image.slidesharecdn.com/romainfrancoissatrday-160904105421/85/dplyr-use-case-10-320.jpg)

![flights <- data %>%
`names<-`( casefold(gsub( " ", "_", names(data))) ) %>%
rename( direction = fligh_direction, type = flight_type ) %>%
mutate(
year = date_year,
month = as.numeric(substr(date_year_month, 5, 6)),
no_passengers = nbr_of_passengers==0,
no_weight = cargo_weight==0
) %>%
group_by( year, month, country, city, direction ) %>%
summarise(
passengers = sum(nbr_of_passengers),
weight = sum(cargo_weight),
capacity = sum(seat_capacity),
flights = sum(nbr_of_flights),
scheduled = sum(nbr_of_flights[type == "Scheduled"] ),
non_scheduled = flights - scheduled,
flights_no_passengers = sum( nbr_of_flights[no_passengers] ),
flights_no_weight = sum( nbr_of_flights[no_weight] ),
flights_empty = sum( nbr_of_flights[no_passengers & no_weight]),
filling = passengers / capacity
) %>%
arrange( year, month, country, city, direction ) %>%
ungroup](https://image.slidesharecdn.com/romainfrancoissatrday-160904105421/85/dplyr-use-case-13-320.jpg)

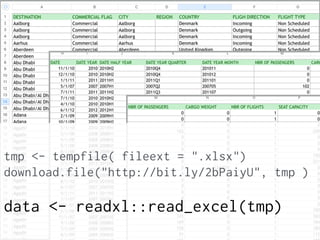
![> places <- with( distinct( flights, city, country ), paste(city, country, sep = ", ") )
>
> p <- progress_estimated(length(places))
> coords <- tbl_df( bind_rows( lapply(places, function(place){
+ res <- geocode( place )[1, ]
+ Sys.sleep( .2 ) # otherwise geocode wont let us get all the data
+ p$tick()$print()
+ res
+ }) ) )
|==== | 8% ~2 m remaining
> glimpse(cities)
Observations: 484
Variables: 10
$ city <chr> "Mazari Sharif", "Bagram Air Base", "Kabul", "Kandahar", "Tirana...
$ country <chr> "Afghanistan", "Afghanistan", "Afghanistan", "Afghanistan", "Alb...
$ interpretedPlace <chr> "Mazari Sharif, Afghanistan", "Bagram Airfield, Bagram, Afghanis...
$ longitude <dbl> 67.117951, 69.273567, 69.207486, 65.737175, 19.818698, -2.214323...
$ latitude <dbl> 36.69262, 34.94448, 34.55535, 31.62887, 41.32755, 31.61825, 22.7...
$ xmin <dbl> 67.060633, 69.272218, 68.949509, 65.669574, 19.753568, -2.404461...
$ xmax <dbl> 67.235212, 69.274916, 69.445953, 65.830765, 19.882078, -1.352005...
$ ymin <dbl> 36.65382, 34.94313, 34.34549, 31.59740, 41.29512, 31.18248, 20.8...
$ ymax <dbl> 36.75264, 34.94582, 34.76192, 31.67252, 41.36684, 32.04475, 23.6...
$ uncertainty <dbl> 6692, 194, 31670, 7302, 6535, 51589, 150488, 239610, 12129, 1738...](https://image.slidesharecdn.com/romainfrancoissatrday-160904105421/85/dplyr-use-case-16-320.jpg)


![data <- flights %>%
filter( direction == "Outgoing" ) %>%
mutate(
year = as.factor(year),
month = factor( month.abb[month], levels = month.abb )
) %>%
group_by( year, month ) %>%
summarise( passengers = sum( passengers ))
ggplot( data ) +
aes( x = month, y = passengers,
group = year, color = year
) +
geom_line() +
geom_point()
Leaving Budapest](https://image.slidesharecdn.com/romainfrancoissatrday-160904105421/85/dplyr-use-case-25-320.jpg)
![data <- flights %>%
filter( direction == "Outgoing" ) %>%
mutate(
year = as.factor(year),
month = factor( month.abb[month], levels = month.abb )
) %>%
group_by( year, month ) %>%
summarise( passengers = sum( passengers ))
ggplot( data ) +
aes( x = month, y = passengers,
group = year, color = year
) +
geom_line() +
geom_point()
Collapse #passengers
by year/month](https://image.slidesharecdn.com/romainfrancoissatrday-160904105421/85/dplyr-use-case-26-320.jpg)
![data <- flights %>%
filter( direction == "Outgoing" ) %>%
mutate(
year = as.factor(year),
month = factor( month.abb[month], levels = month.abb )
) %>%
group_by( year, month ) %>%
summarise( passengers = sum( passengers ))
ggplot( data ) +
aes( x = month, y = passengers,
group = year, color = year
) +
geom_line() +
geom_point()
Make year and month factors](https://image.slidesharecdn.com/romainfrancoissatrday-160904105421/85/dplyr-use-case-27-320.jpg)
![data <- flights %>%
filter( direction == "Outgoing" ) %>%
mutate(
year = as.factor(year),
month = factor( month.abb[month], levels = month.abb )
) %>%
group_by( year, month ) %>%
summarise( passengers = sum( passengers ))
ggplot( data ) +
aes( x = month, y = passengers,
group = year, color = year
) +
geom_line() +
geom_point()
viz with ggplot2](https://image.slidesharecdn.com/romainfrancoissatrday-160904105421/85/dplyr-use-case-28-320.jpg)
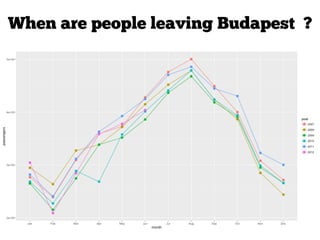


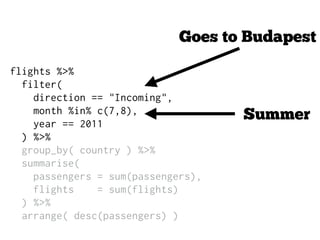
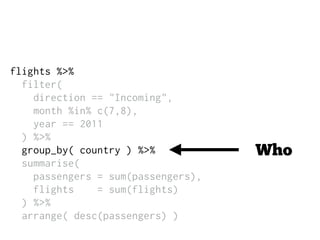
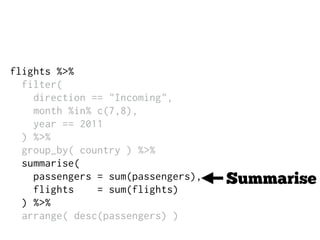
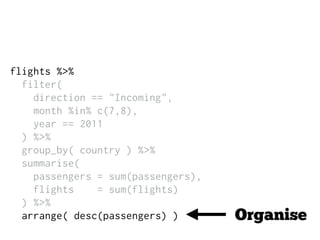
The document outlines a use case for the R package 'dplyr', detailing various operations on flight data, including filtering, summarizing, and visualizing passenger and flight statistics for Budapest. It involves data cleaning and manipulation tasks, such as renaming columns and aggregating flight metrics by year and month. The document also includes code snippets for generating insights on incoming and outgoing flights, as well as visualizations using ggplot2.