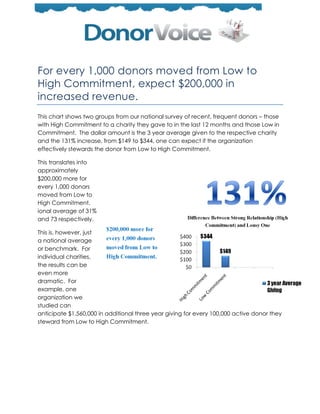
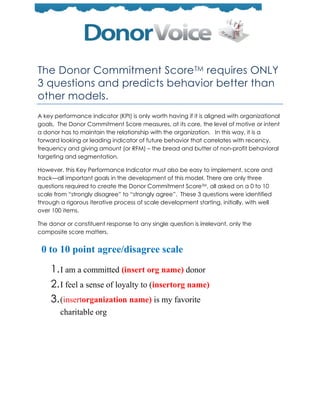
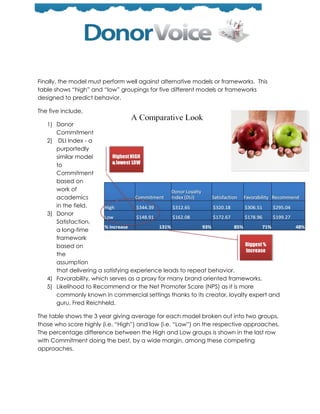
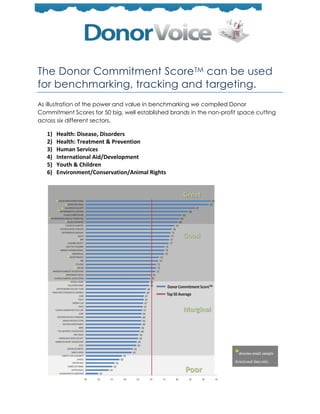
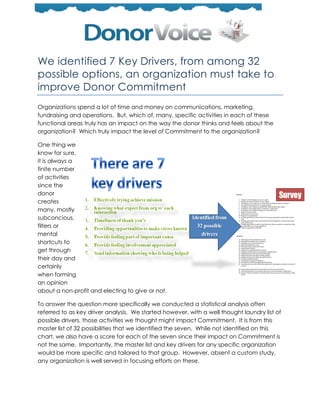
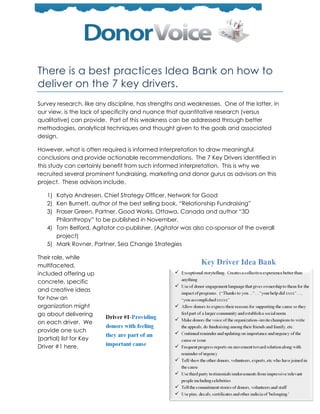
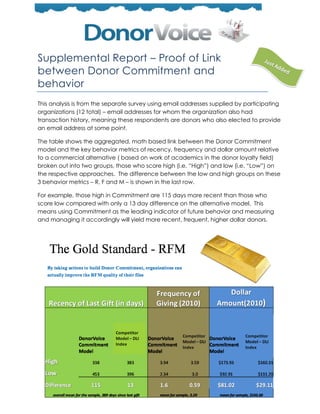
This document provides a summary of a report on measuring donor commitment levels. Some key findings:
- Donor commitment is a quantifiable measure of donor attitudes that can predict future donation behavior.
- Moving donors from low to high commitment levels can result in $200,000 more in donations per 1,000 donors on average.
- Donor commitment can be accurately measured with just 3 survey questions on a scale.
- Higher commitment scores correlate with more recent, frequent, and larger donations compared to other models.
- The report identifies 7 key drivers non-profits can focus on to improve donor commitment levels.
By David F. Larcker, Brendan Sheehan, and Brian Tayan
September 1, 2016, Stanford Corporate Governance Initiative, and Stanford Rock Center for Corporate Governance
A recent study categorized 130 hospitals as either low or high performers based on their talent management strategies. Discover how and why those top healthcare centers outperformed their lower performing counterparts.
Study of Advisory Success defines what success means for advisors in today’s environment and highlights the most salient issues facing advisors. Pershing’s inaugural study found that the most successful advisors anticipate what will lead the next generation of advisors. This year’s study finds that successful advisors adapt to client communications and client expectations.
Simplepractice Make what you’re worth: How to set your rates in private practiceSimplePractice
SimplePractice's annual rates report provides a look at what others in your area are charging for a therapy session. Using data billed through SimplePractice, you now have access to detailed information about what therapists charged nationwide for individual therapy sessions in 2017.
In an effort to better understand the behaviors, attitudes and cash flow challenges experienced by small businesses and self-employed professionals around the world, Intuit QuickBooks released the “The State of Small Business Cash Flow” Report.
Keeping top-performing physicians happy is the key to a hospital's success. They enhance the reputation of your hospital and attract more patients. With physician engagement at an all-time low, hospitals need to find a solution—and fast.
Discover how an insight community can help you build better relationships with your physicians and drive better business decisions:
https://www.visioncritical.com/solutions/health-and-pharmaceuticals/
How to set your rates in a private therapy practice.SimplePractice
In addition to providing tips and guidance on how to set your rates, we also included the median therapy session rates for all 50 states and metropolitan areas in 2017. Based on over six million sessions billed through SimplePractice, this information provides an extremely reliable way to see how your rates compare to others in your state or region
Retaining good employees and recruiting new ones are two tough issues that many employers deal with regularly. With unemployment rates fairly low in many parts of the country, these challenges are magnified. Accordingly, employee benefits are being used in different ways to address the problem. Here's how.
Broadridge & pwc: ProxyPulse First EditionBroadridge
How well do you know your shareholders?
Engaging all shareholders can make the difference
in achieving important voting benchmarks.
ProxyPulse™ is the product of collaboration between Broadridge Financial Solutions
and PwC’s Center for Board Governance. ProxyPulse provides data and analysis on voting
trends as the proxy season progresses. This first edition for the 2013 season covers the 549 annual meetings held between January 1, and April 23, 2013 and subsequent editions will incorporate May and June meetings. These reports are part of an ongoing commitment to provide valuable benchmarking data to the industry.
Conducting a Cost-Benefit AnalysisIt is relatively easy to dev.docxmargaretr5
Conducting a Cost-Benefit Analysis
It is relatively easy to develop alternative solutions for any identified problem. You do have to be careful about leaping into what appears to be an obvious solution. You need to determine which identified alternative best meets the needs and expectations of the community. In this assignment, you will be identifying at least three potential alternatives to resolve the problem you identified in the first assignment. There are a number of factors you need to consider in conducting a policy analysis: realistic options, a cost-benefit analysis, and objectivity.
Realistic Alternatives
At times, you may notice people suggesting an alternative, which everyone knows will be unacceptable. The alternative is often added simply to provide an option that can be easily rejected, with the intention of guiding the decision-making in a specific direction. This should be considered unethical behavior in a public administrator. There will always be diverse views on how to move forward to resolve a problem, based on differing values and perspectives on the issue. You have to try to be objective, providing an unbiased view of how the community wishes to move forward, being open to an approach you might not necessarily support on a personal level. Additionally, you should always include the status quo as one of the alternatives. You might find, at certain times and with certain issues, the status quo might be the best we can hope for at the moment, and therefore it should be considered. Even if we know the status quo may be unacceptable, including it provides a benchmark to use as a contrast and comparison with the proposed alternatives, providing insights into how alternatives might support a more desirable outcome.
Cost-benefit Approach
The classical cost-benefit process emerged from the field of micro-economics. It focuses narrowly on financial costs. It requires finding a means to assign a dollar value to each alternative, and the alternative with the best cost-benefit ratio (i.e., benefits are greater than costs) is selected. Over time, a macro-economic model developed, which included the consideration of non-financial metrics tied to perceptions, values, and other non-monetary measures. You will still try to find an objective means to capture this for assessment, and you may integrate financial metrics such as those used in a micro-economic model. Whatever approach you develop, you will be expected to find objective means to define, measure, and weigh alternatives to determine which one best supports mission success.
Objectivity
It is all too easy to find your personal values affecting your analysis and evaluation of alternatives. It is important you understand and control for your personal values when assessing alternatives, providing an unbiased analysis.
For this assignment, provide a cost-benefit analysis of your proposed alternatives for addressing the problem you identified in the first assignment. The problems and.
Fundraising Basics_A Complete Guide_Building Relationships for Your Organization Through Annual Giving1Fundraising Basics_A Complete Guide_Building Relationships for Your Organization Through Annual Giving2Fundraising Basics_A Complete Guide_Building Relationships for Your Organization Through Annual Giving3Fundraising Basics_A Complete Guide_Building Relationships for Your Organization Through Annual Giving4Fundraising Basics_A Complete Guide_Building Relationships for Your Organization Through Annual Giving5Fundraising Basics_A Complete Guide_Building Relationships for Your Organization Through Annual Giving6Fundraising Basics_A Complete Guide_Building Relationships for Your Organization Through Annual Giving7Fundraising Basics_A Complete Guide_Building Relationships for Your Organization Through Annual Giving8Fundraising Basics_A Complete Guide_Building Relationships for Your Organization Through Annual Giving9
Relationship Fundraising
How to Keep Donors Loyal
Adrian Sargeant
This article explores how relationship marketing and its variant
relationship fundraising may be used to assist nonprofits in
reducing the lapse rate of donors to their organization. Employ-
ing a postal survey of ten thousand donors to causes in a variety
of categories, the author concludes that although approximately
one in five donors might lapse because of a change in financial
circumstances, a similar number simply elect to switch their
support to other organizations. The role of the quality of service
offered to the donor in enhancing retention is also highlighted,
as are donor perceptions of the feedback they receive and the
impact they believe their gift might have on the cause.
C
HARITIES in the United Kingdom have found it increasingly
difficult to raise funds over the past ten years. The proportion
of UK households electing to support charity is now at a
twenty-year low (Pharoah and Tanner, 1998) and though average
gifts appear to have risen to compensate, it seems clear that the vol-
untary sector has become increasingly reliant on a hard core of char-
ity donors (National Council for Voluntary Organizations, 1999a).
Despite the apparent contraction in the donor pool, the number of
registered charities in the United Kingdom continues to grow at
approximately seven thousand annually (National Council for Vol-
untary Organizations, 1999b). Indeed, this growth has caused par-
ticular problems since many of the newer causes are inherently more
attractive to donors than those that have been in existence for a long
period of time. A number of hospitals and schools, for example, have
now registered as charities for the first time; it has historically always
been easier to raise funds for education, or a sick child, than to secure
funding to resolve homelessness or third-world famine (Sargeant and
Kaehler, 1998).
The contracting donor pool has made donor-acquisition activity
particularly problematic in recent times. Charities have thus
NONPROFIT MANAGEMENT.
Crowdsourcing, Transparency and Results Based Charity RatingsCharityNav
Charity Navigator's President & CEO, Ken Berger, presented on the topic of “Crowdsourcing, Transparency and Results Based Charity Ratings: The Next Generation of Nonprofit Evaluation” at Columbia University.
Slides for An Introduction to Results Reporting WebinarCharityNav
Charity Navigator has developed a new rating dimension - called Results Reporting - that specifically examines how well charities report on their results. In this webinar, we explain why Charity Navigator developed Results Reporting metrics, introduce the new methodology and explain our process for implementation.
Grant Readiness 101 TechSoup and Remy ConsultingTechSoup
In this webinar, nonprofits learned how to delve into the minds of funders, unveiling what they truly seek in qualified grant applicants, and tools for success.
Learn more about the Grant Readiness Review service by Remy Consulting at TechSoup to help you gather, organize, and assess the strength of documents required for grant applications.
Donor voice open letter to uk fundraisersDonorVoice
An open letter to the UK Fundraising community arguing that the solution to the problems of angry and frustrated donors, negative press and stagnant growth is less about changing what you do but how you do it…
The non-profit sector has grown rapidly if measured by the number of organizations. Alas, it is also shrinking by the more meaningful measure of private giving as a share of national income; on this score it is down 11%.
A smaller pie and more mouths to feed is a recipe for disaster and yet, status quo thinking and activity dominate within organizations. The growth curve can be bent but only with a willingness to do business much differently.
In the realms of computer science, operations research and management science lives the world of mathematical optimization, conceptually a very simple concept, with the purpose of finding the best approach from a set of available alternatives.
This definition could just as easily be applied to fundraising strategy, and even life. There is however one insidious concern with optimization; what if the set of alternatives we are optimizing or choosing amongst is not complete? What if we have unintentionally omitted the best alternative from consideration? Unknowingly the “optimum” isn’t optimum at all, merely the best of our not- so- best options.
Mathematicians call this “local optimization” versus “global optimization” with the former representing identification of a “winner” among a set of choices that does not include the overall (or global) best choice.
This global versus local phenomenon is very useful when conceptually considering the lack of growth in non-profit fundraising and how to fix it.
Here is the bottom line - your website visitors are having good and bad experiences on your website every day. They also have varying degrees of loyalty to your organization.
You can start to gain this insight but more importantly, start acting on it in a completely automated way using the DonorVoice feedback widget to,
1) fix bad experiences (automatically) when they occur
2) identify systemic user experience issues
3) build on positive experiences
4) identify how much $ you are leaving on the table from those who DONATE to you (trust us, you are leaving $ on the table even from the ones who convert)
DonorVoice Overview Deck.
How do you truly address the leaky bucket?
What is the best way to spend the next dollar?
How do build relationships with donors that tie to the bottom line?
We conducted analysis of the Committed Donor using our national sample of recent, frequent cause donors.
This infographic shows some interesting facts about the Committed.
Lots has been written, talked and preached about the need to create, maintain and grow donor relationships...with near unanimity about the immense value derived: Higher retention. Higher net income. Higher Life Time Value.
What is missing is a systematic, math-based, proof-based and theory-based process to measure the strength of the donor relationship and the marketing, communications, fundraising and operational actions your organization can take to affect it.
In this presentation you will see evidence of the predictive power of the something we call Donor Commitment - an attitudinal indicator of future behavior. We will show that it is a better predictor than other attitudinal models or frameworks and how you can use it to track progress and segment your file in a way that supports your existing, behavior based approaches.
We will also identify what we call the "drivers" of Commitment, the seven actions/activities your organization must engage in to increase Commitment.
Donor Relationships can be grown and fostered to improve retention and key financial behaviors over time. What is required is a theory based view of how these relationships form and how to measure and systematically impact them in simple, straightforward ways.
GDG Cloud Southlake #33: Boule & Rebala: Effective AppSec in SDLC using Deplo...James Anderson
Effective Application Security in Software Delivery lifecycle using Deployment Firewall and DBOM
The modern software delivery process (or the CI/CD process) includes many tools, distributed teams, open-source code, and cloud platforms. Constant focus on speed to release software to market, along with the traditional slow and manual security checks has caused gaps in continuous security as an important piece in the software supply chain. Today organizations feel more susceptible to external and internal cyber threats due to the vast attack surface in their applications supply chain and the lack of end-to-end governance and risk management.
The software team must secure its software delivery process to avoid vulnerability and security breaches. This needs to be achieved with existing tool chains and without extensive rework of the delivery processes. This talk will present strategies and techniques for providing visibility into the true risk of the existing vulnerabilities, preventing the introduction of security issues in the software, resolving vulnerabilities in production environments quickly, and capturing the deployment bill of materials (DBOM).
Speakers:
Bob Boule
Robert Boule is a technology enthusiast with PASSION for technology and making things work along with a knack for helping others understand how things work. He comes with around 20 years of solution engineering experience in application security, software continuous delivery, and SaaS platforms. He is known for his dynamic presentations in CI/CD and application security integrated in software delivery lifecycle.
Gopinath Rebala
Gopinath Rebala is the CTO of OpsMx, where he has overall responsibility for the machine learning and data processing architectures for Secure Software Delivery. Gopi also has a strong connection with our customers, leading design and architecture for strategic implementations. Gopi is a frequent speaker and well-known leader in continuous delivery and integrating security into software delivery.
Unlocking Productivity: Leveraging the Potential of Copilot in Microsoft 365, a presentation by Christoforos Vlachos, Senior Solutions Manager – Modern Workplace, Uni Systems
LF Energy Webinar: Electrical Grid Modelling and Simulation Through PowSyBl -...DanBrown980551
Do you want to learn how to model and simulate an electrical network from scratch in under an hour?
Then welcome to this PowSyBl workshop, hosted by Rte, the French Transmission System Operator (TSO)!
During the webinar, you will discover the PowSyBl ecosystem as well as handle and study an electrical network through an interactive Python notebook.
PowSyBl is an open source project hosted by LF Energy, which offers a comprehensive set of features for electrical grid modelling and simulation. Among other advanced features, PowSyBl provides:
- A fully editable and extendable library for grid component modelling;
- Visualization tools to display your network;
- Grid simulation tools, such as power flows, security analyses (with or without remedial actions) and sensitivity analyses;
The framework is mostly written in Java, with a Python binding so that Python developers can access PowSyBl functionalities as well.
What you will learn during the webinar:
- For beginners: discover PowSyBl's functionalities through a quick general presentation and the notebook, without needing any expert coding skills;
- For advanced developers: master the skills to efficiently apply PowSyBl functionalities to your real-world scenarios.
Communications Mining Series - Zero to Hero - Session 1DianaGray10
This session provides introduction to UiPath Communication Mining, importance and platform overview. You will acquire a good understand of the phases in Communication Mining as we go over the platform with you. Topics covered:
• Communication Mining Overview
• Why is it important?
• How can it help today’s business and the benefits
• Phases in Communication Mining
• Demo on Platform overview
• Q/A
A tale of scale & speed: How the US Navy is enabling software delivery from l...sonjaschweigert1
Rapid and secure feature delivery is a goal across every application team and every branch of the DoD. The Navy’s DevSecOps platform, Party Barge, has achieved:
- Reduction in onboarding time from 5 weeks to 1 day
- Improved developer experience and productivity through actionable findings and reduction of false positives
- Maintenance of superior security standards and inherent policy enforcement with Authorization to Operate (ATO)
Development teams can ship efficiently and ensure applications are cyber ready for Navy Authorizing Officials (AOs). In this webinar, Sigma Defense and Anchore will give attendees a look behind the scenes and demo secure pipeline automation and security artifacts that speed up application ATO and time to production.
We will cover:
- How to remove silos in DevSecOps
- How to build efficient development pipeline roles and component templates
- How to deliver security artifacts that matter for ATO’s (SBOMs, vulnerability reports, and policy evidence)
- How to streamline operations with automated policy checks on container images
Pushing the limits of ePRTC: 100ns holdover for 100 daysAdtran
At WSTS 2024, Alon Stern explored the topic of parametric holdover and explained how recent research findings can be implemented in real-world PNT networks to achieve 100 nanoseconds of accuracy for up to 100 days.
UiPath Test Automation using UiPath Test Suite series, part 4DianaGray10
Welcome to UiPath Test Automation using UiPath Test Suite series part 4. In this session, we will cover Test Manager overview along with SAP heatmap.
The UiPath Test Manager overview with SAP heatmap webinar offers a concise yet comprehensive exploration of the role of a Test Manager within SAP environments, coupled with the utilization of heatmaps for effective testing strategies.
Participants will gain insights into the responsibilities, challenges, and best practices associated with test management in SAP projects. Additionally, the webinar delves into the significance of heatmaps as a visual aid for identifying testing priorities, areas of risk, and resource allocation within SAP landscapes. Through this session, attendees can expect to enhance their understanding of test management principles while learning practical approaches to optimize testing processes in SAP environments using heatmap visualization techniques
What will you get from this session?
1. Insights into SAP testing best practices
2. Heatmap utilization for testing
3. Optimization of testing processes
4. Demo
Topics covered:
Execution from the test manager
Orchestrator execution result
Defect reporting
SAP heatmap example with demo
Speaker:
Deepak Rai, Automation Practice Lead, Boundaryless Group and UiPath MVP
Sudheer Mechineni, Head of Application Frameworks, Standard Chartered Bank
Discover how Standard Chartered Bank harnessed the power of Neo4j to transform complex data access challenges into a dynamic, scalable graph database solution. This keynote will cover their journey from initial adoption to deploying a fully automated, enterprise-grade causal cluster, highlighting key strategies for modelling organisational changes and ensuring robust disaster recovery. Learn how these innovations have not only enhanced Standard Chartered Bank’s data infrastructure but also positioned them as pioneers in the banking sector’s adoption of graph technology.
SAP Sapphire 2024 - ASUG301 building better apps with SAP Fiori.pdfPeter Spielvogel
Building better applications for business users with SAP Fiori.
• What is SAP Fiori and why it matters to you
• How a better user experience drives measurable business benefits
• How to get started with SAP Fiori today
• How SAP Fiori elements accelerates application development
• How SAP Build Code includes SAP Fiori tools and other generative artificial intelligence capabilities
• How SAP Fiori paves the way for using AI in SAP apps
DevOps and Testing slides at DASA ConnectKari Kakkonen
My and Rik Marselis slides at 30.5.2024 DASA Connect conference. We discuss about what is testing, then what is agile testing and finally what is Testing in DevOps. Finally we had lovely workshop with the participants trying to find out different ways to think about quality and testing in different parts of the DevOps infinity loop.
In his public lecture, Christian Timmerer provides insights into the fascinating history of video streaming, starting from its humble beginnings before YouTube to the groundbreaking technologies that now dominate platforms like Netflix and ORF ON. Timmerer also presents provocative contributions of his own that have significantly influenced the industry. He concludes by looking at future challenges and invites the audience to join in a discussion.
GraphSummit Singapore | The Future of Agility: Supercharging Digital Transfor...Neo4j
Leonard Jayamohan, Partner & Generative AI Lead, Deloitte
This keynote will reveal how Deloitte leverages Neo4j’s graph power for groundbreaking digital twin solutions, achieving a staggering 100x performance boost. Discover the essential role knowledge graphs play in successful generative AI implementations. Plus, get an exclusive look at an innovative Neo4j + Generative AI solution Deloitte is developing in-house.
UiPath Test Automation using UiPath Test Suite series, part 5DianaGray10
Welcome to UiPath Test Automation using UiPath Test Suite series part 5. In this session, we will cover CI/CD with devops.
Topics covered:
CI/CD with in UiPath
End-to-end overview of CI/CD pipeline with Azure devops
Speaker:
Lyndsey Byblow, Test Suite Sales Engineer @ UiPath, Inc.
Alt. GDG Cloud Southlake #33: Boule & Rebala: Effective AppSec in SDLC using ...James Anderson
Effective Application Security in Software Delivery lifecycle using Deployment Firewall and DBOM
The modern software delivery process (or the CI/CD process) includes many tools, distributed teams, open-source code, and cloud platforms. Constant focus on speed to release software to market, along with the traditional slow and manual security checks has caused gaps in continuous security as an important piece in the software supply chain. Today organizations feel more susceptible to external and internal cyber threats due to the vast attack surface in their applications supply chain and the lack of end-to-end governance and risk management.
The software team must secure its software delivery process to avoid vulnerability and security breaches. This needs to be achieved with existing tool chains and without extensive rework of the delivery processes. This talk will present strategies and techniques for providing visibility into the true risk of the existing vulnerabilities, preventing the introduction of security issues in the software, resolving vulnerabilities in production environments quickly, and capturing the deployment bill of materials (DBOM).
Speakers:
Bob Boule
Robert Boule is a technology enthusiast with PASSION for technology and making things work along with a knack for helping others understand how things work. He comes with around 20 years of solution engineering experience in application security, software continuous delivery, and SaaS platforms. He is known for his dynamic presentations in CI/CD and application security integrated in software delivery lifecycle.
Gopinath Rebala
Gopinath Rebala is the CTO of OpsMx, where he has overall responsibility for the machine learning and data processing architectures for Secure Software Delivery. Gopi also has a strong connection with our customers, leading design and architecture for strategic implementations. Gopi is a frequent speaker and well-known leader in continuous delivery and integrating security into software delivery.
1. What is Your
Relationship
Status
with Your
Donors?
DonorVoice presents:
The First Annual Donor Commitment Report
Answering the question of how strong your donor
relationships are and why it matters.
September 2011
www.thedonorvoice.com
2. Table of Contents
I. Why We Embarked on This Project
II. Our Premise
III. Methodology
IV. What We Found Nationally – The 6 Key Takeaways
V. Supporting Data for the 6 Key Takeaways
VI. Supplemental Report – Proof of Link Between
Donor Commitment and Donor Behavior
3. Why We Embarked on This Project
Everyone acknowledges there are significant issues with acquisition; namely costs going
up, yields going down. There are also significant issues with retention; namely there isn’t
enough. This is really two sides of the same coin; the increasingly expensive-to-acquire
donor coming in has little motivation to stay.
The financial argument for improving donor retention is well known - it can cost up to 10
times as much to bring in a new donor as tokeep an existing one (Sargeant & Lee) and
it takes, on average, 18 months for a new donor to cover the cost of acquisition. Said
another way, unless you have a specific plan to keep a newly acquired donor on the
file for at least two years (assuming zero net income isn’t your goal and how can it be?)
then your organization, its mission and programs would be better served by not taking
their initial contribution.
If the problem of acquisition and retention are related and severe and the financial
imperative to fix it so clear then why are the trend lines getting worse, not better? And
why aren’t donors who give you one donation not more motivated to give you a
second?
Our Retention Premise
Impacting donor attitudes is the key to retention because,
• These attitudes dictate donor behavior AND
• Donorattitudes are what an organization impacts with its actions.
4. Methodology
National Survey
DonorVoice conducted an online, nationally (US) representative survey among 1200
recent (last 12 months), frequent (more than 2 gifts to cause based charities) donors.
The survey responses were collected between July 24th and August 1st. The fielding
process adhered to best practices to assure maximum coverage across all days of the
week and times of day.
The sampling margin of error on this sample is +/- 2.8% at the 95% confidence level.
House File Email Survey
We conducted a separate online survey using email addresses supplied by
participating organizations – email addresses for whom the organization also had
transaction history, meaning these respondents are donors who also elected to provide
an email address at some point.
The survey responses were collected between August 20th and September 10th. The
fielding process adhered to best practices to assure maximum coverage across all days
of the week and times of day.
The sampling margin of error for these surveys varies based on the number of responses
for each organization.
The results of this analysis are not reported here but are available, in aggregate (and
anonymized) form upon request.
5. What We Found Nationally
1. We identified a math-based way to measure, score and improve donor
attitudes. We call it Donor Commitment and it is a proven, leading indicator of
future behavior.
2. For every 1000 donors an organization moves from Low to High Commitment it
will receive on average $200,000 more income
3. Calculating an accurate Donor Commitment Score requires ONLY 3 questions
and this score predictsbehavior better than other models.
4. The Donor Commitment Score can be used for benchmarking, tracking and
targeting. We have also developed inexpensive tools to help you do this.
5. In addition, we have identified the7 Key Drivers, from among 34 possible options,
an organization must take to improve Donor Commitment.
6. There is a best practices Idea Bank on how to deliver on the 7 Key Drivers.
What follows is supporting data for each of the 6 key takeaways.
6. Donor Commitment, a math based
way to measure and improve donor
retention
Relationship Theory
We did not invent Relationship Theory and a lot of good work has been done by
academics and practitioners alike to apply it in commercial settings to determine if the
underlying elements that constitute a healthy interpersonal relationship also apply in
business to business (B2B) and business to consumer (B2C) settings; the answer that we
and many others have found is a resounding ―Yes.‖
This study was done to determine if the same holds true in a non-profit to donor (N2D?)
context. Again, a resounding ―Yes.‖
There is a more detailed white paper available herethough we thought it important to
provide some context for this report.
The donor relationship journey starts with the need to establish a basic, or what we call
―Functional‖ connection to the organization, often expressed as being reliable; the
donor knows what to expect from your organization, the experience is consistent. Fail
to do this and you fail, period.
Achieve this basic level of functional or satisfaction-based connection and you have
the opportunity to build the personal connection (while also having some impact on
the trust or commitment component). The personal connection is a more emotional
one, in relationship vernacular it is ―fidelity‖, the bond that says there is a two-way street
of give and take, of mutual respect and of the donor believing the organization knows
him/her and cares.
Trust is the linchpin to true (i.e. mindshare based) loyalty – not the often deceptive,
pattern of repeat behavior via RFM analysis. The kind of relationship that moves the
donor to overlook shortcomings, give greater share of wallet, promote the organization
and go out of his/her way to engage with it.
7. For every 1,000 donors moved from Low to
High Commitment, expect $200,000 in
increased revenue.
This chart shows two groups from our national survey of recent, frequent donors – those
with High Commitment to a charity they gave to in the last 12 months and those Low in
Commitment. The dollar amount is the 3 year average given to the respective charity
and the 131% increase, from $149 to $344, one can expect if the organization
effectively stewards the donor from Low to High Commitment.
This translates into
approximately
$200,000 more for
every 1,000 donors
moved from Low to
High Commitment.
ional average of 31%
and 73 respectively.
This is, however, just
a national average
or benchmark. For
individual charities,
the results can be
even more
dramatic. For
example, one
organization we
studied can
anticipate $1,560,000 in additional three year giving for every 100,000 active donor they
steward from Low to High Commitment.
8. The Donor Commitment Score TM requires ONLY
3 questions and predicts behavior better than
other models.
A key performance indicator (KPI) is only worth having if it is aligned with organizational
goals. The Donor Commitment Score measures, at its core, the level of motive or intent
a donor has to maintain the relationship with the organization. In this way, it is a
forward looking or leading indicator of future behavior that correlates with recency,
frequency and giving amount (or RFM) – the bread and butter of non-profit behavioral
targeting and segmentation.
However, this Key Performance Indicator must also be easy to implement, score and
track—all important goals in the development of this model. There are only three
questions required to create the Donor Commitment ScoreTM, all asked on a 0 to 10
scale from ―strongly disagree‖ to ―strongly agree‖. These 3 questions were identified
through a rigorous iterative process of scale development starting, initially, with well
over 100 items.
The donor or constituent response to any single question is irrelevant, only the
composite score matters.
0 to 10 point agree/disagree scale
1. I am a committed (insert org name) donor
2. I feel a sense of loyalty to (insertorg name)
3. (insertorganization name) is my favorite
charitable org
9. Finally, the model must perform well against alternative models or frameworks. This
table shows ―high‖ and ―low‖ groupings for five different models or frameworks
designed to predict behavior.
The five include,
1) Donor
Commitment
2) DLI Index - a
purportedly
similar model
to
Commitment
based on
work of
academics
in the field.
3) Donor
Satisfaction,
a long-time
framework
based on
the
assumption
that delivering a satisfying experience leads to repeat behavior.
4) Favorability, which serves as a proxy for many brand oriented frameworks.
5) Likelihood to Recommend or the Net Promoter Score (NPS) as it is more
commonly known in commercial settings thanks to its creator, loyalty expert and
guru, Fred Reichheld.
The table shows the 3 year giving average for each model broken out into two groups,
those who score highly (i.e. ―High‖) and low (i.e. ―Low‖) on the respective approaches.
The percentage difference between the High and Low groups is shown in the last row
with Commitment doing the best, by a wide margin, among these competing
approaches.
10. The Donor Commitment Score TM can be used
for benchmarking, tracking and targeting.
As illustration of the power and value in benchmarking we compiled Donor
Commitment Scores for 50 big, well established brands in the non-profit space cutting
across six different sectors,
1) Health: Disease, Disorders
2) Health: Treatment & Prevention
3) Human Services
4) International Aid/Development
5) Youth & Children
6) Environment/Conservation/Animal Rights
11. This ranking and scoring were done to reflect several key points:
1) There is a tremendous amount of variance in the scores. This means the Donor
Commitment Score® (and model) is good at identifying differences among
groups.
2) This score and model is not a proxy for size or revenue. There are plenty of
(relatively) small groups that do well and larger groups who perform poorly.
What this suggests is that raising a lot of money is not the same as building strong
donor relationships.
3) We have created categories of scores and associated labels – Great, Good,
Marginal and Poor – to provide context so organizations who conduct their own
studies and start tracking Donor Commitment have a standardized frame of
reference.
Importantly, the organizations with asterisks have small sample sizes. Therefore, their
score should be considered directional ONLY. However, we do have privately
commissioned data that supports, the general location of an organization, be it
Great, Good, Marginal or Poor.
12. We identified 7 Key Drivers, from among 32
possible options, an organization must take to
improve Donor Commitment
Organizations spend a lot of time and money on communications, marketing,
fundraising and operations. But, which of, many, specific activities in each of these
functional areas truly has an impact on the way the donor thinks and feels about the
organization? Which truly impact the level of Commitment to the organization?
One thing we
know for sure,
it is always a
finite number
of activities
since the
donor
creates
many, mostly
subconcious,
filters or
mental
shortcuts to
get through
their day and
certainly
when forming
an opinion
about a non-profit and electing to give or not.
To answer the question more specifically we conducted a statistical analysis often
referred to as key driver analysis. We started however, with a well thought laundry list of
possible drivers, those activities we thought might impact Commitment. It is from this
master list of 32 possibilities that we identified the seven. While not identified on this
chart, we also have a score for each of the seven since their impact on Commitment is
not the same. Importantly, the master list and key drivers for any specific organization
would be more specific and tailored to that group. However, absent a custom study,
any organization is well served in focusing efforts on these.
13. There is a best practices Idea Bank on how to
deliver on the 7 key drivers.
Survey research, like any discipline, has strengths and weaknesses. One of the latter, in
our view, is the lack of specificity and nuance that quantitative research (versus
qualitative) can provide. Part of this weakness can be addressed through better
methodogies, analytical techniques and thought given to the goals and associated
design.
However, what is often required is informed interpretation to draw meaningful
conclusions and provide actionable recommendations. The 7 Key Drivers identified in
this study can certainly benefit from such informed interpretation. This is why we
recruited several prominent fundraising, marketing and donor gurus as advisors on this
project. These advisors include,
1) Katya Andresen, Chief Strategy Officer, Network for Good
2) Ken Burnett, author of the best selling book, ―Relationship Fundraising‖
3) Fraser Green, Partner, Good Works, Ottawa, Canada and author ―3D
Philanthropy‖ to be published in November.
4) Tom Belford, Agitator co-publisher. (Agitator was also co-sponsor of the overall
project)
5) Mark Rovner, Partner, Sea Change Strategies
Their role, while
multifaceted,
included offering up
concrete, specific
and creative ideas
for how an
organization might
go about delivering
on each driver. We
provide one such
(partial) list for Key
Driver #1 here.
14. Supplemental Report – Proof of Link
between Donor Commitment and
behavior
This analysis is from the separate survey using email addresses supplied by participating
organizations (12 total) – email addresses for whom the organization also had
transaction history, meaning these respondents are donors who also elected to provide
an email address at some point.
The table shows the aggregated, math based link between the Donor Commitment
model and the key behavior metrics of recency, frequency and dollar amount relative
to a commercial alternative ( based on work of academics in the donor loyalty field)
broken out into two groups, those who score high (i.e. ―High‖) and low (i.e. ―Low‖) on
the respective approaches. The difference between the low and high groups on these
3 behavior metrics – R, F and M – is shown in the last row.
For example, those high in Commitment are 115 days more recent than those who
score low compared with only a 13 day difference on the alternative model. This
means using Commitment as the leading indicator of future behavior and measuring
and managing it accordingly will yield more recent, frequent, higher dollar donors.