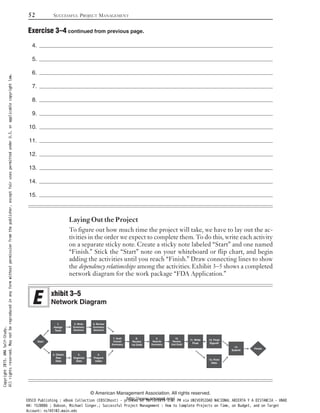
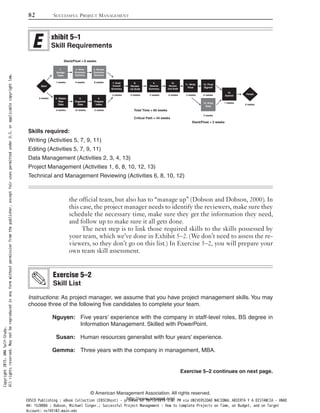
The document discusses how to determine the critical path of a project using network diagrams and calculating early and late start/finish dates. Specifically, it explains:
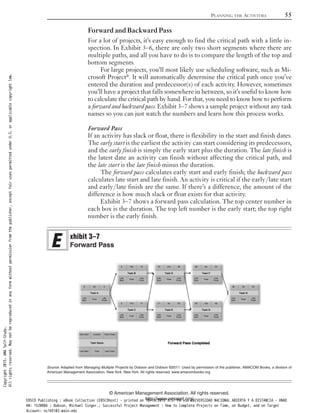
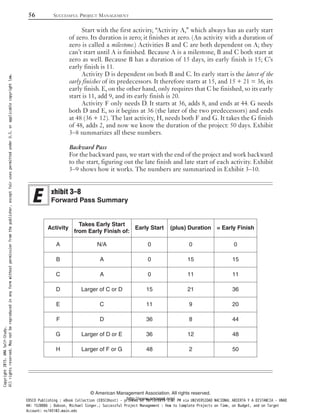
1) How to perform a forward pass to calculate early start and finish dates, showing how each activity's early finish determines the next activity's early start.
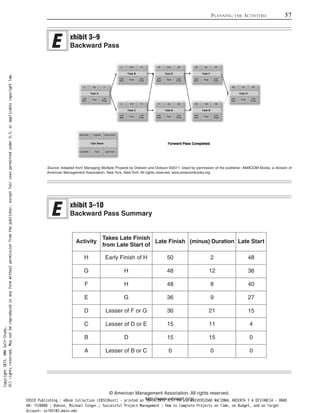
2) How to then perform a backward pass to calculate late start and finish dates working backwards from the project end.
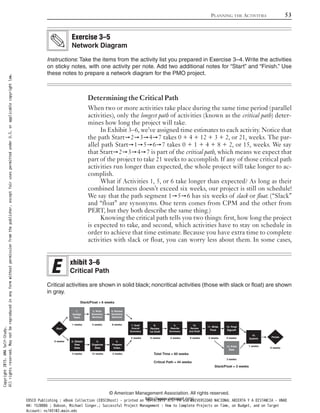
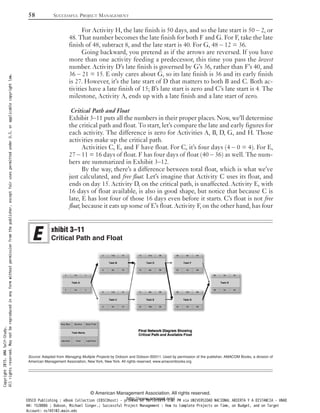
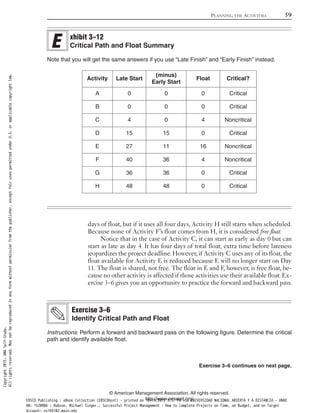
3) That the critical path is made up of activities where the early and late dates are equal, meaning they have no float or flexibility in scheduling. Non-critical activities have float that allows for scheduling flexibility.


![Zulma20[1]](https://cdn.slidesharecdn.com/ss_thumbnails/zulma201-110526124344-phpapp01-thumbnail.jpg?width=640&height=640&fit=bounds)


