Do School Wellness Policies Reflect Current Nutrition and PE/PA Practices in Massachusetts Schools?

Poster presentation for the American Public Health Association & Expo in Atlanta, GA Nov 2017: While a 2015 analysis of Massachusetts school wellness policies suggested opportunities to improve compliance with USDA requirements and recommendations, some data suggests that many best practices are already under adoption across the commonwealth. This study investigates whether wellness policies accurately reflect existing nutrition-related and physical education/physical activity (PE/PA) practices. School wellness policies submitted in 2014 and 2015 were scored using WellSAT 2.0 to review policy language and score for strength and comprehensiveness. Metrics were mapped to School Health Profiles (SHP) 2014 indicators by key terms and concepts. Statewide mean score of WellSAT 2.0 policy metrics were compared to percent implementing related activities as reported on SHP. While analyses of wellness policies sometime indicate poor inclusion of recommended nutrition and PE/PA standards, current practices among schools can actually reveal higher implementation rates. For example, while only 15% of policies reviewed require nutrition information for school meals be made available to students and parents, SHP data reveals that nearly 63% of schools are already making nutrition and caloric content of foods available. Similarly, while only half of reviewed polices require a written PE curriculum, SHP data indicates that 87% of schools are providing written curriculums to PE instructors. Preliminary results indicate misalignment of policy and practice on a number of nutrition-related and physical activity metrics. Findings suggest schools should be encouraged to better align their written policies with implementation practices. In addition, evaluators should assess both of these elements when determining which programmatic changes to recommend to school districts.

Recommended
More Related Content
What's hot
What's hot (7)
Similar to Do School Wellness Policies Reflect Current Nutrition and PE/PA Practices in Massachusetts Schools?
Similar to Do School Wellness Policies Reflect Current Nutrition and PE/PA Practices in Massachusetts Schools? (20)
More from JSI
More from JSI (20)
Recently uploaded
Recently uploaded (20)
Do School Wellness Policies Reflect Current Nutrition and PE/PA Practices in Massachusetts Schools?
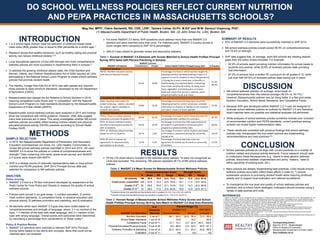
- 1. www.postersession.com DO SCHOOL WELLNESS POLICIES REFLECT CURRENT NUTRITION AND PE/PA PRACTICES IN MASSACHUSETTS SCHOOLS? INTRODUCTION METHODS Meg Her, MPH1, Claire Santarelli, RD, CDE, LDN1, Tamara Calise, Dr.Ph, M.Ed2 and W.W. Sanouri Ursprung, PhD1, (1) Massachusetts Department of Public Health, Boston, MA, (2) John Snow Inc. (JSI), Boston, MA CONCLUSION 1 in 5 school-aged children meet the definition of childhood obese (body mass index (BMI) greater than or equal to 95th percentile for a child’s age).1 Research shows that healthy behaviors, such as healthy eating and physical activity, can reduce childhood obesity.2,3,4 Local educational agencies (LEAs) with stronger and more comprehensive wellness policies are more successful in implementing them in schools.5 To address the growing childhood obesity rates, the Child Nutrition and Women, Infants, and Children Reauthorization Act of 2004 required all LEAs participating in the National School Lunch Program to create school wellness policies that promote student health. The Healthy, Hunger-free Kids Act of 2010 was later passed and required those policies to meet minimum standards developed by the US Department of Agriculture (USDA). Massachusetts also passed the Act Relative to School Nutrition in 2010, requiring competitive foods (foods sold “in competition” with the National School Lunch Program) to meet standards developed by the Massachusetts Department of Public Health (MDPH). Massachusetts school wellness policies were analyzed in 2015 and findings show low compliance with USDA guidance. However, other data suggest many best practices are in place. This study investigates whether MA school wellness policies accurately reflect existing nutrition-related and physical education/physical activity (PE/PA) practices according to School Health Profiles (SHP). Table 3: Percent Range of Massachusetts School Wellness Policy Scores and School Health Profiles Principal Survey 2014 by Item Match to WellSAT 2.0 Goal Area Elements SUMMARY OF RESULTS 25% of WellSAT 2.0 elements were successfully matched to SHP 2014. MA school wellness policies overall scored 36.5% on comprehensiveness and 18.4% on strength. SHP data suggest that, on average, more MA schools are meeting desired goals than the policy review indicates. For example: • 62.9% of schools report providing nutrition information for school meals to students and parents, while 30.8% of reviewed policies state providing that information. • 87.3% of schools have a written PE curriculum for all grades K-12, while just over half (54.5%) of reviewed polices state having one in place. School wellness policies do not align with current practices on a number of nutrition-related and physical activity elements. Future research should seek to understand these discrepancies (e.g., desire to keep generic wellness policies, disconnect between implementers and policy “makers,” need to refine specificity of existing tools, etc.). Many schools are already implementing best practices. LEAs should ensure wellness policies accurately reflect these efforts in order to: 1) ensure sustainable solutions to promoting student health while reducing childhood obesity and 2) support local evaluation and national surveillance. To characterize the true level and quality of school wellness policies and practices, and to inform future strategies, evaluators should consider using a variety of data sources and tools. Corresponding Author: Meg Her, M.P.H., Epidemiologist Office of Statistics & Evaluation Massachusetts Department of Public Health Meg.Her@state.ma.us SAMPLE SELECTION In 2015, the Massachusetts Department of Elementary and Secondary Education commissioned Jon Snow, Inc. (JSI) Healthy Communities to review MA school wellness policies submitted in 2014 and 2015. JSI used WellSAT 2.0 to score the policies on criteria of comprehensiveness and strength.6 Data containing LEA name, grade-levels served, and WellSAT 2.0 scores were shared with MDPH. SHP is a reliable source of nationally representative data on local school nutrition and PE/PA practices. SHP 2014 Principal Survey data was selected for comparison to MA wellness policies. ANALYSIS Policy scoring WellSAT 2.0 tool is a 78-item instrument developed by researchers at the Rudd Center for Food Policy and Obesity to measure the quality of school wellness policies. Policies were scored in six goal areas: 1) nutrition education, 2) school meal nutrition standards, 3) competitive foods, 4) physical education and physical activity, 5) wellness promotion and marketing, and 6) evaluation. All elements within each WellSAT 2.0 goal area were coded based on comprehensiveness and strength of language, where: 0 = no mention of the topic, 1 = mention of the topic with weak language, and 2 = mention of the topic with strong language. Overall scores and subscores were determined by calculating a percentage from combinations of these codes.6 Policy & Practice Review WellSAT 2.0 elements were matched to relevant SHP 2014 Principal Survey items based on key terms and concepts. Items that could not be matched were not reviewed. RESULTS Table 2: WellSAT 2.0 Mean Scores for Massachusetts School Wellness Policies DISCUSSION REFERENCES MA school wellness policies, on average, score lower on comprehensiveness than the national average (36.5% vs. 44.7%).7 However, Massachusetts policies may be doing better in a few goal areas: Nutrition Education, School Meals Standards, and Competitive Foods. Because SHP was developed before WellSAT 2.0, it was not designed to evaluate school wellness policies as outlined by WellSAT 2.0 and therefore exact matches were not possible and statistical analyses not performed. While analyses of school wellness policies sometime indicate poor inclusion of recommended nutrition and PE/PA standards, current practices among schools can reveal higher implementation rates. These results are consistent with previous findings that school wellness policies may misrepresent the true extent schools are implementing recommendations and best practices.8,9 WellSAT 2.0 Goal Area Comprehesiveness Strength Nutrition Education 3 out of 7 64.1 - 66.2 30.8 - 36.4 73.3 - 88.4 School Meals Standards 1 out of 14 30.8 16.2 62.9 Competitive Foods 6 out of 11 13.1 - 73.7 4.0 - 42.4 45.5 - 100.0 Physical Education/Physical Activity 5 out of 20 9.6 - 89.9 2.0 - 54.5 39.5 - 87.3 Wellness Promotion & Marketing 4 out of 15 22.2 - 42.4 5.1 - 23.2 43.8 - 89.8 Evaluation 0 out of 11 n/a n/a n/a WellSAT 2.0 Percent Range (%)# of Elements Matched In Practice SHP 2014 Of the 216 observations included in the wellness policy dataset, 18 were not recognized as LEAs and excluded. The remaining 198 policies represent 49.1% of MA school wellness policies. For some WellSAT 2.0 items, SHP questions could address more than one WellSAT 2.0 element and were matched more than once. For matched pairs, WellSAT 2.0 policy scores or score ranges were compared to SHP 2014 percentages. SAS 9.3 was utilized to generate review and descriptive statistics. N Mean SD Mean SD All schools 198 36.5 16.6 (0.0, 75.0) 18.4 12.0 (0.0, 54.5) Grade levels unspecified 146 37.6 15.5 (0.0, 75.0) 19.1 11.2 (0.0, 54.5) Grades K-8 a 29 29.6 19.8 (2.1, 70.5) 13.5 14.3 (0.0, 46.6) Grades 6-12 b 14 38.5 17.6 (4.6, 64.6) 19.9 13.0 (0.9. 43.7) a Includes schools that specified serving students only in grades K-4, K-5, K-6, K-8, 5-8, and 6-8. b Includes schools that specified serving only students in grades 6-12, 7-12, 8-12, and 9-12. Comprehensiveness Score Strength Score Range Range 1. Ogden CL, Carroll MD, Fryar CD, & Flegal KM. (2015). Prevalence of Obesity Among Adults and Youth: United States, 2011–2014. NCHS Data Brief. No. 219; 2. Speroni KG, Earley C, & Atherton M. (2007). Evaluating the Effectiveness of the Kids Living Fit Program: A Comparative Study. Journal of School Nursing. 3. da Silva LSM, Fisberg M, de Souza Pires MM, Nassar SM, & Sottovia CB. (2013). The effectiveness of a physical activity and nutrition education program in the prevention of overweight in schoolchildren in Criciúma, Brazil. Journal of Clinical Nutrition. 67, 1200–1204. 4. Bishop J, Middendorf R, Babin T, & Tilson W. ASPE Research Brief: Child Obesity. (2005). US Department of Health & Human Services. 5. Schwartz MB, Henderson KE, Falbe J, Novak SA, Wharton C, Long M,…Fiore SS. (2012). Journal of School Health. 82(6). 6. Department of Elementary & Secondary Education & JSI Research & Training Institute, Inc. (2016) 2015 Massachusetts School Wellness Policy Review. 7. Piekarz E, Schermbeck R, Young SK, Leider J, Ziemann M, & Chriqui JF. (2016). School District Wellness Policies: Evaluating Progress & Potential for Improving Children’s Health Eight Years after the Federal Mandate. Bridging the Gap. 8. Lucarelli JF, Alaimo K, Belansky ES, Mang E, Miles R, Kelleher DK,…Lui H. (2015). Little Association Between Wellness Policies and School-Reported Nutrition Practices. Health Promotion Practice. 16(2) 193-201. 9. Brener ND, Chriqui JF, O’Toole TP, Schwartz, MB, McManus T. (2011). Establishing a Basline Measure of School Wellness-Related Policies Implemented in a Nationally Representative Sample of School Districts. Journal of American Dietetic Association.111(6) 894-901. Table 1: Excerpt of WellSAT 2.0 Elements with Scores Matched to School Health Profiles Principal Survey 2014 Items with Percent Practicing in Schools Comprehensive Strength NEPE6: Nutrition education teaches skills that are behavior-focused 64.1% 30.8% Percentage of schools in which teachers taught the following nutrition and dietary behavior topics in a required course for students in any of the grandes 6- 12 during the current school year: a) benefits of healthy eating, b) using food labels, c) balancing food intake and physical activity, d) eating more fruits, vegetables, and whole grains, e) choose foods and snacks that are low in solid fat, and f) preparing healthy meals and snacks. 73.3%- 88.4% SM11: Nutrition information for school meals (e.g., calories, saturated fat, sodium, sugar) is available to students and parents. 30.8% 16.2% Percentage of schools that have done any of the following during the current school year: provided information to students or families on the nutrition and caloric content of foods available. 62.9% PEPA1: There is a written physical education curriculum for grades K-12 89.9% 54.5% Percentage of schools in which those who teach PE are provided with a written PE curriculum. 87.3% PEPA 14: District addresses before and after school physical activity for all K-12 students. 65.2% 32.3% Percentage of schools that offer opportunities for all students to participate in intramural sports programs or physical activity clubs. 86.3% PEPA 16: Addresses physical activity breaks for all K-12 students. 20.7% 2.0% Percentage of schools in which students participate in PA breaks in classrooms during the school day outside of PE. 39.5% PEPA 20: Joint or shared-use agreements for physical activity participation at all schools. 19.2% 9.1% Percentage of schools that have a join use agreement for shared use of school or community PA facilities. 67.2% 1. Nutrition Education 4. Physical Education and Physical Activity WellSAT 2.0 Score WellSAT 2.0 Element School Health Profiles Principal Survey Item In Practice 2. Standards for USDA Child Nutrition Programs and School Meals