Poster presented at Durham University's Annual Earth Science Conference June 2015.
It was created as part of the Level 2 Geoinformatics module, and aims to demonstrate my skill with ArcGIS.
TEST BANK For Radiologic Science for Technologists, 12th Edition by Stewart C...
Do Impact Craters on Mars Serve as a Good Proxy for the Age of The Martian Surface?
1. "Do Impact Craters On Mars Serve As A Good Proxy For The Age of The Mar�an Surface?"
Chris�an Garvey | Dept. of Earth Sciences, Durham University | May 2015
INTRODUCTION
METHOD
RESULTS & DISCUSSION
CONCLUSION
Phase 4:
Further Study
-Q: Why is there greater cratering on higher
topography? Subsequently, why do northern
latitudes have relatively depressed topography,
whereas southern latitudes have relatively
raised topography? Is the bimodal topography
evidence for palaeo-tectonics?
- Q: Why is the raised topography generally
older?
200
Kilometers
Legend
Crater Density
<VALUE>
0.09 - 0.11
0.06 - 0.08
0.04 - 0.05
0.02 - 0.03
0 - 0.01
K Concentration
Value
High
Low
Legend
Slope (Degrees)
<VALUE>
0 - 1.3
1.4 - 3.1
3.2 - 4.9
5 - 7.1
7.2 - 10
11 - 14
15 - 18
19 - 24
25 - 29
30 - 42
250m Contour
A
A'
Olympus Mons
X-Section
200
Kilometers
Legend
Crater Density
<VALUE>
0.09 - 0.11
0.06 - 0.08
0.04 - 0.05
0.02 - 0.03
0 - 0.01
K Concentration
Value
High
Low
Legend
Slope (Degrees)
<VALUE>
0 - 1.3
1.4 - 3.1
3.2 - 4.9
5 - 7.1
7.2 - 10
11 - 14
15 - 18
19 - 24
25 - 29
30 - 42
250m Contour
Iceland
Highland-Lowland Boundary drawn up based on the location of the Highland geological unit,
"geologic Map of Mars 2014" Figure 1, and using the mearadius of Mars as the zero datum line
(3382.9km.
Highland-
Low
land
Transition
150°0'0"E
150°0'0"E
120°0'0"E
120°0'0"E
90°0'0"E
90°0'0"E
60°0'0"E
60°0'0"E
30°0'0"E
30°0'0"E
0°0'0"
0°0'0"
30°0'0"W
30°0'0"W
60°0'0"W
60°0'0"W
90°0'0"W
90°0'0"W
120°0'0"W
120°0'0"W
150°0'0"W
150°0'0"W
180°0'0"
60°0'0"N 60°0'0"N
30°0'0"N 30°0'0"N
0°0'0" 0°0'0"
30°0'0"S 30°0'0"S
60°0'0"S 60°0'0"S
´3,500
Kilometers
Legend
Crater Density
<VALUE>
0.092 - 0.11
0.079 - 0.091
0.065 - 0.078
0.052 - 0.064
0.038 - 0.051
0.025 - 0.037
0.011 - 0.024
0 - 0.01
Geological Units
Unit
Apron
Basin
Highland
Impact
Lowland
Polar
Transition
Volcanic
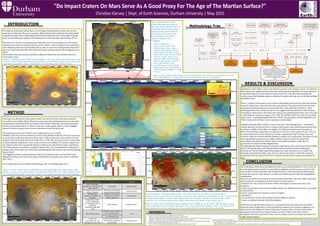
Methodology Tree
The majority of planetary bodies show scars of impact bombardment, whether they be from
asteroids or meteorites, Mars is no exception. Without being able to absolute date rocks linked
to speci�ic locations, these visible impact features have long been used to determine cratering
rates thus providing age ranges for the emplacement of major geologic units (Daubar, 2013).
This study uses ArcGIS as an analytical and illustrative tool in assessing the use of the relative
abundances of craters to relatively date the surface of Mars. Crater abundance will primarily be
used alongside potassium concentration data in order to answer the study question. Potassium
data were collected by the 2001 Mars Odyssey Gamma-ray Spectrometer (US Geological Survey,
2014).
This method primarily assumes a spatially randomised impact �lux and the preservation of
every impact crater.
Figure 1: Reference map of Mars with topography. The map uses a stretched colour ramp
from dark brown (high elevation) to pale orange (low elevation). Region X is an anomlous
area with no academic origin, it has high K-conc and high crater density (Fig.5).
Impact Craters
90 degrees N/S x
180 degrees W/E
graticule
Feature to
Polygon
DEM
Create
Hillshade
Select by Attributes
Export to Shapefile
Point to Point Density
Gamma Ray
Spectrometry Data
Potassium (K)
concentration
Geological Map
(Tanaka, K., et.al 2014)
Reclassify
-Simplify from 44 to 8 units
DEM
Create
Hillshade
E x t r a c t b y M a s k E x t r a c t b y M a s k
Feature to
Polygon
Olympus Mons Graticule
-13 to 24 degrees N x
139.5 to 127.2 degrees W
Reclassify
-break at zero datum
Extract by Attribute
-Raster to Polygon
Extent IndicatorSlope
Analysis
Create
Contours
Phase 3:
Olympus Mons Map
Phase 3:
Geological Map
Phase 2:
K Concentration with
Crater Density Map
Phase 1:
Crater Density
Distribution Map
Highland- Lowland
Boundary
900 x 1500km
graticule
Feature to Polygon
Potassium (K)
concentration
Iceland gif
Raster to Polygon
Extract by Mask
Figure 3: Olympus Mons Slope
Analysis Map featuring an east to
west cross section illustrating the 3D
morphology of the martian volcano
(produced using Google Earth Pro,
2015). Ignoring the scarp at the
base, the general slope of the
volcano is between 0 and
7.2degrees.
Figure 4 (Fig.5 inset): The potassium data has relatively low resolution: each pixel covers an
area of 88,209km2. In comparison the areal extent of Iceland is 103,001km2.
Figure 5 (below): K
concentration with Crater
Density Map. K-conc uses a
stretched symbology along a
colour ramp from blue to red,
where blue is low concentrations
and red is high. There is an
uncanny relationship between
the two data layers, however
this is not without some
anomalies such as the Tharsis
Bulge region and 180 degrees x
30-60S degrees (Region X, refer
to Fig.1).
150°0'0"E
150°0'0"E
120°0'0"E
120°0'0"E
90°0'0"E
90°0'0"E
60°0'0"E
60°0'0"E
30°0'0"E
30°0'0"E
0°0'0"
0°0'0"
30°0'0"W
30°0'0"W
60°0'0"W
60°0'0"W
90°0'0"W
90°0'0"W
120°0'0"W
120°0'0"W
150°0'0"W
150°0'0"W
60°0'0"N 60°0'0"N
30°0'0"N 30°0'0"N
0°0'0" 0°0'0"
30°0'0"S 30°0'0"S
60°0'0"S 60°0'0"S
´ 3,500
Kilometers
Elevation
Value
21241 m
-8201 m
´ 3,500
Kilometers
Elevation
Value
21241 m
-8201 m
Olympus
Mons
V a s t i t a s B o r e a l i s
Argyre
T h a r s i s
B u l g e
Hellas
Charyse
Planitia
Acidalia
Planitia
Utopia
Planitia
Elysium
Mons
Isidis
Region X
Region X
Figure 6 (above): Geological Map of Mars. The map shows not only that the Tharsis Bulge is
predominantly volcanic which is relatively young (low crater density and supported by Fig.7) but also that
the sigmooidal pattern of high crater density seems to be closely related to the distribution of the
Highland Unit, chronostratigraphically dated to be among the oldest units on Mars (Fig.7).
Figure 7 (above left): Geological History (adapted from Tanaka, K., et al. 2014). The 44 original units
were reclassified to the 8 broader geological units, which were then mapped in Fig.6. The history itself
was based around crater counting and is concordant with the results the study has yielded.
150°0'0"E
150°0'0"E
120°0'0"E
120°0'0"E
90°0'0"E
90°0'0"E
60°0'0"E
60°0'0"E
30°0'0"E
30°0'0"E
0°0'0"
0°0'0"
30°0'0"W
30°0'0"W
60°0'0"W
60°0'0"W
90°0'0"W
90°0'0"W
120°0'0"W
120°0'0"W
150°0'0"W
150°0'0"W
60°0'0"N 60°0'0"N
30°0'0"N 30°0'0"N
0°0'0" 0°0'0"
30°0'0"S 30°0'0"S
60°0'0"S 60°0'0"S´3,500
Kilometers
Legend
Crater Density
<VALUE>
0.092 - 0.12
0.079 - 0.091
0.065 - 0.078
0.052 - 0.064
0.038 - 0.051
0.025 - 0.037
0.011 - 0.024
0 - 0.01
Elevation
Value
21241 m
-8201 m
150°0'0"E
150°0'0"E
120°0'0"E
120°0'0"E
90°0'0"E
90°0'0"E
60°0'0"E
60°0'0"E
30°0'0"E
30°0'0"E
0°0'0"
0°0'0"
30°0'0"W
30°0'0"W
60°0'0"W
60°0'0"W
90°0'0"W
90°0'0"W
120°0'0"W
120°0'0"W
150°0'0"W
150°0'0"W
60°0'0"N 60°0'0"N
30°0'0"N 30°0'0"N
0°0'0" 0°0'0"
30°0'0"S 30°0'0"S
60°0'0"S 60°0'0"S´ 3,500
Kilometers
Legend
Crater Density
<VALUE>
0.092 - 0.12
0.079 - 0.091
0.065 - 0.078
0.052 - 0.064
0.038 - 0.051
0.025 - 0.037
0.011 - 0.024
0 - 0.01
Elevation
Value
21241 m
-8201 m
H
ighland-
Low
land
Transition
Figure 2: Crater Density Map; a classified greyscale symbology from white (high crater
density) to grey (low crater density), overlaying the Mars DEM. The crater densities show
a strong sigmoidal pattern across the southern hemisphere between low to mid latitudes.
Table 1: Primary Data Table. (Data: US Geological Survey, 2014)
Valles Marine
Tharsis
M
ont
REFERENCES
The multi-phase study has successfully been able to prove both hypothesis 1 and 2 correct. In
turn the initial question which warranted this investigation was also proven correct. As this
was a study in which no absolute data was determined, it can be said that, by drawing upon
various data sources, crater density is a useful and reliable proxy for determining geological
relationships.
However as with the vast majority of extra-terrestrial study there are many- albeit logical and
well considered- assumptions which have had to be made such as:
-Variation in K-conc is due to the decay of 40K remaining in a closed system since rock
formation.
-Impact rate has been constant and spatially random; not affected by eccentricity, or proximity
to asteroid belt.
-Inverse exponential size-frequency curve for impacts.
Limitations:
-Low resolution of K-conc data; unable to conduct high-res analysis.
-Craters are plotted as points; should be polygons.
Other than proving the initial question to a reasonable extent the study has borne further
questions. Most notably why is cratering relatively con�ined to the southern highlands- as is
apparent from the Highland-Lowland Transition boundary (Fig.2, 6)? Does this bimodal
topography point toward somekind of palaeo-tectonics? Futher, why is the northern
hemisphere relatively depressed? Is this a site of a paleao-ocean? Or perhaps the product of a
single, massive impact?
NAME OF DATA LAYER USE FORMAT
MOLA Topography
(Goddard): mola128_clon0
- DEM - full-res
Mars DEM Surface/ Raster
Gamma Ray Spectrometer
(LPL): k_concent
Potassium concentration
across surface of Mars.
Surface/ Raster
Robbins Crater
Database_20120821_Lat
Long Diam
Calculate the density of
impact craters within a
specific radial area
Point/ Vector
Geologic Map of Mars,
Scale 1:20,000,000
U.S. Geological Survey
SCIENTIFIC
INVESTIGATIONS MAP
3292
Mars Geology Polygon/ Vector
Mars Nomenclature
Determine prime locations
on the surface of the
planet. Label a DEM for use
as a reference map.
Text
*Iceland .gif
(*Data not from: US
Geological Survey, 2014)
Illustrate low resolution of
raster data for potassium
concentration.
Polygon/ Vector
Hypothesis 1 (H1), “Older surface rock will have a greater crater density record”, as it will have
been exposed for a greater period of time thus increasing the probability of it being impacted.
A sigmoidal pattern of crater density is evident from Fig.2. This illustrates the point that
certain areas of the highland region are de�icient in impact cratering, such as the Tharsis Bulge
and Hellas crater.
Phase 2 resulted in the exposure of an inverse relationship between K-conc and crater density,
whereby a high K-conc coincides with a low crater density. The variation in K-conc has been
interpreted as depicting the ratio between 40K/40Ar where 40K has a half life of 1.25ba
(McDougall & Harrison, 1999), thus low K-conc suggests the accumulation of 40Ar overtime,
indicating an older surface. This allows the surface to be relatively dated and K-conc to be used
as mineralogical evidence in support of H1. (N.B. The half life of 40K is less than the age of the
solar system, ~4.6ba (McDougall & Harrison 1999)). This prompted a further hypothesis, H2,
“Older surface rock will have a lower potassium concentration”.
Analysis of Olympus Mons in phase 3, part of the wider Tharsis Bulge (Fig.1) , an elevated
volcanic plateaux, has shown that it is a large shield volcano with relatively gentle �lanks and a
broad base >500km which offsets the height of 21,299m above datum (max elevation on
Mars). Tharsis Bulge is regarded as an anomaly as it has few craters and low K-conc. This can
be explained however by the relative late volcanic emplacement (Fig.7) of basic lavas and
volcanics, which are characteristically depleted in alkalis such as potassium. The reason for the
other signi�icantly anomalous area, Region X (Fig.1), however cannot be conclusively
determined, and will warrant further study. One possible hypothesis is that this is a
particularly enriched site of the Highland Unit.
The Highland Unit (Fig.6) displays the greatest crater density and is also found to be the oldest
(Fig.7), whereas the Apron and Volcanic Units which occupy the northern hemisphere
lowlands and Tharsis Bulge respectively, display low crater densities and are found to be
primarily composed of younger rocks. K-conc is also found to show a relatively consistent
relationship with the Apron Unit which is expected considering the mapped relationship in
Fig.5.
Open Planetary Data & Open Online Software:
US Geological Survey. (2014, December). (NASA) Retrieved February 26, 2015, from USGS Planetary GIS Web Server (PIGWAD): http://webgis.wr.usgs.gov/pigwad/maps/mars.html
Google. “Google Earth Pro” Google Earth 2015
Iceland image. Retrieved on March 3rd 2015,- based on “is.gif” from worldatlas.com http://www.worldatlas.com/webimage/countrys/europe/outline/is.gif
Daubar, I. J. (2013). The current martian cratering rate. 225.1(506-516).
Ivanov., B. A. (2001). Mars/Moon cratering rate ratio estimates. 96 (pp. 87-104).
McDougall, I., & Harrison, M. (1999). Geochronology and Thermochronology by the 40Ar/39Ar Method. Oxford University Press.
Robbins, S. J., & Hynek, B. M. (2012). A new global database of Mars impact craters ≥1 km. 117.
Tanaka, K. L. (2014). Geologic Map of Mars, Scale 1:20,000,000. Retrieved March 8, 2015, from U.S. Geological Survey Scienti�ic
Investigations Map SIM 3292.: http://pubs.usgs.gov/sim/3292
Wu, S. S. (1981). A method of de�ining topographic datums of planetary bodies. 37(pp. 147-180).
The project was divided into three phases. Phase one will look at the crater density pattern
across the surface of Mars (Fig.2). Phase two will examine the relationship between crater data
and potassium concentration (K-conc) (Fig.5). Phase three will identify and analyse anomalies
from the second phase (Fig.3, 6). There is scope for a further phase, phase 4, which highlights
avenues of further study in order to resolve questions borne from the study.
The following primary data (Table 1) was manipulated for use in ArcGIS:
-Robbins crater data, the most extensive record to date (Robbins & Hynek, 2012) was converted
from an Excel workbook to point data. Only craters >50km in diameter were considered in the
analysis as this reduced the dataset from 384,345 to 2,248. This not only removed a vast number
of small, relatively insigni�icant craters many of which were unlikely to be primary impacts, but
also made the data more manageable and left a suf�icient set with which to apply a hypothesis.
-The USGS geologic map of Mars compiled by Tanaka, 2014, was reclassi�ied from displaying 44
geologic units to 8 broader and more easily comprehendible units based on the inclusive geologic
history (Fig.7)
-The Highland-Lowland Transition border (Fig.2, 6) was drawn based on i) the extent of the
Highland Unit (Fig.6) and ii) the zero datum interpretted as being the mean radius, 3,382.9km
(Wu, 1981).
For an illustrated and more detailed methodology, refer to the Methodology Tree.
A A'