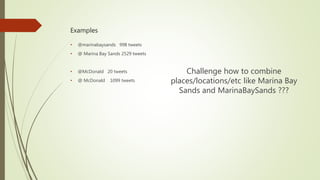
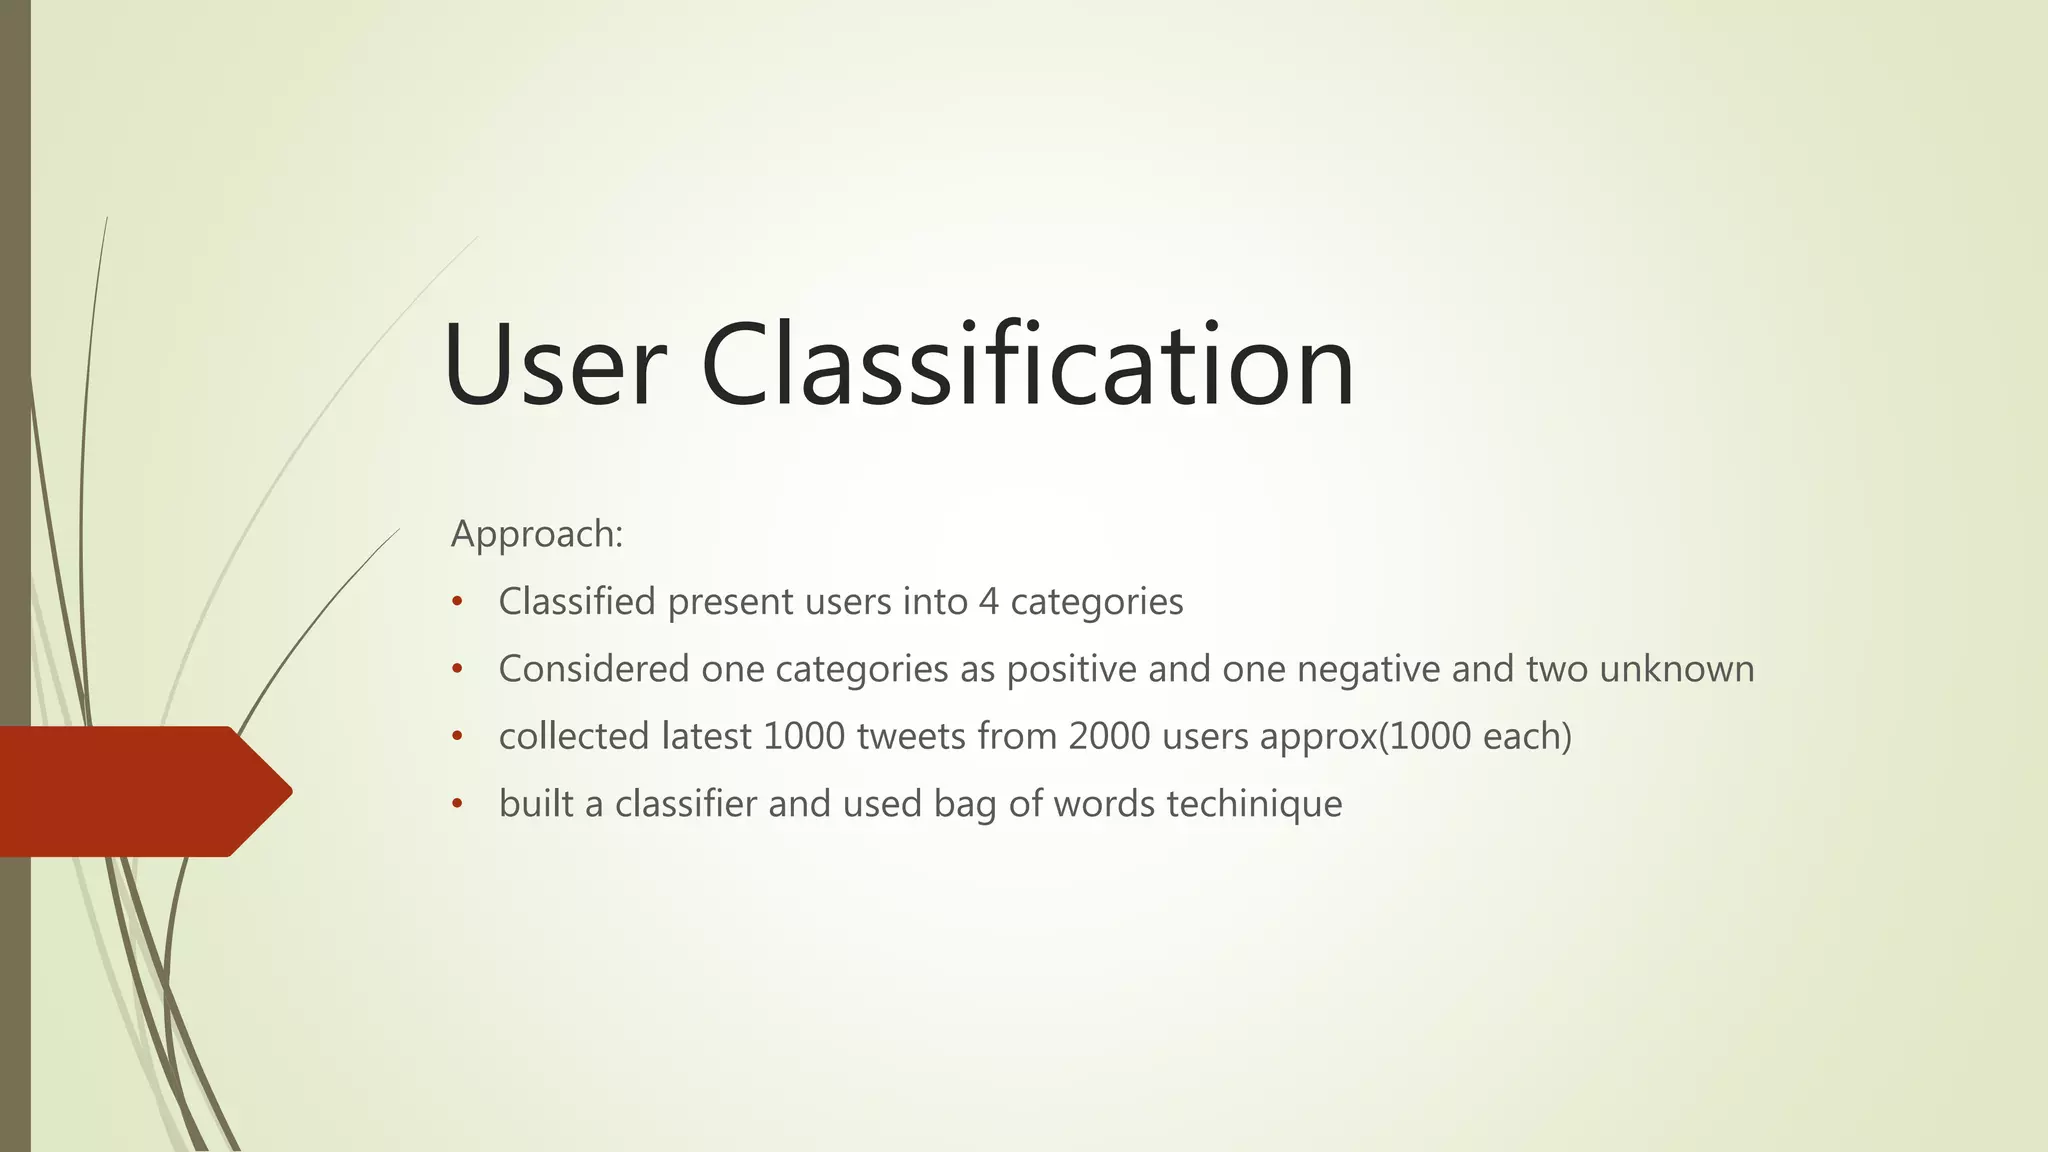
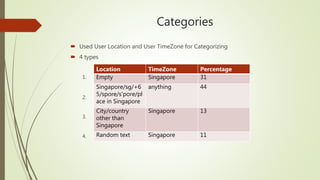
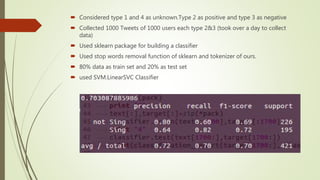
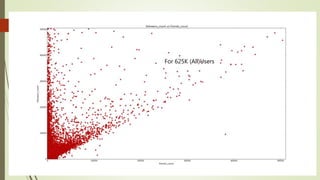
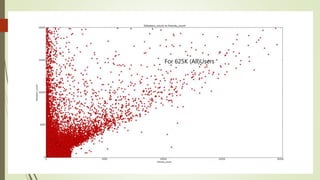
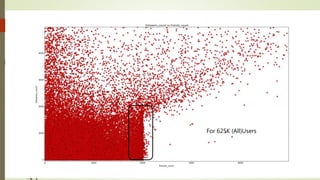
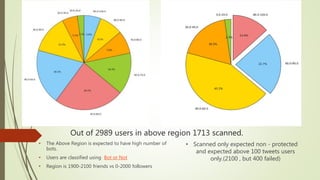
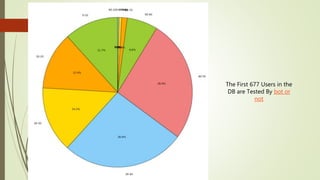
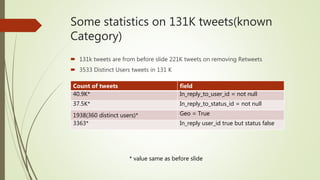
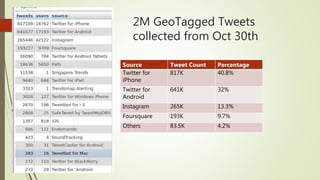
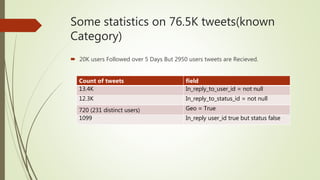
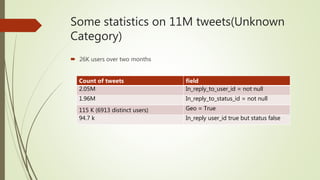
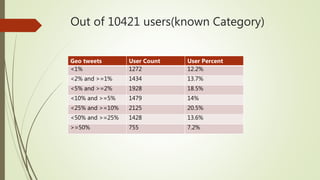
The document discusses user classification of Twitter users into 4 categories based on their location and timezone information extracted from their tweets and profiles. Over 2000 users were classified, with their most recent 1000 tweets collected and analyzed. A classifier was built using bag-of-words technique to categorize the users. The categories were then used to collect tweets from positive and negative users to build a training dataset for a classifier to identify bots.

![What happens when we follow users?(20 K
Users)
type Json format percentage
User is sender of the tweet ['tweet']['user']['id_str'] 71
user's tweet has been
retweeted
['tweet']['retweeted_status']
'in_reply_to_user_id_str']
&&
['tweet']['retweeted_status']
'user']['id_str']
7.67
user's has been replied to ['tweet']['in_reply_to_user_i
d_str']
11.2
User mentions and unkown - 10](https://image.slidesharecdn.com/588fa011-88c4-4011-92ab-6c6a00e1bd1c-170115172638/85/Internship-13-320.jpg)
![What happens when we follow users?
24-june -- 9th july (20 K Users*)
type Json format percentage
User is sender of the tweet ['tweet']['user']['id_str'] 55.2(230K)
user's tweet has been
retweeted
['tweet']['retweeted_status']
'in_reply_to_user_id_str']
&&
['tweet']['retweeted_status']
'user']['id_str']
14.6
user's has been replied to ['tweet']['in_reply_to_user_i
d_str']
8.78
User Mention ['tweet']['entities']['user_me
ntions']
0.23
unkown - 20.9
* 20 k users are different users from before slide](https://image.slidesharecdn.com/588fa011-88c4-4011-92ab-6c6a00e1bd1c-170115172638/85/Internship-14-320.jpg)
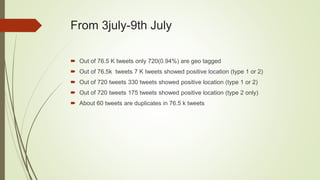
![What happens when we follow users?
From 3july-9th July(20K^)
type Json format percentage
User is sender of the tweet ['tweet']['user']['id_str'] 52(76.5K)
user's tweet has been
retweeted
['tweet']['retweeted_status']
'in_reply_to_user_id_str']
&&
['tweet']['retweeted_status']
'user']['id_str']
16.8
user's has been replied to ['tweet']['in_reply_to_user_i
d_str']
8.9
User mentions and unkown - 25.5
^ 20K users same as before slide](https://image.slidesharecdn.com/588fa011-88c4-4011-92ab-6c6a00e1bd1c-170115172638/85/Internship-21-320.jpg)
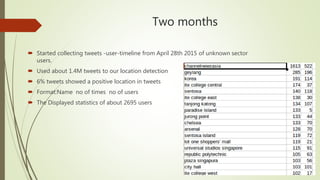
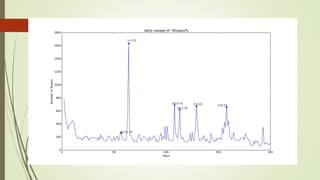
![Mainstream crawler And Actual data
Made a new stream with
FILTER_KEYWORDS = ['changi
airport','fansofchangi', cineleisure
orchard','vivo city','ion orchard',
'causewaypoint', 'woodlands checkpoint',
'gardensbythebay', 'bugisjunction', 'far
east plaza', 'itecollegeeast', 'ite college
west', 'ite college central'] and their few
variations
Got around 4.1k tweets from new
stream
At the same time frame 20k tweets
were collected by Mainstream
20% hit rate ( 20% tweets of new
stream are in Mainstream)
Recall that Mainstream is the
geotweets of Singapore
1134(27.5%) of 4.1k tweets are
geotagged and 834(20%) tweets are
found in Mainstream.
Out of 300 (7.5%)tweets which are
geotagged
31 tweets outside Singapore
279 tweets inside Singapore
Out of 4.1K tweets only 2.5K shows
positive location in our location
detector](https://image.slidesharecdn.com/588fa011-88c4-4011-92ab-6c6a00e1bd1c-170115172638/85/Internship-31-320.jpg)
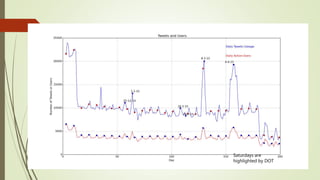
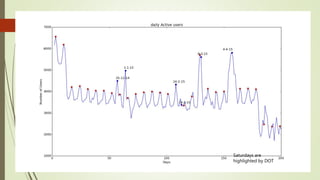
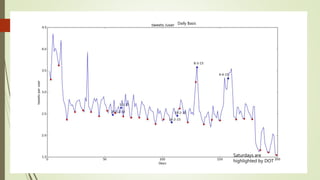
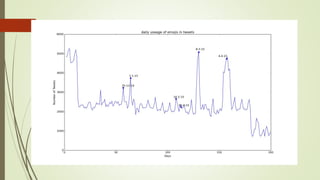
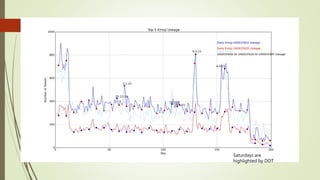
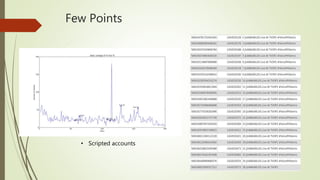
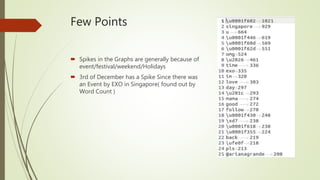
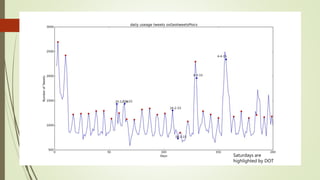
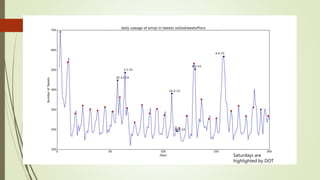
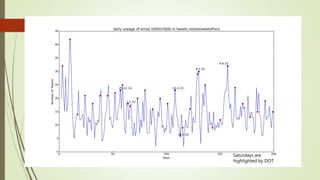
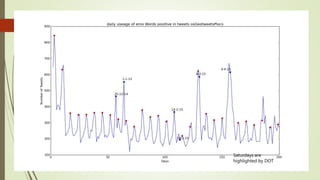
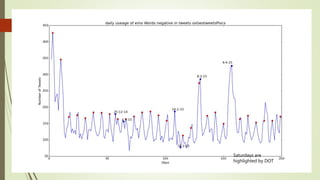
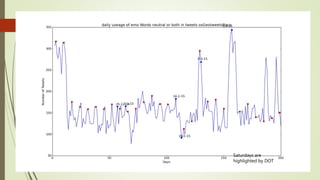
![Unexplained Spikes in Graph
There are few days where higher
number of tweets per day go
unexplained.(8-3-15)
Tried word counter around 8-3-15
date and used stop words from
mysql.com
Found some other issue.
2nd place is taken by the letter @
@ and # tags are generally imp tags
@[total] 39.2%
@[space] 11.5%
@[nospace] 27.7%
Day around 8th March Day around 13th March](https://image.slidesharecdn.com/588fa011-88c4-4011-92ab-6c6a00e1bd1c-170115172638/85/Internship-44-320.jpg)