When dividing variables with like bases, you subtract the exponents; for (45x6y2) / (15x2y), 45/15 = 3, x6-2 = x4, and y2-1 = y, so the division is equal to 3x4y.
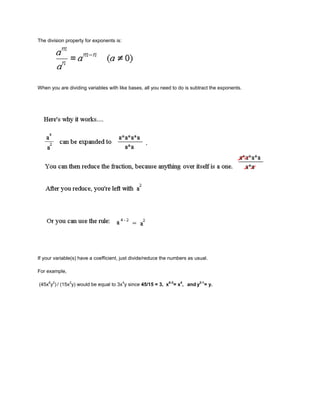
This document reviews key concepts from Unit 1 including: adding, subtracting, multiplying, and dividing integers; order of operations with expressions containing multiple operations; evaluating expressions by substituting values for variables; combining like terms using the distributive property; and determining if proportions are true or false and solving proportions. It provides examples of each concept to practice, with expressions containing integers, variables, operations, and evaluating expressions by substituting numeric values for variables.
The document discusses rules for transforming entity-relationship models (ERMs) into relational schemas and tables. It outlines different relationship types between entity types A, B, and C and how they would be modeled as tables or attributes. Generalization/specialization relationships and triple relationships are also addressed. Transformation is not always unambiguous and different relationship types may be modeled in different ways as tables or attributes in the relational schema.
This document provides a review for a final exam on simplifying rational expressions. It includes examples of simplifying rational expressions by factoring the numerator and denominator and canceling common factors. It also discusses excluded values where the denominator cannot equal zero. Practice problems are provided to simplify rational expressions and identify excluded values. The document emphasizes the importance of factoring, canceling common factors, and paying attention to excluded values when simplifying rational expressions.
This document outlines learning outcomes and topics for a math lesson. The lesson will cover: 1) recognizing and solving linear and quadratic equations using factorization, quadratic formula, and completing the square; 2) solving simultaneous 2x2 systems using substitution and elimination; 3) identifying inequalities and their properties and solving linear and quadratic inequalities; and 4) identifying and solving absolute value equations.
This document discusses vector and parametric equations that describe lines. It provides the following key points:
1) A vector equation of a line passing through a point P1 and parallel to a vector a is defined as P1P2 = t*a, where t is a scalar.
2) The parametric equations of a line parallel to a vector a and passing through a point P1 are x = x1 + t*a1 and y = y1 + t*a2, where t is any real number.
3) Each value of t in the parametric equations establishes a point (x,y) on the line. Setting the independent variable t equal in both equations allows
This document provides instructions on graphing polynomial functions. It discusses identifying the roots, x-intercepts, and y-intercept from the factored form of the polynomial. It shows working through an example of graphing the function y = (x – 2)(x – 1)(x + 3). The key steps are:
1. Identify the roots and y-intercept
2. Arrange the roots in a table
3. Complete the table by calculating y-values for different x-values
4. Plot the points on a graph
5. Sketch the graph
The document provides an overview of the simplex method for solving linear programming problems with more than two decision variables. It describes key concepts like slack variables, surplus variables, basic feasible solutions, degenerate and non-degenerate solutions, and using tableau steps to arrive at an optimal solution. Examples are provided to illustrate setting up and solving problems using the simplex method.
The document discusses the simplex method for solving linear programming problems with more than two decision variables. It provides explanations of key concepts used in the simplex method such as slack variables, basic and non-basic variables, and the steps to set up and solve a simplex table. As an example, it applies the simplex method to solve a linear programming problem about maximizing profit for a furniture company by determining the optimal number of chairs and tables to produce.
This document discusses transformations of parent functions. It defines a parent function as the simplest form of a function, such as y=x, y=x^2, etc. Transformations include horizontal and vertical shifts which move the graph left, right, up or down; stretches which multiply the y-values making the graph skinnier; shrinks which reduce the y-values making the graph fatter; and reflections which flip the graph over the x-axis. Examples are provided to demonstrate how to graph different transformations of common parent functions. The document concludes by describing the transformation y=4x-2-5 as a shrink by a factor of 4, a right shift of 2 units, and a down shift of 5
Globalization has significantly impacted higher education by increasing opportunities for internationalization. Universities now recruit more international students, collaborate on research globally, and offer study abroad programs to give students international experience. This course will examine how higher education institutions can develop strategies to internationalize their campuses and curriculum to prepare students for success in a globalized world.
Parent functions are families of graphs that share unique properties. Transformations can move the graph around the plane. The main parent functions explored are the constant, linear, absolute value, quadratic, cubic, square root, cubic root, and exponential functions. Each has a characteristic shape and number of intercepts. Domains and ranges depend on the specific function but often extend to positive and negative infinity.
This document defines polynomial functions and discusses their key properties. It defines polynomials as expressions with real number coefficients and positive integer exponents. Examples of polynomials and non-polynomials are provided. The document discusses defining polynomials by degree or number of terms, and classifying specific polynomials. It covers finding zeros of polynomial functions and their multiplicities. The document also addresses end behavior of polynomials based on the leading coefficient and degree. It provides an example of analyzing a polynomial function by defining it, finding zeros and multiplicities, describing end behavior, and sketching its graph.
The document provides information about functions and relations. It defines a function as a relation where each x-value is paired with exactly one y-value. To determine if a relation is a function, it describes using the vertical line test, where a relation is a function if a vertical line can only intersect the graph at one point. It gives examples of applying the vertical line test to graphs and determining the domain and range of relations.
This document discusses solving systems of equations and inequalities through three main methods: graphing, substitution, and elimination. It provides examples of each method. For graphing systems, it explains the three possibilities for the graphs: consistent systems with one solution where the lines intersect, inconsistent systems with no solution where the lines are parallel, and dependent systems with infinite solutions where the lines coincide. It then works through examples of using substitution and elimination to solve systems algebraically. [/SUMMARY]
The document discusses relations, functions, domains, and ranges. It defines a relation as a set of ordered pairs and a function as a relation where each x-value is mapped to only one y-value. It explains how to identify the domain and range of a relation, and use the vertical line test and mappings to determine if a relation is a function. Examples of evaluating functions are also provided.
Multiplying Polynomials (no conjugates)toni dimella
This document discusses techniques for multiplying polynomials including FOIL, the double distributive property, and squaring binomials. It provides examples of squaring binomial expressions like (x + 3)2 by multiplying (x + 3) by itself using FOIL. The document also lists more example problems but does not show the solutions.
This document defines decimals, fractions, and percents and provides steps for converting between them. Decimals are numbers with a decimal point, fractions show parts of a whole, and percents express amounts out of 100. To convert a fraction to a decimal, divide the numerator by the denominator. To convert a fraction to a percent, change it to a decimal then multiply by 100. Converting between other forms follows similar steps of changing the number to an equivalent decimal or percent value.
This document contains lecture slides about statistics for describing, exploring, and comparing data. It discusses measures of center such as the mean, median, and mode. It also discusses variance and standard deviation as measures of spread. Additional topics covered include finding the mode, determining if a value is unusually high or low based on the mean and standard deviation, calculating percentiles, and comparing the detail provided by different graphic displays of data.
The document contains multiple choice questions about summarizing and graphing data. It asks questions about outliers, frequency distributions, class boundaries, histograms, and types of charts including pie charts. One question asks the reader to use a pie chart showing housing types to find the number of people living in single family housing in a town of 12,200 people.
The document contains lecture slides on introductory statistics topics including definitions of population, quantitative vs qualitative data, types of measurement scales, and examples of different sampling methods and study designs. Key points covered are the definition of a population as the complete collection of all elements, examples of quantitative data like weights vs qualitative nominal categories, ordinal scales involving ranking, and retrospective study designs using existing historical data.
This document contains 16 logic and critical thinking problems involving statements, truth tables, logic symbols, validity of arguments, and Euler diagrams. The problems cover topics such as determining logical equivalences, constructing and analyzing truth tables, identifying inverse, converse and contrapositive statements, and determining the validity of arguments using logic rules or diagrams.
This document contains 16 logic and critical thinking problems involving statements, truth tables, logic symbols, validity of arguments, and Euler diagrams. The problems cover topics such as determining logical equivalence, constructing and analyzing truth tables, identifying inverse, converse and contrapositive statements, and determining the validity of arguments using logic rules or diagrams.
The document introduces logarithms, defining them as the exponent that a fixed number (the base) must be raised to to equal the value. It provides examples of converting between logarithmic and exponential forms, and covers the key properties of logarithms including product, quotient, power, expanding, condensing, and the change of base formula.
The document introduces logarithms, defining them as the exponent that a base number must be raised to to equal the value. It provides examples of converting between logarithmic and exponential forms, and discusses properties of logarithms such as the product, quotient, and power properties. It also covers expanding, condensing, and changing the base of logarithmic expressions.
This document discusses polynomial functions and how to graph them. It defines a polynomial as a sum of terms with non-negative integer exponents. Polynomial graphs are smooth curves that may be lines, parabolas, or higher-order curves. To graph a polynomial, one determines the end behavior from the leading term, finds the x-intercepts by setting the polynomial equal to 0, and uses intercepts and test points to plot the graph over intervals. Multiplicity of roots affects whether the graph crosses or is tangent to the x-axis at those points.
The document explains how to solve quadratic equations by completing the square. It defines a perfect square trinomial as having the form x^2 + bx + c, where c is the square of half of b. It provides steps for completing the square, which involves adding a constant term to both sides of the equation such that the left side becomes a perfect square trinomial that can be factorized. This process results in the solution(s) to the quadratic equation. Two examples demonstrating this process are included.
The document discusses graphing quadratic functions in standard form (y=ax^2 + bx + c). It explains that the graph is a parabola that can open up or down depending on whether a is positive or negative. The line of symmetry for the parabola passes through the vertex and is given by the equation x=-b/2a. The steps to graph are: 1) find the line of symmetry, 2) plug the x-value into the original equation to find the vertex, 3) find two other points and reflect them across the line of symmetry.
Composite functions are formed by taking the output of one function and using it as the input of another function. This is shown notationally as f(g(x)), where the result of g(x) is used as the input for f. Changing the order of the functions changes the result, as the output of the inner function determines the input to the outer function. Examples show evaluating composite functions by substituting the output of the inner function into the outer function and simplifying.
Salesforce Integration for Bonterra Impact Management (fka Social Solutions A...Jeffrey Haguewood
Sidekick Solutions uses Bonterra Impact Management (fka Social Solutions Apricot) and automation solutions to integrate data for business workflows.
We believe integration and automation are essential to user experience and the promise of efficient work through technology. Automation is the critical ingredient to realizing that full vision. We develop integration products and services for Bonterra Case Management software to support the deployment of automations for a variety of use cases.
This video focuses on integration of Salesforce with Bonterra Impact Management.
Interested in deploying an integration with Salesforce for Bonterra Impact Management? Contact us at sales@sidekicksolutionsllc.com to discuss next steps.
leewayhertz.com-AI in predictive maintenance Use cases technologies benefits ...alexjohnson7307
Predictive maintenance is a proactive approach that anticipates equipment failures before they happen. At the forefront of this innovative strategy is Artificial Intelligence (AI), which brings unprecedented precision and efficiency. AI in predictive maintenance is transforming industries by reducing downtime, minimizing costs, and enhancing productivity.
Dandelion Hashtable: beyond billion requests per second on a commodity serverAntonios Katsarakis
This slide deck presents DLHT, a concurrent in-memory hashtable. Despite efforts to optimize hashtables, that go as far as sacrificing core functionality, state-of-the-art designs still incur multiple memory accesses per request and block request processing in three cases. First, most hashtables block while waiting for data to be retrieved from memory. Second, open-addressing designs, which represent the current state-of-the-art, either cannot free index slots on deletes or must block all requests to do so. Third, index resizes block every request until all objects are copied to the new index. Defying folklore wisdom, DLHT forgoes open-addressing and adopts a fully-featured and memory-aware closed-addressing design based on bounded cache-line-chaining. This design offers lock-free index operations and deletes that free slots instantly, (2) completes most requests with a single memory access, (3) utilizes software prefetching to hide memory latencies, and (4) employs a novel non-blocking and parallel resizing. In a commodity server and a memory-resident workload, DLHT surpasses 1.6B requests per second and provides 3.5x (12x) the throughput of the state-of-the-art closed-addressing (open-addressing) resizable hashtable on Gets (Deletes).
Building Production Ready Search Pipelines with Spark and MilvusZilliz
Spark is the widely used ETL tool for processing, indexing and ingesting data to serving stack for search. Milvus is the production-ready open-source vector database. In this talk we will show how to use Spark to process unstructured data to extract vector representations, and push the vectors to Milvus vector database for search serving.
A Comprehensive Guide to DeFi Development Services in 2024Intelisync
DeFi represents a paradigm shift in the financial industry. Instead of relying on traditional, centralized institutions like banks, DeFi leverages blockchain technology to create a decentralized network of financial services. This means that financial transactions can occur directly between parties, without intermediaries, using smart contracts on platforms like Ethereum.
In 2024, we are witnessing an explosion of new DeFi projects and protocols, each pushing the boundaries of what’s possible in finance.
In summary, DeFi in 2024 is not just a trend; it’s a revolution that democratizes finance, enhances security and transparency, and fosters continuous innovation. As we proceed through this presentation, we'll explore the various components and services of DeFi in detail, shedding light on how they are transforming the financial landscape.
At Intelisync, we specialize in providing comprehensive DeFi development services tailored to meet the unique needs of our clients. From smart contract development to dApp creation and security audits, we ensure that your DeFi project is built with innovation, security, and scalability in mind. Trust Intelisync to guide you through the intricate landscape of decentralized finance and unlock the full potential of blockchain technology.
Ready to take your DeFi project to the next level? Partner with Intelisync for expert DeFi development services today!
Best 20 SEO Techniques To Improve Website Visibility In SERPPixlogix Infotech
Boost your website's visibility with proven SEO techniques! Our latest blog dives into essential strategies to enhance your online presence, increase traffic, and rank higher on search engines. From keyword optimization to quality content creation, learn how to make your site stand out in the crowded digital landscape. Discover actionable tips and expert insights to elevate your SEO game.
Have you ever been confused by the myriad of choices offered by AWS for hosting a website or an API?
Lambda, Elastic Beanstalk, Lightsail, Amplify, S3 (and more!) can each host websites + APIs. But which one should we choose?
Which one is cheapest? Which one is fastest? Which one will scale to meet our needs?
Join me in this session as we dive into each AWS hosting service to determine which one is best for your scenario and explain why!
Generating privacy-protected synthetic data using Secludy and MilvusZilliz
During this demo, the founders of Secludy will demonstrate how their system utilizes Milvus to store and manipulate embeddings for generating privacy-protected synthetic data. Their approach not only maintains the confidentiality of the original data but also enhances the utility and scalability of LLMs under privacy constraints. Attendees, including machine learning engineers, data scientists, and data managers, will witness first-hand how Secludy's integration with Milvus empowers organizations to harness the power of LLMs securely and efficiently.
HCL Notes and Domino License Cost Reduction in the World of DLAUpanagenda
Webinar Recording: https://www.panagenda.com/webinars/hcl-notes-and-domino-license-cost-reduction-in-the-world-of-dlau/
The introduction of DLAU and the CCB & CCX licensing model caused quite a stir in the HCL community. As a Notes and Domino customer, you may have faced challenges with unexpected user counts and license costs. You probably have questions on how this new licensing approach works and how to benefit from it. Most importantly, you likely have budget constraints and want to save money where possible. Don’t worry, we can help with all of this!
We’ll show you how to fix common misconfigurations that cause higher-than-expected user counts, and how to identify accounts which you can deactivate to save money. There are also frequent patterns that can cause unnecessary cost, like using a person document instead of a mail-in for shared mailboxes. We’ll provide examples and solutions for those as well. And naturally we’ll explain the new licensing model.
Join HCL Ambassador Marc Thomas in this webinar with a special guest appearance from Franz Walder. It will give you the tools and know-how to stay on top of what is going on with Domino licensing. You will be able lower your cost through an optimized configuration and keep it low going forward.
These topics will be covered
- Reducing license cost by finding and fixing misconfigurations and superfluous accounts
- How do CCB and CCX licenses really work?
- Understanding the DLAU tool and how to best utilize it
- Tips for common problem areas, like team mailboxes, functional/test users, etc
- Practical examples and best practices to implement right away
GraphRAG for Life Science to increase LLM accuracyTomaz Bratanic
GraphRAG for life science domain, where you retriever information from biomedical knowledge graphs using LLMs to increase the accuracy and performance of generated answers
Ivanti’s Patch Tuesday breakdown goes beyond patching your applications and brings you the intelligence and guidance needed to prioritize where to focus your attention first. Catch early analysis on our Ivanti blog, then join industry expert Chris Goettl for the Patch Tuesday Webinar Event. There we’ll do a deep dive into each of the bulletins and give guidance on the risks associated with the newly-identified vulnerabilities.
1. The division property for exponents is: When you are dividing variables with like bases, all you need to do is subtract the exponents. If your variable(s) have a coefficient, just divide/reduce the numbers as usual.For example, (45x6y2) / (15x2y) would be equal to 3x4y since 45/15 = 3, x6-2= x4, and y2-1= y.<br />