Advertiser List Lna2007
•
0 likes•189 views

This document provides an overview and analysis of advertising spending by the top 100 leading national advertisers in the United States in 2006 and 2007. Some key points: - Total ad spending by the top 100 advertisers rose 3.1% to a record $104.8 billion in 2006, with most growth coming from unmeasured media like direct marketing and digital communications. - Measured media like TV, print and internet advertising accounted for 58.2% of spending, down from 59.6% in 2005, as major advertisers extended their reach through unmeasured channels. - Procter & Gamble was the top advertiser for the 50th time, increasing spending 6.8% to $4.

Recommended
More Related Content
Similar to Advertiser List Lna2007
Similar to Advertiser List Lna2007 (20)
More from Social Media Automotive Marketing
More from Social Media Automotive Marketing (20)
Recently uploaded
Recently uploaded (20)
Advertiser List Lna2007
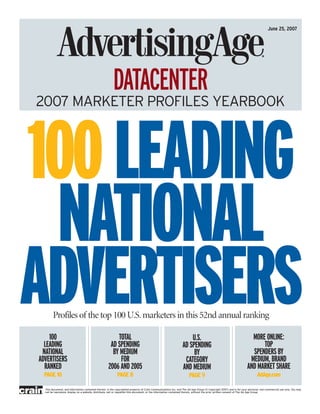
- 1. June 25, 2007 DATACENTER 2007 AGENCY PROFILES YEARBOOK DATACENTER 2007 MARKETER PROFILES YEARBOOK 100 LEADING NATIONAL ADVERTISERS 100 Profiles of the top 100 U.S. marketers in this 52nd annual ranking TOTAL U.S. MORE ONLINE: LEADING AD SPENDING AD SPENDING TOP NATIONAL BY MEDIUM BY SPENDERS BY ADVERTISERS FOR CATEGORY MEDIUM, BRAND RANKED 2006 AND 2005 AND MEDIUM AND MARKET SHARE PAGE 10 PAGE 8 PAGE 9 AdAge.com This document, and information contained therein, is the copyrighted property of Crain Communications Inc. and The Ad Age Group (© Copyright 2007) and is for your personal, non-commercial use only. You may not be reproduce, display on a website, distribute, sell or republish this document, or the information contained therein, without the prior written consent of The Ad Age Group.
- 2. FACTS. JUST THE FACTS. DIGITAL MARKETING HISPANIC FACT PACK SEARCH MARKETING FACT PACK All the usable data and stats FACT PACK Critical data on new media marketers need to tap this The latest data on the sites, tools options – blogs, podcasts, booming market. Advertise and options available to turn streaming video, texting, video your brand’s own unique reach consumer searches into sales. games and more – and the among Hispanics. STILL TIME TO PLACE YOUR AD. consumers that use them. Advertise your search tools Perfect for marketers looking and capabilities to capture your to get on top of their game in share of this business. Closes the digital arena. September 19. TO GET YOUR OWN COPY OF THESE FACT PACKS Call 888-288-5900 or e-mail subs@crain.com TO ADVERTISE Suzanne Hermalyn, Tel: 508.497.8688. E-mail: shermalyn@adage.com © 2007 Crain Communications Inc. ADAGE.COM
- 3. 3 | Advertising Age | June 25, 2007 DATACENTER 100 LEADING NATIONAL ADVERTISERS: MARKETER PROFILES YEARBOOK WHAT’S INSIDE THE YEARBOOK TO REACH US WELCOME TO THE 2007 Marketer Profiles AD SPENDING BY MEDIA ONLINE Yearbook. This yearbook is a companion to CLICK to get daily marketing news Detailed table of measured U.S. spending Advertising Age’s 52nd annual 100 from AdAge.com by media. This chart is a compilation of Leading National Advertisers report pub- media spending from 18 media types lished in print and on AdAge.com on June CLICK for AdAge.com’s Customer monitored by TNS Media Intelligence as 25, 2007. Service page well as freestanding insert data from Inside this yearbook, you’ll find TNS’s Marx Promotion Intelligence; plus detailed profiles of the 100 LNA compa- unmeasured spending estimates both for nies including ad spending broken down by media and brands; listings of manage- the Top 100 advertisers and all U.S. adver- E-MAIL tisers. For questions about this report, ment and marketing executives; a tally of Page 8 agencies and key agency executives; and e-mail DataCenter@adage.com financial results. For general editorial information, Want to know more about agencies AD SPENDING BY CATEGORY write to edit@adage.com that work for the 100 LNA? Download Detailed table of measured spending by the 2007 Agency Profiles Yearbook, a 100- category. This chart breaks out measured media by 29 ad categories using TNS’s plus-page PDF book available free in the Stradegy data, from automotive at $19.8 SUBSCRIPTION/SINGLE COPY SALES DataCenter at AdAge.com. 1-888-288-5900; Advertising (212) billion to cigarettes & tobacco at $156 210-0159; Library services (312) 649- million. Inside Page 9 5476, (312) 649-5329 ANALYSIS LNA RANKING Top 100 spending in perspective. LNA NEWS OFFICES Leading National Advertisers ranked spending in 2006 rose 3.1% to $105 bil- New York (212) 210-0100; Chicago from 1 to 100. The list covers marketers lion. (312) 649-5200; Detroit (313) 446- Page 4 from No. 1 Procter & Gamble ($4.9 bil- lion) to No. 100 State Farm ($338 mil- 6000, Los Angeles (323) 370-2400; San lion). Forty marketers on the list have Francisco (415) 538-0200; Washington AD SPENDING, 2000-2007 U.S. measured plus unmeasured ad totals (202) 662-7200 The boom of 2000, bust of 2001 and above $1 billion. uneven recovery that followed. Page 10 Page 5 STAFF FOR THIS REPORT Bradley Johnson, director of data MARKETER PROFILES 100 LEADERS OVER 50 YEARS Detailed profiles of the 100 LNA, alpha- analytics Kevin Brown, group data manager How the ad market has changed since betically from Abbott Laboratories to Maureen Morrison, research editor 1956. Yum Brands. Maura Wall, research coordinator Page 5 Page 12 Jess D’Amico, Katy Gallagher, Ezekiel Garnett, research assistants SLICES OF THE AD SPENDING PIE METHODOLOGY Vicky Perlman, information services Summary of measured media spending How the Ad Age DataCenter calculated coordinator by media and category. the 100 LNA. Mike Ryan, special reports editor Page 7 Page 8
- 4. 4 | Advertising Age | June 25, 2007 DATACENTER 100 LEADING NATIONAL ADVERTISERS: MARKETER PROFILES YEARBOOK TOP 100 SPENDING UP 3.1% TO $105 BILLION BIG SHIFT: Traditional media feel the pinch as No.1 P&G and other marketers extend their reach via internet,promotions By BRADLEY JOHNSON the internet and to trial activity [i.e., product a notch to third place in the LNA ranking. bjohnson@adage.com sampling].” Mr. Lafley said P&G will put a AT&T grabbed the No. 2 slot as its estimat- big emphasis on such “nonmeasured media” ed spending jumped 26% to about $3.3 bil- the top 100 U.S. advertisers last year in the fiscal year beginning July 1. lion. The company spent heavily to rebrand increased ad spending by a modest 3.1% to a The shift from measured media mirrors SBC as AT&T. record $104.8 billion. But most of that what’s happening in the agency business. The top advertiser is no surprise: Procter growth came from “unmeasured” disci- Since 2005, U.S. marketing-communications & Gamble, whose estimated spending last plines. In a troubling sign for traditional agencies have generated more revenue from year rose 6.8% to $4.9 billion. P&G has been media, the marketing leaders increased marketing services than from traditional No. 1 or No. 2 for 50 of the 52 years that Ad measured media spending by just 0.6%, the advertising and media, according to Ad Age’s Age has ranked Leading National smallest gain since the 2001 recession. DataCenter (AA, June 11). Omnicom Group, Advertisers. P&G, following its 2005 Gillette Media measured by ad-tracking servic- the world’s largest marketing organization, acquisition, now appears to have a lock on es—such as TV, print and some forms of generated 57% of its revenue last quarter No. 1; its ’06 estimated spending was 46% internet advertising—accounted for 58.2% from marketing services. higher than that of No. 2 AT&T. of these top marketers’ U.S. ad spending, The nation’s top 100 advertisers last year down from 59.6% in 2005, according to MAJORITY BOOST SPENDING accounted for 41% of U.S. measured spend- Advertising Age’s 52nd annual 100 Leading Sixty-nine of the 100 marketers disclosed ing.Their share varies by medium:The com- National Advertisers report. worldwide ad spending in their annual panies accounted for 67% of network TV The rest of the spending came from reports. They define “advertising” different- advertising but only 34% of measured inter- unmeasured disciplines, primarily marketing ly—some include only media spending, while net advertising. services such as direct marketing, sales pro- others factor in promotion—but the figures The marketing leaders drive some ad cat- motion and digital communications (includ- provide a useful indicator of global spending egories. Measured spending in the biggest ad ing unmeasured forms of internet media trends. Among these companies, stated category, automotive, fell 5.7% or $1.2 bil- such as paid search). worldwide ad spending last year increased lion, reflecting a pullback in Detroit. Exhibit A: Procter & Gamble Co., the No. 3.5%, and revenue increased 7.3%. Telecom, the No. 3 category, rose 9.6% or 1 advertiser. Ad Age estimates that P&G’s As for U.S. advertising, 69 of the 100 $959 million. Last year’s three most-adver- unmeasured U.S. spending last year rose LNA companies increased combined meas- tised brands were all telecoms: 15% vs. a 3.9% increase in measured media. ured/unmeasured U.S. ad spending last year; AT&T/Cingular, Verizon and Sprint. The package-goods giant’s shift toward 75 of the 100 increased measured media This year will be tougher. In the first unmeasured disciplines continues. The mar- spending. quarter, six of the top 10 U.S. advertisers cut keter’s first-quarter measured spending fell On Ad Age’s list, the biggest cut in U.S. spending, according to TNS. This month, 8.6%, according to TNS Media Intelligence. spending came at General Motors Corp., TNS cut its full-year U.S. ad growth forecast P&G Chairman-CEO A.G. Lafley Jr. last down a whopping $814 million or 19.8%. from 2.6% to 1.7%, the worst since 2001. month told analysts: “If you step back and GM reduced spending for each of its brands, That’s bad news for traditional media. But look at our [marketing] mix across most of but its big spending cut reflected a pullback in there should be more opportunities for disci- the major brands, it’s clearly shifting, and it’s corporate advertising. plines unmeasured by ad trackers. Just ask shifting from measured media to in-store, to GM’s ad cuts moved the automaker down P&G.
- 5. 5 | Advertising Age | June 25, 2007 DATACENTER 100 LEADING NATIONAL ADVERTISERS: MARKETER PROFILES YEARBOOK ADVERTISING SPENDING, 2000-2007 Ad-spending growth since the boom of 2000, bust of 2001 and the uneven recovery 100 LEADERS OVER 50 YEARS How ad spending for 100 Leading National Advertisers and overall U.S. spending has changed since 1956 100 LEADING NATIONAL ADVERTISERS MEASURED MEDIA (TNS) % CHG. 2006 1956 10% 5 100 LNA $2.1B TOTAL SPENDING $105B ($15.4B, adj. 0 for inflation) -5 N/A 1. P&G 1. GM TOP THREE 2. AT&T -10 2. P&G ’00 ’01 ’02 ’03 ’04 ’05 ’06 ’07 3. GM 3. FORD TOTAL SPENDING % CHG. (MEAS. + UNMEAS.) 10% PROCTER & GAMBLE U.S. $93M AD SPENDING $4.9B ($689M, adj. 5 for inflation) 0 COMPANIES THAT MADE 100 -5 LNA IN BOTH 19 19 ’56 AND ’06 N/A -10 ’00 ’01 ’02 ’03 ’04 ’05 ’06 ’07 TOTAL U.S. $9.9B Sources: TNS Media Intelligence, Ad Age DataCenter ADVERTISING $285.1B ($73.5B, adj. (COEN) for inflation) U.S. ADVERTISING MEASURED MEDIA SPENDING % CHG. (TNS) 100 LNA 15% SHARE OF TOTAL 37% 21% 10 U.S. ADVERTISING 5 U.S. $59 0 AD SPENDING $952 ($435, adj. PER CAPITA for inflation) -5 -10 ’00 ’01 ’02 ’03 ’04 ’05 ’06 1 ’072 U.S. AD SPENDING 2.2% 2.3% TOTAL U.S.: MEDIA + DIRECT MAIL % CHG. (COEN) AS % OF GDP 15% 10 U.S. AD SPENDING 5 AS % OF WORLD 48% 69% SPENDING 0 -5 U.S. POPULATION -10 AS % OF WORLD POPULATION 5% 6% ’00 ’01 ’02 ’03 ’04 ’05 ’06 ’07 2 1. Revised to 3.8% from 4.1%. 2. Forecast (TNS from June ’07; Coen from Dec. ’06). Sources: Ad Age DataCenter, Universal McCann’s Robert J. Coen, Sources: TNS Media Intelligence, Ad Age DataCenter, Universal McCann's Robert J. Coen Census Bureau, Bureau of Economic Analysis
- 6. STOP. SUBSCRIBE. SUCCEED. Advertising Age is the crucial source for news about advertising, marketing, and branding – and the tool used by more professionals to get to the top (and stay there!) than any other publication. See for yourself why. Subscribe and get 51 issues for only $69.95 — a 65% savings off the cover price. You’ll also get 24/7 online access, podcasts, e-mail updates, and more. Go to www.adage.com/LNASUB7.
- 7. 7 | Advertising Age | June 25, 2007 DATACENTER 100 LEADING NATIONAL ADVERTISERS: MARKETER PROFILES YEARBOOK HOW $150B IN SPENDING WAS SPLIT BY MEDIA... U.S. measured media spending—for all advertisers including the 100 LNA—grew 3.8% to $149.7 billion in 2006 according to TNS. Winner: internet (up 17.3%). Loser: local newspapers (down 3.1%) INTERNET $9.76B OUTDOOR $3.83B 2.6% 6.5% RADIO $11.06B 19.9% 7.4% MAGAZINE $29.83B CABLE TV NETWORKS $16.75B 11.2% 19.9% NEWSPAPER$29.80B SYNDICATED TV $4.24B 2.8% 11.5% SPOT TV$17.23B 18.1% NETWORK TV $27.16B Source: TNS Media Intelligence. Numbers rounded. More info: tns-mi.com This pie chart aggregates TNS’ 18 measured media as follows: Magazine includes consumer magazine, Sunday magazine, local magazine, Spanish-language magazine and business publication; newspaper includes national, local and Spanish-language newspaper; radio includes network, national spot and local. Internet excludes paid search and broadband video. See Page 8 for methodology. ...AND BY ADVERTISING CATEGORY Automotive again led all categories in media spending, but spending dropped 5.7% from $21 billion in 2005 1.AUTOMOTIVE $19.80B 13.2% 33.1% 12.8% OTHER $48.49B 2.RETAIL $19.11B 7.3% 3. TELECOM$10.95B 6.1% 3.6% 3.6% 10. MOVIES, RECORDED 4.MEDICINE & REMEDIES$9.19B 5.8% VIDEO & MUSIC $5.38B 5.8% 4.8% 3.8 % 5. GENERAL SERVICES$8.70B 9. AIRLINES, HOTELS & 6.FINANCIAL SERVICES $8.69B CAR RENTALS $5.42B 7. FOOD, BEVERAGES & CANDY$7.23B 8.PERSONAL CARE$5.73B Source: TNS Media Intelligence. Numbers rounded. More info: tns-mi.com Data include 18 measured media: broadcast network, spot, syndicated and Spanish-language TV; cable TV networks; national spot, network and local radio; consumermagazine, Sunday magazine, local magazine, Spanish-language magazine and business publication; national, local and Spanish-language newspaper; outdoor and internet (excluding paid search and broadcast video). Telecom includes ISPs and advertising for internet sites and services. Categories aggregated by Ad Age. See Page 8 for methodology.
- 8. 8 | Advertising Age | June 25, 2007 DATACENTER 100 LEADING NATIONAL ADVERTISERS: MARKETER PROFILES YEARBOOK DOMESTIC ADVERTISING SPENDING TOTALS BY MEDIUM Ranked by total U.S ad spending in 2006 ALL U.S. ADVERTISING SPENDING FROM TNS ADVERTISING EXPENDITURES MEDIUM AS % OF TOTAL COEN’S U.S. TOTALS* MEDIA 2006 2005 % CHG 2006 2005 2006 2005 % CHG Magazine $23,346 $22,311 4.6 8.2 8.2 $13,425 $12,847 4.5 Sunday magazine 1,881 1,739 8.2 0.7 0.6 NA NA NA Business publication 4,145 4,260 -2.7 1.5 1.6 4,320 4,170 3.6 Local magazine 462 428 7.9 0.2 0.2 NA NA NA National newspaper 3,539 3,428 3.2 1.2 1.3 7,241 7,465 -3.0 Local newspaper 24,433 25,218 -3.1 8.6 9.3 40,468 39,870 1.5 FSI 1,828 1,817 0.6 0.6 0.7 NA NA NA Network TV 25,900 25,033 3.5 9.1 9.2 16,934 16,128 5.0 Spot TV 18,492 16,651 11.1 6.5 6.1 26,117 24,300 7.5 Syndicated TV 4,235 4,223 0.3 1.5 1.6 4,080 3,865 5.6 Cable TV network 16,746 16,197 3.4 5.9 6.0 19,119 18,296 4.5 Network radio 1,005 1,010 -0.5 0.4 0.4 NA NA NA National spot radio 2,695 2,604 3.5 0.9 1.0 4,411 3,469 27.2 Local radio 7,355 7,404 -0.7 2.6 2.7 15,203 15,357 -1.0 Outdoor 3,831 3,529 8.6 1.3 1.3 6,615 6,232 6.1 Direct mail NA NA NA 0.0 0.0 59,912 55,218 8.5 Internet 9,756 8,318 17.3 3.4 3.1 9,705 7,764 25.0 Measured 149,649 144,170 3.8 52.5 53.2 227,550 214,981 5.8 Unmeasured 135,457 126,930 6.7 47.5 46.8 57,556 56,119 2.6 Total U.S. 285,106 271,100 5.2 100.0 100.0 285,106 271,100 5.2 Notes: Dollars are in millions. Media expenditures by medium from TNS Media Intelligence. Magazines include Spanish-language magazines. Newspapers include Spanish-language newspapers. Network TV includes Spanish-language TV networks. Spot TV includes Snapish-language Spot TV. The total for ALL U.S. ADVERTISING media expenditures ($285.1 billion) is from Robert J. Coen’s media analysis at Universal McCann. *The ALL U.S. ADVERTISING unmeasured is the Coen total minus the TNS total media. search and broadband video). reflect a U.S.-only percentage. METHODOLOGY Radio: local radio (500 stations in 28 top markets); national spot radio (4,000 stations MERGERS & JOINT VENTURES in 225-plus markets); network radio (4). Brands and companies that the Leaders THE 100 LEADING NATIONAL Advertisers are Magazines: consumer magazines (350- acquire or divest are treated pro forma in this selected from the 300 largest national adver- plus); Sunday magazines (5); local magazines report, as if the deals occurred at the begin- tisers based on measured U.S. media spend- (30); B-to-B titles (480). ning of a company’s previous fiscal year ing. That group is pared to 100 after estimat- Newspapers: local papers (250); national (2005). Media spending for those brands or ed unmeasured expenditures are added. papers (NYT, USA, WSJ); Spanish newspa- units is folded into or removed from a Leader pers (65). for two consecutive years (2005 and 2006). MEASURED MEDIA Outdoor (200-plus markets). A Leader must own more than 50% of a Measured media advertising is estimated product or unit for that product or unit’s U.S. spending across 19 media. It consists of UNMEASURED SPENDING media to be consolidated with the Leader. 18 media tracked by TNS Media Intelligence Unmeasured spending is an Ad Age Joint ventures with 50/50 ownership are (tns-mi.com) in its Stradegy product plus DataCenter estimate that includes direct treated as standalone properties by Ad Age. freestanding inserts tracked by TNS’s Marx marketing, sales promotion, co-op spending, Sony, for example, is not credited with ad Promotion Intelligence (tnsmi-marx.com). coupons, catalogs, product placement, special spending for Sony BMG Music Measured media include: events and unmeasured forms of internet Entertainment and Sony Ericsson Mobile TV: network TV (ABC, CBS, Fox, NBC, media (such as paid search). Essentially, Communications, two such ventures. CW, MyNetwork); cable networks (52); spot unmeasured is the difference between a com- TV (600 English, 35 Spanish stations in 100 pany’s measured media (from TNS) and its TOP BRANDS markets); syndicated TV; Spanish TV net- total ad costs (either reported by the compa- Ad Age determined the top 200 brands by works (Telefutura, Telemundo, Univision). ny or estimated by Ad Age). A company’s aggregating measured spending for all prod- Internet (2,500-plus sites; excludes paid reported ad costs are weighted by Ad Age to ucts or services that fall under that brand.
- 9. 9 | Advertising Age | June 25, 2007 DATACENTER 100 LEADING NATIONAL ADVERTISERS: MARKETER PROFILES YEARBOOK DOMESTIC ADVERTISING SPENDING BY CATEGORY Ranked by total U.S ad spending in 2006 RANK MEASURED MEDIA U.S. MEASURED MEDIA BREAKOUT FOR 2006 ‘06 ‘05 CATEGORY 2006 % CHG MAGAZINE NEWSPAPER OUTDOOR TV CABLE NETS RADIO INTERNET 1 1 Automotive $19,799.0 -5.7 $2,174.7 $5,024.5 $343.8 $8,637.0 $1,348.0 $1,543.8 $727.2 2 2 Retail 19,114.0 2.0 2,097.9 6,763.2 387.4 5,420.0 1,039.7 2,148.4 1,257.5 3 3 Telecommunications 10,950.2 9.6 898.7 2,172.6 278.4 4,061.7 1,269.7 774.6 1,494.7 4 5 Medicine & remedies 9,192.9 9.0 2,786.5 279.5 22.7 4,038.7 1,382.0 304.1 379.3 5 6 General services 8,702.0 10.4 1,033.6 2,270.8 583.5 2,302.9 454.2 1,319.5 737.7 6 4 Financial services 8,689.0 2.1 1,188.9 1,891.3 245.2 2,224.3 932.3 725.0 1,481.9 7 7 Food, beverages & candy 7,225.0 -1.2 1,997.2 50.3 76.5 3,190.2 1,450.8 326.3 133.7 8 8 Personal care 5,732.0 1.2 2,387.6 29.4 13.5 2,345.4 796.7 53.9 105.5 9 10 Airlines, hotels, car rental, travel 5,415.6 -1.3 1,484.1 1,412.9 331.9 876.1 515.4 342.9 452.2 10 9 Movies, recorded video & music 5,379.9 -3.6 317.0 1,028.3 91.8 2,447.1 1,047.4 258.7 189.7 11 11 Restaurants 5,291.5 4.5 134.9 183.8 240.2 3,339.2 810.6 534.2 48.5 12 12 Media 5,050.5 2.5 1,744.1 1,269.0 246.5 266.2 67.2 741.1 716.4 13 16 Government, politics, religion 3,510.6 43.0 386.5 530.1 148.9 1,585.9 238.6 465.0 155.6 14 13 Insurance 3,446.2 19.2 277.6 385.9 113.3 1,499.7 635.0 383.6 151.2 15 15 Real estate 3,132.3 20.3 380.8 1,894.1 258.2 251.9 77.2 138.4 131.7 16 14 Apparel 2,911.7 6.8 2,186.3 59.6 28.7 353.4 223.4 20.8 39.4 17 17 Computers, software 2,509.8 13.5 1,165.9 226.4 49.2 381.7 167.7 62.8 456.0 18 19 Home furnishings 2,213.6 7.6 1,069.7 114.1 17.0 551.6 307.8 68.8 84.6 19 18 Beer, wine & liquor 2,099.9 -4.9 520.2 54.2 163.9 734.4 340.5 225.7 61.0 20 21 Education 1,942.4 8.5 382.3 342.4 74.6 544.8 166.9 157.7 273.7 21 20 Home supplies & cleaners 1,938.0 4.0 367.8 5.8 2.6 978.5 525.9 27.6 29.8 22 22 Toys & games 1,253.4 -2.9 179.6 7.5 3.3 286.9 607.9 8.3 159.9 23 23 Hardware & home building 1,028.3 -1.3 519.5 103.8 8.6 169.1 168.8 32.2 26.3 24 25 Sporting goods 562.3 5.8 376.1 28.2 5.0 86.0 48.1 5.5 13.5 25 24 Gas & oil 524.0 -3.7 112.1 70.1 34.5 149.2 73.6 72.9 11.8 26 26 Pet food & pet care 490.1 -1.0 151.5 3.2 0.1 209.4 98.1 6.6 21.3 27 27 Office equipment 334.2 -8.5 145.1 25.1 2.2 94.1 36.4 20.9 10.4 28 28 Shipping & freight 326.8 -8.9 66.0 14.2 3.2 147.0 41.7 43.4 11.2 29 29 Cigarettes & tobacco 155.6 0.1 109.9 1.6 0.5 31.2 5.7 0.5 6.2 Direct response advertising 6,461.6 5.4 2,486.2 493.7 1.9 1,154.0 2,121.1 69.8 135.0 Miscellaneous 4,306.4 2.0 1,896.6 1,285.2 54.2 356.3 275.2 171.9 266.9 Total 149,688.7 3.6 31,024.6 28,020.8 3,831.2 48,713.9 17,273.5 11,054.8 9,769.9 Notes: Dollars in millions. 2005 ranking represents data compiled in 2007. Table includes 18 measured media from TNS Media services includes credit cards; Food, beverages & confectionery: Beverages, confectionery & snacks, dairy, produce, meat & bakery Intelligence. FSIs are excluded from these totals. goods, prepared foods, ingredients, mixes & seasonings; General Services: Apparel services, business services, beauty shops, doctors, nurses, chiropractors, dentists, hospitals, clinics & medical centers, legal services, rental services, dating services, spectator ABOUT THE MEDIA: Consumer magazine includes Sunday magazine, local magazine, and Spanish-language magazine; radio is sporting events, exterminators, electric & water companies; Personal care: Cosmetics & beauty aids, personal hygiene, hair products, network, national spot and local; newspaper includes national newspaper and Spanish-language newspaper. toiletries, hygienic goods & skin care; Movies, recorded video and music includes DVDs; Direct response advertising includes direct ABOUT THE CATEGORIES: Categories are aggregated from TNS classifications as follows (not comprehensively): Automotive response advertising in all classifications; Airlines, hotel, car rental and travel includes cruise ship travel; Apparel: ready-to-wear, includes dealerships; Retail includes discount department & variety stores, department stores, retail, shopping centers & catalog underclothing & hosiery, jewelry, accessories & footwear; Home furnishings, appliances: household furnishings & accessories, showrooms; Telecom, Internet services and ISP includes telephone companies (both wireless, local and long distance), Internet building materials, equipment & fixtures, appliances, electronics; Home supplies and cleaners: Household soaps, cleansers & polishes, services providers, web designers, communications networks, telephone equipment, and offline internet support; Medicines & laundry soaps, foils, wraps, paper products; Miscellaneous: Aviation (excluding freight), employment recruitment, military and proprietary remedies: Pharmaceutical houses, medicines & proprietary remedies, fitness, eye glasses, medical equipment; Financial government, agriculture, lawn and garden, industrial, luggage, cameras, film.
- 10. 10 | Advertising Age | June 25, 2007 DATACENTER 100 LEADING NATIONAL ADVERTISERS: MARKETER PROFILES YEARBOOK NATIONAL MARKETERS RANKED 1 TO 50 Ranked by total U.S ad spending in 2006 RANK TOTAL U.S. ADVERTISING SPENDING U.S. MEASURED MEDIA SPENDING 2006 2005 MARKETER HEADQUARTERS 2006 2005 % CHG 2006 2005 % CHG 1 1 Procter & Gamble Co. Cincinnati $4,898.0 $4,587.9 6.8 $3,526.5 $3,395.0 3.9 2 5 AT&T San Antonio, Texas 3,344.7 2,653.6 26.0 2,341.3 1,813.3 29.1 3 2 General Motors Corp. Detroit 3,296.1 4,110.1 -19.8 2,208.4 2,918.2 -24.3 4 3 Time Warner New York 3,088.8 3,518.3 -12.2 1,837.8 2,075.8 -11.5 5 7 Verizon Communications New York 2,821.8 2,481.3 13.7 1,947.0 1,761.7 10.5 6 6 Ford Motor Co. Dearborn, Mich. 2,576.8 2,611.8 -1.3 1,700.7 1,567.1 8.5 7 9 GlaxoSmithKline Brentford, Middlesex, U.K. 2,444.2 2,249.8 8.6 1,295.4 1,192.4 8.6 8 8 Walt Disney Co. Burbank, Calif. 2,320.0 2,291.7 1.2 1,438.4 1,420.8 1.2 9 4 Johnson & Johnson New Brunswick, N.J. 2,290.5 2,669.4 -14.2 1,351.4 1,674.6 -19.3 10 12 Unilever London/Rotterdam 2,098.3 1,943.5 8.0 847.7 762.8 11.1 11 14 Toyota Motor Corp. Toyota City, Japan 1,995.3 1,783.2 11.9 1,202.6 1,074.7 11.9 12 13 Sony Corp. Tokyo 1,994.0 1,801.8 10.7 1,116.6 1,009.0 10.7 13 10 DaimlerChrysler Auburn Hills, Mich./Stuttgart, Germany 1,952.2 2,181.2 -10.5 1,425.1 1,592.3 -10.5 14 11 General Electric Co. Fairfield, Conn. 1,860.2 1,979.9 -6.0 1,097.5 1,168.2 -6.0 15 16 Sprint Nextel Corp. Reston, Va. 1,775.2 1,715.2 3.5 1,251.5 1,320.7 -5.2 16 17 McDonald’s Corp. Oak Brook, Ill. 1,748.3 1,656.8 5.5 785.0 762.1 3.0 17 15 Sears Holdings Corp. Hoffman Estates, Ill. 1,652.8 1,715.3 -3.6 793.4 823.3 -3.6 18 19 L’Oreal Clichy, France 1,456.3 1,464.2 -0.5 752.9 798.0 -5.6 19 22 Kraft Foods Northfield, Ill. 1,423.2 1,428.9 -0.4 996.2 1,071.7 -7.0 20 23 Macy’s Cincinnati 1,361.2 1,346.7 1.1 1,089.0 1,117.7 -2.6 21 24 Honda Motor Co. Tokyo 1,350.8 1,314.9 2.7 878.0 854.7 2.7 22 18 Bank of America Corp. Charlotte, N.C. 1,334.4 1,497.0 -10.9 232.2 260.5 -10.9 23 21 Nissan Motor Co. Tokyo 1,328.9 1,441.8 -7.8 943.5 1,023.7 -7.8 24 20 PepsiCo Purchase, N.Y. 1,322.7 1,461.0 -9.5 965.6 1,125.0 -14.2 25 25 Nestle Vevey, Switzerland 1,315.0 1,270.9 3.5 604.9 584.6 3.5 26 28 News Corp. New York 1,244.5 1,166.4 6.7 871.1 886.4 -1.7 27 30 J.C. Penney Co. Plano, Texas 1,162.3 1,084.9 7.1 464.9 434.0 7.1 28 34 Target Corp. Minneapolis 1,156.9 1,021.2 13.3 671.0 604.5 11.0 29 26 U.S. Government Washington 1,132.7 1,230.2 -7.9 657.0 713.5 -7.9 30 29 Home Depot Atlanta 1,118.1 1,109.3 0.8 542.3 554.7 -2.2 31 45 Pfizer New York 1,104.9 849.2 30.1 662.9 509.5 30.1 32 39 Berkshire Hathaway Omaha, Neb. 1,093.4 919.6 18.9 645.1 554.2 16.4 33 41 Wyeth Madison, N.J. 1,076.8 892.7 20.6 449.5 383.9 17.1 34 36 Wal-Mart Stores Bentonville, Ark. 1,072.6 970.3 10.5 536.3 582.2 -7.9 35 38 JPMorgan Chase & Co. New York 1,062.5 922.2 15.2 404.4 344.4 17.4 36 27 Novartis Basel, Switzerland 1,052.2 1,175.3 -10.5 473.5 528.9 -10.5 37 33 Estee Lauder Cos. New York 1,031.3 1,039.0 -0.7 164.5 176.6 -6.9 38 65 Merck & Co. Whitehouse Station, N.J. 1,024.2 538.6 90.2 512.1 269.3 90.2 39 35 Citigroup New York 1,012.2 1,000.5 1.2 428.2 623.8 -31.4 40 48 AstraZeneca London 1,005.3 826.0 21.7 532.8 437.8 21.7 41 31 Viacom New York 934.1 1,075.5 -13.1 653.9 806.6 -18.9 42 43 Schering-Plough Corp. Kenilworth, N.J. 931.5 854.7 9.0 428.5 393.2 9.0 43 32 American Express Co. New York 928.7 1,068.9 -13.1 534.0 603.0 -11.4 44 44 General Mills Minneapolis 920.5 852.0 8.0 579.9 613.4 -5.5 45 46 Microsoft Corp. Redmond, Wash. 912.2 839.9 8.6 447.0 461.9 -3.2 46 42 Yum Brands Louisville, Ky. 902.0 866.7 4.1 748.7 719.4 4.1 47 37 Dell Round Rock, Texas 882.5 945.8 -6.7 729.5 781.8 -6.7 48 50 Best Buy Co. Richfield, Minn. 878.7 823.5 6.7 380.5 362.3 5.0 49 49 Capital One Financial Corp. McLean, Va. 863.7 824.8 4.7 321.2 361.7 -11.2 50 51 Lowe’s Cos. Mooresville, N.C. 838.5 778.2 7.7 461.2 424.1 8.7 Notes: Dollars are in millions. 2005 rankings represent data compiled in 2007. Measured media from TNS Media Intelligence’s Stradegy. Consumer magazine includes Sunday magazine, local magazine, business-to-business magazine and Spanish-language magazines; newspaper includes national newspaper, Spanish-language newspaper and FSI data from TNS’s Marx Promotion Intelligence; TV includes network TV, spot TV, syndicated TV, Spanish-language TV and cable TV networks; radio includes network radio, national spot radio and local radio.
- 11. 11 | Advertising Age | June 25, 2007 DATACENTER 100 LEADING NATIONAL ADVERTISERS: MARKETER PROFILES YEARBOOK NATIONAL MARKETERS RANKED 51 TO 100 Ranked by total U.S ad spending in 2006 RANK TOTAL U.S. ADVERTISING SPENDING U.S. MEASURED MEDIA SPENDING 2006 2005 MARKETER HEADQUARTERS 2006 2005 % CHG 2006 2005 % CHG 51 47 Hewlett-Packard Co. Palo Alto, Calif. $828.8 $831.8 -0.4 $472.4 $507.4 -6.9 52 53 Deutsche Telekom Bonn, Germany 815.1 714.6 14.1 595.0 521.6 14.1 53 40 Anheuser-Busch Cos. St. Louis 813.4 919.2 -11.5 510.4 606.7 -15.9 54 59 Hyundai Motor Co. Seoul 785.9 608.5 29.2 550.1 425.9 29.2 55 55 Kohl’s Corp. Menomonee Falls, Wis. 765.9 646.6 18.5 435.8 402.2 8.4 56 52 Kellogg Co. Battle Creek, Mich. 765.1 725.2 5.5 495.0 476.2 4.0 57 71 IAC/InterActiveCorp New York 743.5 496.1 49.8 305.2 203.9 49.7 58 54 Coca-Cola Co. Atlanta 740.8 711.2 4.2 487.1 476.5 2.2 59 61 Bristol-Myers Squibb Co. New York 691.1 585.4 18.1 311.0 216.6 43.6 60 58 Nike Beaverton, Ore. 678.4 608.6 11.5 220.5 200.8 9.8 61 56 Mars Inc. McLean, Va. 658.2 636.5 3.4 362.0 350.1 3.4 62 57 Cadbury Schweppes London 643.7 628.2 2.5 289.7 304.4 -4.8 63 68 Limited Brands Columbus, Ohio 600.5 515.0 16.6 151.3 88.8 70.3 64 69 Visa International San Francisco 597.1 500.3 19.3 417.9 360.2 16.0 65 62 SC Johnson Racine, Wis. 596.5 575.7 3.6 447.3 431.8 3.6 66 63 Clorox Co. Oakland, Calif. 584.2 572.4 2.1 494.5 486.6 1.6 67 70 Comcast Corp. Philadelphia 568.5 497.1 14.4 426.4 372.8 14.4 68 73 Campbell Soup Co. Camden, N.J. 564.3 484.0 16.6 414.3 334.0 24.0 69 75 Eli Lilly & Co. Indianapolis 561.0 475.3 18.0 230.0 194.9 18.0 70 79 Bayer Leverkusen, Germany 553.6 452.7 22.3 304.5 316.9 -3.9 71 72 Doctor’s Associates Milford, Conn. 539.8 486.8 10.9 361.7 326.2 10.9 72 74 Safeway Pleasanton, Calif. 533.6 481.7 10.8 198.0 196.3 0.9 73 66 Kroger Co. Cincinnati 527.5 537.5 -1.9 147.4 163.2 -9.6 74 64 IBM Corp. Armonk, N.Y. 516.5 547.0 -5.6 232.4 283.1 -17.9 75 83 Circuit City Stores Richmond, Va. 498.2 426.5 16.8 303.9 247.8 22.6 76 82 Gap Inc. San Francisco 489.4 432.1 13.3 406.2 324.1 25.3 77 76 MasterCard International Purchase, N.Y. 486.3 466.0 4.4 345.6 335.5 3.0 78 92 Allstate Corp. Northbrook, Ill. 476.9 394.0 21.0 350.5 289.6 21.0 79 85 Vonage Holdings Corp. Holmdel, N.J. 465.1 413.7 12.4 465.1 413.7 12.4 80 67 Sanofi-Aventis Paris 463.1 518.3 -10.6 245.5 274.7 -10.6 81 87 Staples Framingham, Mass. 457.2 404.9 12.9 128.9 101.2 27.4 82 80 Wells Fargo & Co. San Francisco 456.1 443.1 2.9 87.5 93.9 -6.8 83 90 eBay San Jose, Calif. 453.3 396.6 14.3 144.4 158.2 -8.8 84 86 Washington Mutual Seattle 443.0 406.9 8.9 173.4 167.6 3.4 85 77 Wendy’s International Dublin, Ohio 435.2 453.4 -4.0 361.2 376.3 -4.0 86 60 Volkswagen Wolfsburg, Germany 419.3 590.0 -28.9 301.9 424.8 -28.9 87 91 Diageo London 418.9 394.3 6.2 182.6 165.6 10.3 88 95 Mattel El Segundo, Calif. 394.1 383.6 2.7 193.3 184.5 4.8 89 156 Apple Cupertino, Calif. 383.7 219.5 74.8 291.6 158.0 84.5 90 101 Burger King Holdings Miami 379.5 354.5 7.0 285.7 268.9 6.3 91 81 Abbott Laboratories Abbott Park, Ill. 374.4 436.4 -14.2 204.4 218.2 -6.3 92 78 SABMiller London 370.8 452.9 -18.1 241.0 294.4 -18.1 93 89 Molson Coors Brewing Co. Denver/Montreal 369.5 400.9 -7.8 184.7 200.4 -7.8 94 84 CBS Corp. New York 369.2 426.5 -13.4 199.7 230.7 -13.4 95 97 Reckitt Benckiser Slough, Berkshire, U.K. 366.7 369.3 -0.7 286.0 288.1 -0.7 96 100 ConAgra Foods Omaha, Neb. 366.2 355.8 2.9 183.1 177.9 2.9 97 102 Qwest Communications International Denver 362.4 352.6 2.8 94.6 96.1 -1.6 98 103 Philips Electronics Amsterdam 350.8 337.2 4.0 105.2 141.6 -25.7 99 109 Office Depot Delray Beach, Fla. 342.7 314.4 9.0 120.0 100.6 19.2 100 88 State Farm Mutual Auto Insurance Co. Bloomington, Ill. 338.1 401.7 -15.8 270.4 321.3 -15.8 Notes: Dollars are in millions. 2005 rankings represent data compiled in 2007. Measured media from TNS Media Intelligence’s Stradegy. Consumer magazine includes Sunday magazine, local magazine, business-to-business magazine and Spanish-language magazines; newspaper includes national newspaper, Spanish-language newspaper and FSI data from TNS’s Marx Promotion Intelligence; TV includes network TV, spot TV, syndicated TV, Spanish-language TV and cable TV networks; radio includes network radio, national spot radio and local radio.
- 12. 12 | Advertising Age | June 25, 2007 DATACENTER 100 LEADING NATIONAL ADVERTISERS: MARKETER PROFILES YEARBOOK MARKETER PROFILES From Abbott to Yum: Ad spending, financials, personnel and agencies global pharmaceutical devel; William G. Dempsey, exec VP-U.S. 91 Abbott Laboratories Pharmaceutical Products Group. U.S. ad spending ($ in thousands) CommonHealth, Parsippany, N.J. Matt Giegerich, pres & CEO- By media 2006 2005 % chg CommonHealth; John Nosta, pres-Noesis, part of Magazine . . . . . . . . . . . . . . . . . .$88,438 $97,127 -8.9 CommonHealth; Darlene Dobry, pres-Carbon, part of Sunday magazine . . . . . . . . . . . . .1,462 2,192 -33.3 CommonHealth. — Advicor, Omnicef, Vicodin CR. B2B magazines . . . . . . . . . . . . . . .1,431 992 44.2 Marketing Drive, Norwalk, Conn. Michael Harris, CEO. — Local magazines . . . . . . . . . . . . . . . .NA 10 NA Freestyle. Spanish-language magazines . . . .743 499 48.8 Stone/Blakely, Seattle. — Freestyle. Newspaper . . . . . . . . . . . . . . . . . . .1,181 162 627.5 Torre Lazur McCann, East Hanover, N.J. Joe Poggi, pres-echo- National newspaper . . . . . . . . . . . . .229 1,116 -79.5 TL. — Niaspan, CF. Network TV . . . . . . . . . . . . . . . . .52,218 54,956 -5.0 RTC Relationship Marketing, Washington. Jeff Ross, pres. — Spot TV . . . . . . . . . . . . . . . . . . . . .1,874 1,145 63.7 relationship mktg, Humira. Syndicated TV . . . . . . . . . . . . . . .20,319 23,418 -13.2 Cable TV networks . . . . . . . . . . .28,131 29,479 -4.6 Ross Products: 625 Cleveland Ave., Columbus, Ohio Spanish-language TV . . . . . . . . . .3,213 3,670 -12.5 43215/Phone: (800) 986- 8510. Gary E. McCullough, sr VP. Network radio . . . . . . . . . . . . . . . . . .793 NA NA Brand Pharm, New York. Jonathan Brody, grp acct dir. — National spot radio . . . . . . . . . . . . .201 163 23.0 Similac Infant Nutritionals, Neosure, Tolerance Brands, Pedialyte, Local radio . . . . . . . . . . . . . . . . . . . .209 163 28.1 Pediasure. Outdoor . . . . . . . . . . . . . . . . . . . . . . .655 637 2.8 Gotham, New York. Gunnar Wilmot, pres & CEO. — Ensure, Internet . . . . . . . . . . . . . . . . . . . . . .3,301 2,472 33.5 Glucerna. Measured media . . . . . . . . .204,397 218,201 -6.3 Publicis, New York. Kara Dugan, sr VP & grp acct dir. — Unmeasured spending . . . .169,957 218,201 -22.1 PediaSure, Pedialyte, NutriPals, Similac, Isomil. Total . . . . . . . . . . . . . . . . . . . .374,354 436,401 -14.2 Lapiz Hispanic Marketing, Chicago. Leo Olper, sr VP & chief By brand 2006 2005 % chg operating officer. — Hispanic adv, strategic plng, creative devel, Humira . . . . . . . . . . . . . . . . . . . . .79,938 88,155 -9.3 Similac, PediaSure, Pedialyte. PediaSure . . . . . . . . . . . . . . . . . . .26,317 24,631 6.8 Ensure . . . . . . . . . . . . . . . . . . . . .20,180 20,727 -2.6 Freestyle . . . . . . . . . . . . . . . . . . . .17,395 20,534 -15.3 78 Allstate Corp. Sales & earnings ($ in millions) U.S. ad spending ($ in thousands) Worldwide 2006 2005 % chg By media 2006 2005 % chg Sales . . . . . . . . . . . . . . . . . . . . . .$22,476 $22,338 0.6 Magazine . . . . . . . . . . . . . . . . . .$25,372 $5,741 341.9 Earnings . . . . . . . . . . . . . . . . . . . . .1,717 3,372 -49.1 Sunday magazine . . . . . . . . . . . . .1,365 390 249.8 U.S. 2006 2005 % chg B2B magazines . . . . . . . . . . . . . . . . .277 1,015 -72.7 Sales . . . . . . . . . . . . . . . . . . . . . . .11,995 12,707 -5.6 Local magazines . . . . . . . . . . . . . . .133 NA NA Division sales 2006 2005 % chg Spanish-language magazines . . . .671 319 110.4 Pharmaceuticals . . . . . . . . . . . . .12,395 13,691 -9.5 Newspaper . . . . . . . . . . . . . . . . . . .9,960 7,810 27.5 Nutritionals . . . . . . . . . . . . . . . . . .4,313 3,937 9.6 National newspaper . . . . . . . . . . .5,027 3,291 52.7 Diagnostics . . . . . . . . . . . . . . . . . .3,979 3,756 5.9 Spanish-language Newspaper . . . .436 599 -27.3 Vascular . . . . . . . . . . . . . . . . . . . . .1,082 253 327.7 Network TV . . . . . . . . . . . . . . . . .83,102 79,952 3.9 Other . . . . . . . . . . . . . . . . . . . . . . . . .707 701 0.9 Spot TV . . . . . . . . . . . . . . . . . . . . .2,808 9,938 -71.7 Syndicated TV . . . . . . . . . . . . . . .25,207 20,948 20.3 Headquarters Cable TV networks . . . . . . . . . . .81,041 75,940 6.7 Abbott Laboratories/100 Abbott Park, Abbott Park, Ill. Spanish-language TV . . . . . . . . .33,391 20,749 60.9 60064/Phone: (847) 937-6100. Network radio . . . . . . . . . . . . . . . .3,051 3,302 -7.6 National spot radio . . . . . . . . . .25,000 19,744 26.6 Personnel, brands, agencies Local radio . . . . . . . . . . . . . . . . . .25,092 13,241 89.5 Corporate: Miles D. White, chmn & CEO; Richard A. Gonzalez, Outdoor . . . . . . . . . . . . . . . . . . . . .9,927 6,343 56.5 pres & chief operating officer. Internet . . . . . . . . . . . . . . . . . . . .18,646 20,284 -8.1 Measured media . . . . . . . . .350,505 289,604 21.0 Pharmaceutical Products Group: 100 Abbott Park Rd., Abbott Unmeasured spending . . . .126,372 104,415 21.0 Park, Ill. 60064/Phone: (874) 937-6100. Alejandro A. Aruffo, VP- Total . . . . . . . . . . . . . . . . . . . .476,877 394,019 21.0
- 13. 13 | Advertising Age | June 25, 2007 DATACENTER 100 LEADING NATIONAL ADVERTISERS: MARKETER PROFILES YEARBOOK By brand 2006 2005 % chg By media 2006 2005 % chg Allstate . . . . . . . . . . . . . . . . . . . .349,727 289,428 20.8 National spot radio . . . . . . . . . . . .3,827 7,267 -47.3 Local radio . . . . . . . . . . . . . . . . . .18,420 26,790 -31.2 Sales & earnings ($ in millions) Outdoor . . . . . . . . . . . . . . . . . . . . .9,791 9,260 5.7 Worldwide 2006 2005 % chg Internet . . . . . . . . . . . . . . . . . . . .80,839 28,869 180.0 Sales . . . . . . . . . . . . . . . . . . . . . .$35,796 $35,383 1.2 Measured media . . . . . . . . .533,992 602,959 -11.4 Earnings . . . . . . . . . . . . . . . . . . . . .4,993 1,765 182.9 Unmeasured spending . . . .394,689 465,927 -15.3 U.S. 2006 2005 % chg Total . . . . . . . . . . . . . . . . . . . .928,681 1,068,885 -13.1 Sales . . . . . . . . . . . . . . . . . . . . . . .35,068 34,728 1.0 By brand 2006 2005 % chg Division sales 2006 2005 % chg American Express . . . . . . . . . .519,410 593,686 -12.5 Property-liability . . . . . . . . . . . . .29,571 29,346 0.8 Allstate Financial . . . . . . . . . . . . .6,060 5,898 2.7 Sales & earnings ($ in millions) Corporate & other . . . . . . . . . . . . . .165 139 18.7 Worldwide 2006 2005 % chg Sales . . . . . . . . . . . . . . . . . . . . . .$27,136 $24,068 12.7 Headquarters Earnings . . . . . . . . . . . . . . . . . . . . .3,707 3,734 -0.7 Allstate Corp./2775 Sanders Rd., Northbrook, Ill. 60062/Phone: U.S. 2006 2005 % chg (847) 402-5000. Sales . . . . . . . . . . . . . . . . . . . . . . .18,376 15,888 15.7 Pre-tax income . . . . . . . . . . . . . . .4,264 3,337 27.8 Personnel, brands, agencies Division sales 2006 2005 % chg Corporate: Edward M. Liddy, chmn; Thomas J. Wilson, pres & US Card Svcs . . . . . . . . . . . . . . . .13,955 11,978 16.5 CEO. Global Card & Commercial Svcs . . .9,464 8,905 6.3 Global Network & Merchant Svcs . .3,161 2,747 15.1 Allstate Insurance Co.: 2775 Sanders Rd., Northbrook, Ill. Corporate & other . . . . . . . . . . . . . .556 438 26.9 60062/Phone: (847) 402- 5000. Joseph V. Tripodi, sr VP & chief mktg officer; Lisa Cochrane, VP-integrated mktg comms; Nancy Headquarters Abraham, dir-comms plng & execution; Pam Hollander, dir-spon- American Express Co./World Financial Center, 200 Vesey St., sorships, promo & pr; Nancy Ryan, dir-media. New York, N.Y. 10285/Phone: (212) 640-2000. Leo Burnett Worldwide, Chicago. Nina Abnee, exec VP & acct dir. — Allstate. Notes Starcom USA, Chicago. Mary Kang, acct dir. — media svcs. American Express is making a major investment in interactive Burrell Communications Group, Chicago. Fay Ferguson, co- marketing. David Kenny, CEO of AmEx agency Digitas, in CEO; Dani Marvel, VP & acct dir. — African-American adv. February 2007 said American Express “will produce in a single Kang & Lee, New York. Cynthia Park, exec VP. — Asian- year over 3,500 different (digital) advertising campaigns, much American adv. more than you would do in broadcast or print, because you need La Agencia de Orci & Asociados, Los Angeles. Dilys Tosteson- to target to so many segments.” He added that AmEx is increas- Garcia, pres & CEO. — Hispanic adv. ingly reliant on digital to generate new customers: “ Companies IMG Consulting, Chicago. Mike Murrey, sr VP. — sports mktg. like American Express are now acquiring over half of their new Octagon, Norwalk, Conn. Lisa Murry, exec VP. — sports mktg. charge volume online,” he said, “so it’s becoming very central to OgilvyOne Worldwide, Chicago. Trish Chupak, sr ptnr & dir- their operations.” AmEx is the largest client of Publicis Groupe’s client svcs. — direct mktg. Digitas Inc., accounting for 26% of Digitas Inc. fee revenue in 2005 and in the first nine months of 2006. 43 American Express Co. American Express in September 2005 spun off to shareholders its U.S. ad spending ($ in thousands) financial advisory business, Ameriprise Financial. By media 2006 2005 % chg Magazine . . . . . . . . . . . . . . . . .$107,536 $148,573 -27.6 American Express in 2006 generated about 68% of revenue from Sunday magazine . . . . . . . . . . . . .2,761 5,681 -51.4 the U.S. B2B magazines . . . . . . . . . . . . . . .6,221 6,581 -5.5 Local magazines . . . . . . . . . . . . . . .647 457 41.5 Personnel, brands, agencies Spanish-language magazines . . . .185 25 634.1 Corporate: Kenneth I. Chenault, chmn & CEO. Newspaper . . . . . . . . . . . . . . . . . .33,169 62,483 -46.9 Digitas, New York. Joanne Zaiac, pres-Digitas New York; Joe National newspaper . . . . . . . . . .17,403 33,153 -47.5 Rauen, exec VP & relationship leader; Carl Fremont, exec VP- Spanish-language Newspaper . . . . .86 73 17.9 media. — direct mktg, digital mktg, digital media buying, FSI . . . . . . . . . . . . . . . . . . . . . . . . . . . .NA 7 NA American Express. Network TV . . . . . . . . . . . . . . . .108,764 146,304 -25.7 ID Media, New York. Jessica Birk, VP & acct dir. — small bus, Spot TV . . . . . . . . . . . . . . . . . . . .39,583 35,328 12.0 cons card. Syndicated TV . . . . . . . . . . . . . . . .8,248 3,529 133.7 Cable TV networks . . . . . . . . . . .96,113 88,576 8.5 Media measured are from TNS Media Intelligence, except FSI’s from TNS’s Marx Promotion Intelligence See Page 8 for methodology. Network radio . . . . . . . . . . . . . . . . . .402 NA NA