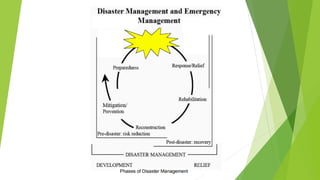
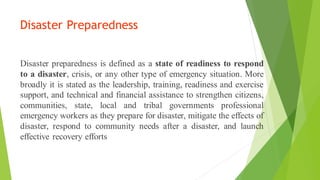
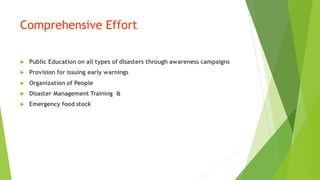
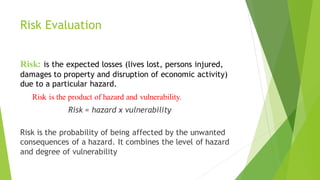
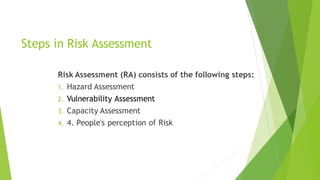
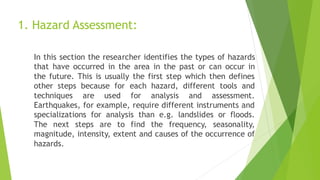
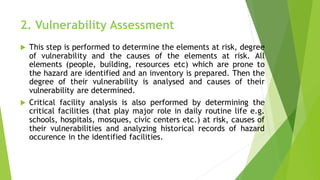
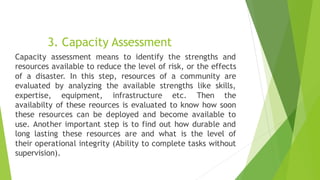
UNIT 3
UNIT III:
DISASTER IMPACTS (6) Disaster Impacts (environmental,
physical, social, ecological, economic, political, etc.);
health, psycho-social issues; demographic aspects (gender,
age, special needs); hazard locations; global and national
disaster trends; climate change and urban disasters.
Disaster Preparedness
Disaster preparedness is defined as a state of readiness to respond
to a disaster, crisis, or any other type of emergency situation. More
broadly it is stated as the leadership, training, readiness and exercise
support, and technical and financial assistance to strengthen citizens,
communities, state, local and tribal governments professional
emergency workers as they prepare for disaster, mitigate the effects of
disaster, respond to community needs after a disaster, and launch
effective recovery efforts
Comprehensive Effort
 Public Education on all types of disasters through awareness campaigns
 Provision for issuing early warnings
 Organization of People
 Disaster Management Training &
 Emergency food stock
Steps in preparing for a disaster
 Preparedness consists of three basic steps: preparing a
plan, training to the plan, and exercising the plan.
Preparedness deals with the functional aspects of emergency
management such as the response to and recovery from a
disaster, whereas mitigation attempts to lessen these effects
through pre-disaster actions as simple as striving to create
“disaster-resistant” communities.
Disaster Management Seven Issues
a) Database
b) Logistics
c) Technological Needs
d) Self Reliance
e) Communication Infrastructure
f) Emergency Preparedness
g) Forecasting
a) Database
 On various resources, skills, & services required for relief at short notice.
 It will have information on safety equipments, oxygen cylinders & various
other equipments, skills and other information required to deal with
emergency.
b) Logistics
 One of the most difficult problems to be handled is the organization of
supply chain for relief.
 This system could not be integrated with the GIS system so that supplies
could be tracked right upto the village.
 This needs to be done. Likewise, other elements of logistics need to be put
in place.
c) Technological Needs
 Whole range of technical questions regarding buildings, cutting concrete
slabs, rescue and relief emerged which needed to be solved on the spot.
 The best practices have to be put in use.
d) Self Reliance
 The community self-reliance, lot of aid led to excessive inventory at the
household level leading to reduced incentives for work and
self-help.
 Likewise, there were areas where communities came together to help each
other.
 The lessons of community self-help need to be put together.
 A database of volunteers who can move at short notice will need to be
developed.
e) Communication Infrastructure
 This is a serious problem and has to be resolved once for all.
 It will require network of ham radios, use of All India Radio, Television
Channels & setting up help lines, etc.
 We will also have to create information dissemination system and develop
mechanism for capacity building.
f) Emergency Preparedness
 Drills will have to be organized to keep society prepared for dealing with such
emergencies.
 One will have to learn from the experience of other similar drills.
g) Forecasting
 Wherever possible, disasters which can be anticipated over time or space
need to be looked into.
 For instance, buildings erected on land fill areas which were wetlands or
low lying areas were more likely to get damaged, as was borne out by the
recent evidence.
Risk Evaluation
Risk: is the expected losses (lives lost, persons injured,
damages to property and disruption of economic activity)
due to a particular hazard.
Risk is the product of hazard and vulnerability.
Risk = hazard x vulnerability
Risk is the probability of being affected by the unwanted
consequences of a hazard. It combines the level of hazard
and degree of vulnerability
Risk Assessment
Risk assessment is a term used widely for a systematic approach to
characterizing the risks posed to individuals and populations by potentially
adverse exposures.
or
The process of determining the nature and extent of risk by analyzing potential
hazards and evaluating existing conditions of vulnerability and capacity
Steps in Risk Assessment
Risk Assessment (RA) consists of the following steps:
1. Hazard Assessment
2. Vulnerability Assessment
3. Capacity Assessment
4. 4. People's perception of Risk
1. Hazard Assessment:
In this section the researcher identifies the types of hazards
that have occurred in the area in the past or can occur in
the future. This is usually the first step which then defines
other steps because for each hazard, different tools and
techniques are used for analysis and assessment.
Earthquakes, for example, require different instruments and
specializations for analysis than e.g. landslides or floods.
The next steps are to find the frequency, seasonality,
magnitude, intensity, extent and causes of the occurrence of
hazards.
2. Vulnerability Assessment
 This step is performed to determine the elements at risk, degree
of vulnerability and the causes of the elements at risk. All
elements (people, building, resources etc) which are prone to
the hazard are identified and an inventory is prepared. Then the
degree of their vulnerability is analysed and causes of their
vulnerability are determined.
 Critical facility analysis is also performed by determining the
critical facilities (that play major role in daily routine life e.g.
schools, hospitals, mosques, civic centers etc.) at risk, causes of
their vulnerabilities and analyzing historical records of hazard
occurence in the identified facilities.
3. Capacity Assessment
Capacity assessment means to identify the strengths and
resources available to reduce the level of risk, or the effects
of a disaster. In this step, resources of a community are
evaluated by analyzing the available strengths like skills,
expertise, equipment, infrastructure etc. Then the
availabilty of these reources is evaluated to know how soon
these resources can be deployed and become available to
use. Another important step is to find out how durable and
long lasting these resources are and what is the level of
their operational integrity (Ability to complete tasks without
supervision).
4. People's perception of Risk
The process of finding out the perceptions
of heterogeneous groups in the community
regarding the disasters, hazards and risks
that they are facing.
Risk management approach- timely early warning system
In case of drought, Early warning indicators may be:
• Deficit rainfall
• Reduced supplies in surface flow channels
• Inadequate soil moisture
• Vegetation Index
• Short, medium and long-rangeweather forecast
• Crop yield forecas
For development of early warning system, the monitoring of
drought by appropriate drought indices would be essential
initial input. The basic requirement for early warning system
for meteorological drought is to have long range forecast at a
smaller spatial and temporal scales.
Satellite Sensors
…..continued
It is also felt to include more indicators and information in
monitoring drought. Some of the parameters are dry spells, very
high temperature during crop growing period, critical stages of
the main crops and cultural practices needed in these stages,
soil moisture in the crop root zone and outbreak of crop pests
and diseases.
The remote sensing can also play a good role to provide
information on various drought indicators (viz. rainfall, soil
moisture etc.) The NDVI and other indices are found to vary with
the magnitude of greenness. Moisture stress in vegetation due to
continued rainfall deficiency is reflected with lowering of value of
vegetation indices. Microwave sensors can provide estimate of
soil moisture only in surface layers upto 10 cm thickness
It is also important to transmit this information promptly via a
suitable telecommunication system
…..continued
Similarly the requirements for an efficient cyclone warning
system are:
(a) Advance, accurate and detailed forecasts of dangerous
(b)conditions which involve:
• Detection of the storm
• Determination of the center of development
• Forecast of the future intensity
• Forecast of the future movement
(b) A rapid and dependable distribution system for the forecasts,
advisories and warnings to all interested parties; and
(c) Prompt and effective utilization of warnings by the government and
the public.
An essential element of a warning service is that there should be
certainty that the warnings will reach the intended recipients promptly.
The supporting communications system, including back-up facilities,
should therefore be planned and implemented in full detail.
6 Recognizing that early warning is an important component
of preparedness, it is recommended that:
• The concept of the drought monitor map product be
promoted as a tool for all drought-prone countries
to better understand drought severity using
multiple indicators.
• A white paper be developed on the methodology for
preparation of a drought monitor map with
recommendations for minimum, maximum, and optimum
data layers needed to successfully accomplish this task
and for inter-agency collaboration to accomplish this
task.
• The feasibility of organizing joint training workshops on
national and regional drought monitor products under
the auspices of WMO and the NDMC be
examined. Indices used in China in their
agrometeorological bulletin could be effective training
tools. The first of these workshops could be organized
in China.
Drought monitor map
India Meteorological Department (IMD) prepares aridity anomaly maps
for the country as a whole in order to monitor droughts over the
country on a real time basis. In addition , IMD prepares rainfall maps
every week throughout the year which show rainfall received during
a week and the corresponding departures from normal, thus
indicating the development of drought and its termination.
Another method of monitoring drought is to use standardised
precipitation index (SPI) which could be adopted on operational basis
in the form of map.
Remote sensing can also play a good role to monitor the drought by
the vegetative index map which indicates the vegetative status
during the fortnight period. The NDVI and other related indices are
found to carry with magnitude of green foliage brought about by
phenological changes. The temporal pattern of NDVI is useful in
diagnosting vegetative condition.
…..continued
Methodology for preparation of drought map
Aridity Index = Water Deficit = Actual Evaporation – Potential Evaporation
Water Need Potential Evaporation
Various categories of Agricultural drought
Drought Category Aridity Anomaly Value
Mild Drought upto 25%
Moderate Drought 26-50%
Severe Drought > 50%
SPI classification scale
SPI Value Drought Category
0 to 0.99 Mild Drought
-1.00 to –1.49 Moderate Drought
-1.00 to –1.99 Severe Drought
-2.00 or less Extreme Drought
( )






 −
=
X
i
X
SPI
b
…..continued
( )
VIS
NIR
VIS
NIR
NDVI
c
+
−
=
When NIR and VIS are measured radiation in near
infrared and visible bands.
Moisture stress in vegetation resulting from
prolonged rainfall deficiency is reflected by lower
NDVI values.
…..continued
7. There is an urgent need to assess the
forecasting skills for natural disasters to
determine those where greater research is
needed. Lack of good forecast skill in
drought, for example, is a constraint to
improved adaptation, management, and
mitigation.
Skill Score :
For the qualitative analysis of event forecast skill score and ratio score tests
have been used, which are based on 2x2 contingency table. The results are
as follows :-
Table 6(a) The ratio and skill score for the year 1992-2000
April 99 to March 2000)
Predicted Observed
Event No event
Event 12 (YY) 6 (NY)
No event 10 (YN) 119 (NN)
Ratio Score =
+
=
( )
.
12 119
147
100
8912%

Critical Sucess Index C S I
( . . )
.
=
+ +
=
12
6 10 12
0 40
Skill Score =
−
+ +
=
=
( ) ( )
( ) ( )
.
12 119 6 10
12 10 6 119
1168
2750
0 425
 

8 Given the regional and global nature of natural
disasters, it is essential to promote and foster the
use of international and regional programs to
enhance collaboration and building of partnerships
and through virtual networks with distributed
functions to enhance cooperation on issues related
to improved management of and preparedness for
natural disasters.

disaster management...........................

  • 1.
    UNIT 3 UNIT III: DISASTERIMPACTS (6) Disaster Impacts (environmental, physical, social, ecological, economic, political, etc.); health, psycho-social issues; demographic aspects (gender, age, special needs); hazard locations; global and national disaster trends; climate change and urban disasters.
  • 3.
    Disaster Preparedness Disaster preparednessis defined as a state of readiness to respond to a disaster, crisis, or any other type of emergency situation. More broadly it is stated as the leadership, training, readiness and exercise support, and technical and financial assistance to strengthen citizens, communities, state, local and tribal governments professional emergency workers as they prepare for disaster, mitigate the effects of disaster, respond to community needs after a disaster, and launch effective recovery efforts
  • 4.
    Comprehensive Effort  PublicEducation on all types of disasters through awareness campaigns  Provision for issuing early warnings  Organization of People  Disaster Management Training &  Emergency food stock
  • 5.
    Steps in preparingfor a disaster  Preparedness consists of three basic steps: preparing a plan, training to the plan, and exercising the plan. Preparedness deals with the functional aspects of emergency management such as the response to and recovery from a disaster, whereas mitigation attempts to lessen these effects through pre-disaster actions as simple as striving to create “disaster-resistant” communities.
  • 6.
    Disaster Management SevenIssues a) Database b) Logistics c) Technological Needs d) Self Reliance e) Communication Infrastructure f) Emergency Preparedness g) Forecasting
  • 7.
    a) Database  Onvarious resources, skills, & services required for relief at short notice.  It will have information on safety equipments, oxygen cylinders & various other equipments, skills and other information required to deal with emergency.
  • 8.
    b) Logistics  Oneof the most difficult problems to be handled is the organization of supply chain for relief.  This system could not be integrated with the GIS system so that supplies could be tracked right upto the village.  This needs to be done. Likewise, other elements of logistics need to be put in place.
  • 9.
    c) Technological Needs Whole range of technical questions regarding buildings, cutting concrete slabs, rescue and relief emerged which needed to be solved on the spot.  The best practices have to be put in use.
  • 10.
    d) Self Reliance The community self-reliance, lot of aid led to excessive inventory at the household level leading to reduced incentives for work and self-help.  Likewise, there were areas where communities came together to help each other.  The lessons of community self-help need to be put together.  A database of volunteers who can move at short notice will need to be developed.
  • 11.
    e) Communication Infrastructure This is a serious problem and has to be resolved once for all.  It will require network of ham radios, use of All India Radio, Television Channels & setting up help lines, etc.  We will also have to create information dissemination system and develop mechanism for capacity building.
  • 12.
    f) Emergency Preparedness Drills will have to be organized to keep society prepared for dealing with such emergencies.  One will have to learn from the experience of other similar drills.
  • 13.
    g) Forecasting  Whereverpossible, disasters which can be anticipated over time or space need to be looked into.  For instance, buildings erected on land fill areas which were wetlands or low lying areas were more likely to get damaged, as was borne out by the recent evidence.
  • 14.
    Risk Evaluation Risk: isthe expected losses (lives lost, persons injured, damages to property and disruption of economic activity) due to a particular hazard. Risk is the product of hazard and vulnerability. Risk = hazard x vulnerability Risk is the probability of being affected by the unwanted consequences of a hazard. It combines the level of hazard and degree of vulnerability
  • 15.
    Risk Assessment Risk assessmentis a term used widely for a systematic approach to characterizing the risks posed to individuals and populations by potentially adverse exposures. or The process of determining the nature and extent of risk by analyzing potential hazards and evaluating existing conditions of vulnerability and capacity
  • 16.
    Steps in RiskAssessment Risk Assessment (RA) consists of the following steps: 1. Hazard Assessment 2. Vulnerability Assessment 3. Capacity Assessment 4. 4. People's perception of Risk
  • 17.
    1. Hazard Assessment: Inthis section the researcher identifies the types of hazards that have occurred in the area in the past or can occur in the future. This is usually the first step which then defines other steps because for each hazard, different tools and techniques are used for analysis and assessment. Earthquakes, for example, require different instruments and specializations for analysis than e.g. landslides or floods. The next steps are to find the frequency, seasonality, magnitude, intensity, extent and causes of the occurrence of hazards.
  • 18.
    2. Vulnerability Assessment This step is performed to determine the elements at risk, degree of vulnerability and the causes of the elements at risk. All elements (people, building, resources etc) which are prone to the hazard are identified and an inventory is prepared. Then the degree of their vulnerability is analysed and causes of their vulnerability are determined.  Critical facility analysis is also performed by determining the critical facilities (that play major role in daily routine life e.g. schools, hospitals, mosques, civic centers etc.) at risk, causes of their vulnerabilities and analyzing historical records of hazard occurence in the identified facilities.
  • 19.
    3. Capacity Assessment Capacityassessment means to identify the strengths and resources available to reduce the level of risk, or the effects of a disaster. In this step, resources of a community are evaluated by analyzing the available strengths like skills, expertise, equipment, infrastructure etc. Then the availabilty of these reources is evaluated to know how soon these resources can be deployed and become available to use. Another important step is to find out how durable and long lasting these resources are and what is the level of their operational integrity (Ability to complete tasks without supervision).
  • 20.
    4. People's perceptionof Risk The process of finding out the perceptions of heterogeneous groups in the community regarding the disasters, hazards and risks that they are facing.
  • 21.
    Risk management approach-timely early warning system In case of drought, Early warning indicators may be: • Deficit rainfall • Reduced supplies in surface flow channels • Inadequate soil moisture • Vegetation Index • Short, medium and long-rangeweather forecast • Crop yield forecas For development of early warning system, the monitoring of drought by appropriate drought indices would be essential initial input. The basic requirement for early warning system for meteorological drought is to have long range forecast at a smaller spatial and temporal scales.
  • 22.
  • 24.
    …..continued It is alsofelt to include more indicators and information in monitoring drought. Some of the parameters are dry spells, very high temperature during crop growing period, critical stages of the main crops and cultural practices needed in these stages, soil moisture in the crop root zone and outbreak of crop pests and diseases. The remote sensing can also play a good role to provide information on various drought indicators (viz. rainfall, soil moisture etc.) The NDVI and other indices are found to vary with the magnitude of greenness. Moisture stress in vegetation due to continued rainfall deficiency is reflected with lowering of value of vegetation indices. Microwave sensors can provide estimate of soil moisture only in surface layers upto 10 cm thickness It is also important to transmit this information promptly via a suitable telecommunication system
  • 25.
    …..continued Similarly the requirementsfor an efficient cyclone warning system are: (a) Advance, accurate and detailed forecasts of dangerous (b)conditions which involve: • Detection of the storm • Determination of the center of development • Forecast of the future intensity • Forecast of the future movement (b) A rapid and dependable distribution system for the forecasts, advisories and warnings to all interested parties; and (c) Prompt and effective utilization of warnings by the government and the public. An essential element of a warning service is that there should be certainty that the warnings will reach the intended recipients promptly. The supporting communications system, including back-up facilities, should therefore be planned and implemented in full detail.
  • 26.
    6 Recognizing thatearly warning is an important component of preparedness, it is recommended that: • The concept of the drought monitor map product be promoted as a tool for all drought-prone countries to better understand drought severity using multiple indicators. • A white paper be developed on the methodology for preparation of a drought monitor map with recommendations for minimum, maximum, and optimum data layers needed to successfully accomplish this task and for inter-agency collaboration to accomplish this task. • The feasibility of organizing joint training workshops on national and regional drought monitor products under the auspices of WMO and the NDMC be examined. Indices used in China in their agrometeorological bulletin could be effective training tools. The first of these workshops could be organized in China.
  • 27.
    Drought monitor map IndiaMeteorological Department (IMD) prepares aridity anomaly maps for the country as a whole in order to monitor droughts over the country on a real time basis. In addition , IMD prepares rainfall maps every week throughout the year which show rainfall received during a week and the corresponding departures from normal, thus indicating the development of drought and its termination. Another method of monitoring drought is to use standardised precipitation index (SPI) which could be adopted on operational basis in the form of map. Remote sensing can also play a good role to monitor the drought by the vegetative index map which indicates the vegetative status during the fortnight period. The NDVI and other related indices are found to carry with magnitude of green foliage brought about by phenological changes. The temporal pattern of NDVI is useful in diagnosting vegetative condition.
  • 28.
    …..continued Methodology for preparationof drought map Aridity Index = Water Deficit = Actual Evaporation – Potential Evaporation Water Need Potential Evaporation Various categories of Agricultural drought Drought Category Aridity Anomaly Value Mild Drought upto 25% Moderate Drought 26-50% Severe Drought > 50%
  • 31.
    SPI classification scale SPIValue Drought Category 0 to 0.99 Mild Drought -1.00 to –1.49 Moderate Drought -1.00 to –1.99 Severe Drought -2.00 or less Extreme Drought ( )        − = X i X SPI b …..continued
  • 33.
    ( ) VIS NIR VIS NIR NDVI c + − = When NIRand VIS are measured radiation in near infrared and visible bands. Moisture stress in vegetation resulting from prolonged rainfall deficiency is reflected by lower NDVI values. …..continued
  • 36.
    7. There isan urgent need to assess the forecasting skills for natural disasters to determine those where greater research is needed. Lack of good forecast skill in drought, for example, is a constraint to improved adaptation, management, and mitigation.
  • 37.
    Skill Score : Forthe qualitative analysis of event forecast skill score and ratio score tests have been used, which are based on 2x2 contingency table. The results are as follows :- Table 6(a) The ratio and skill score for the year 1992-2000 April 99 to March 2000) Predicted Observed Event No event Event 12 (YY) 6 (NY) No event 10 (YN) 119 (NN)
  • 38.
    Ratio Score = + = () . 12 119 147 100 8912%  Critical Sucess Index C S I ( . . ) . = + + = 12 6 10 12 0 40 Skill Score = − + + = = ( ) ( ) ( ) ( ) . 12 119 6 10 12 10 6 119 1168 2750 0 425   
  • 39.
    8 Given theregional and global nature of natural disasters, it is essential to promote and foster the use of international and regional programs to enhance collaboration and building of partnerships and through virtual networks with distributed functions to enhance cooperation on issues related to improved management of and preparedness for natural disasters.