SlideShare a Scribd company logo
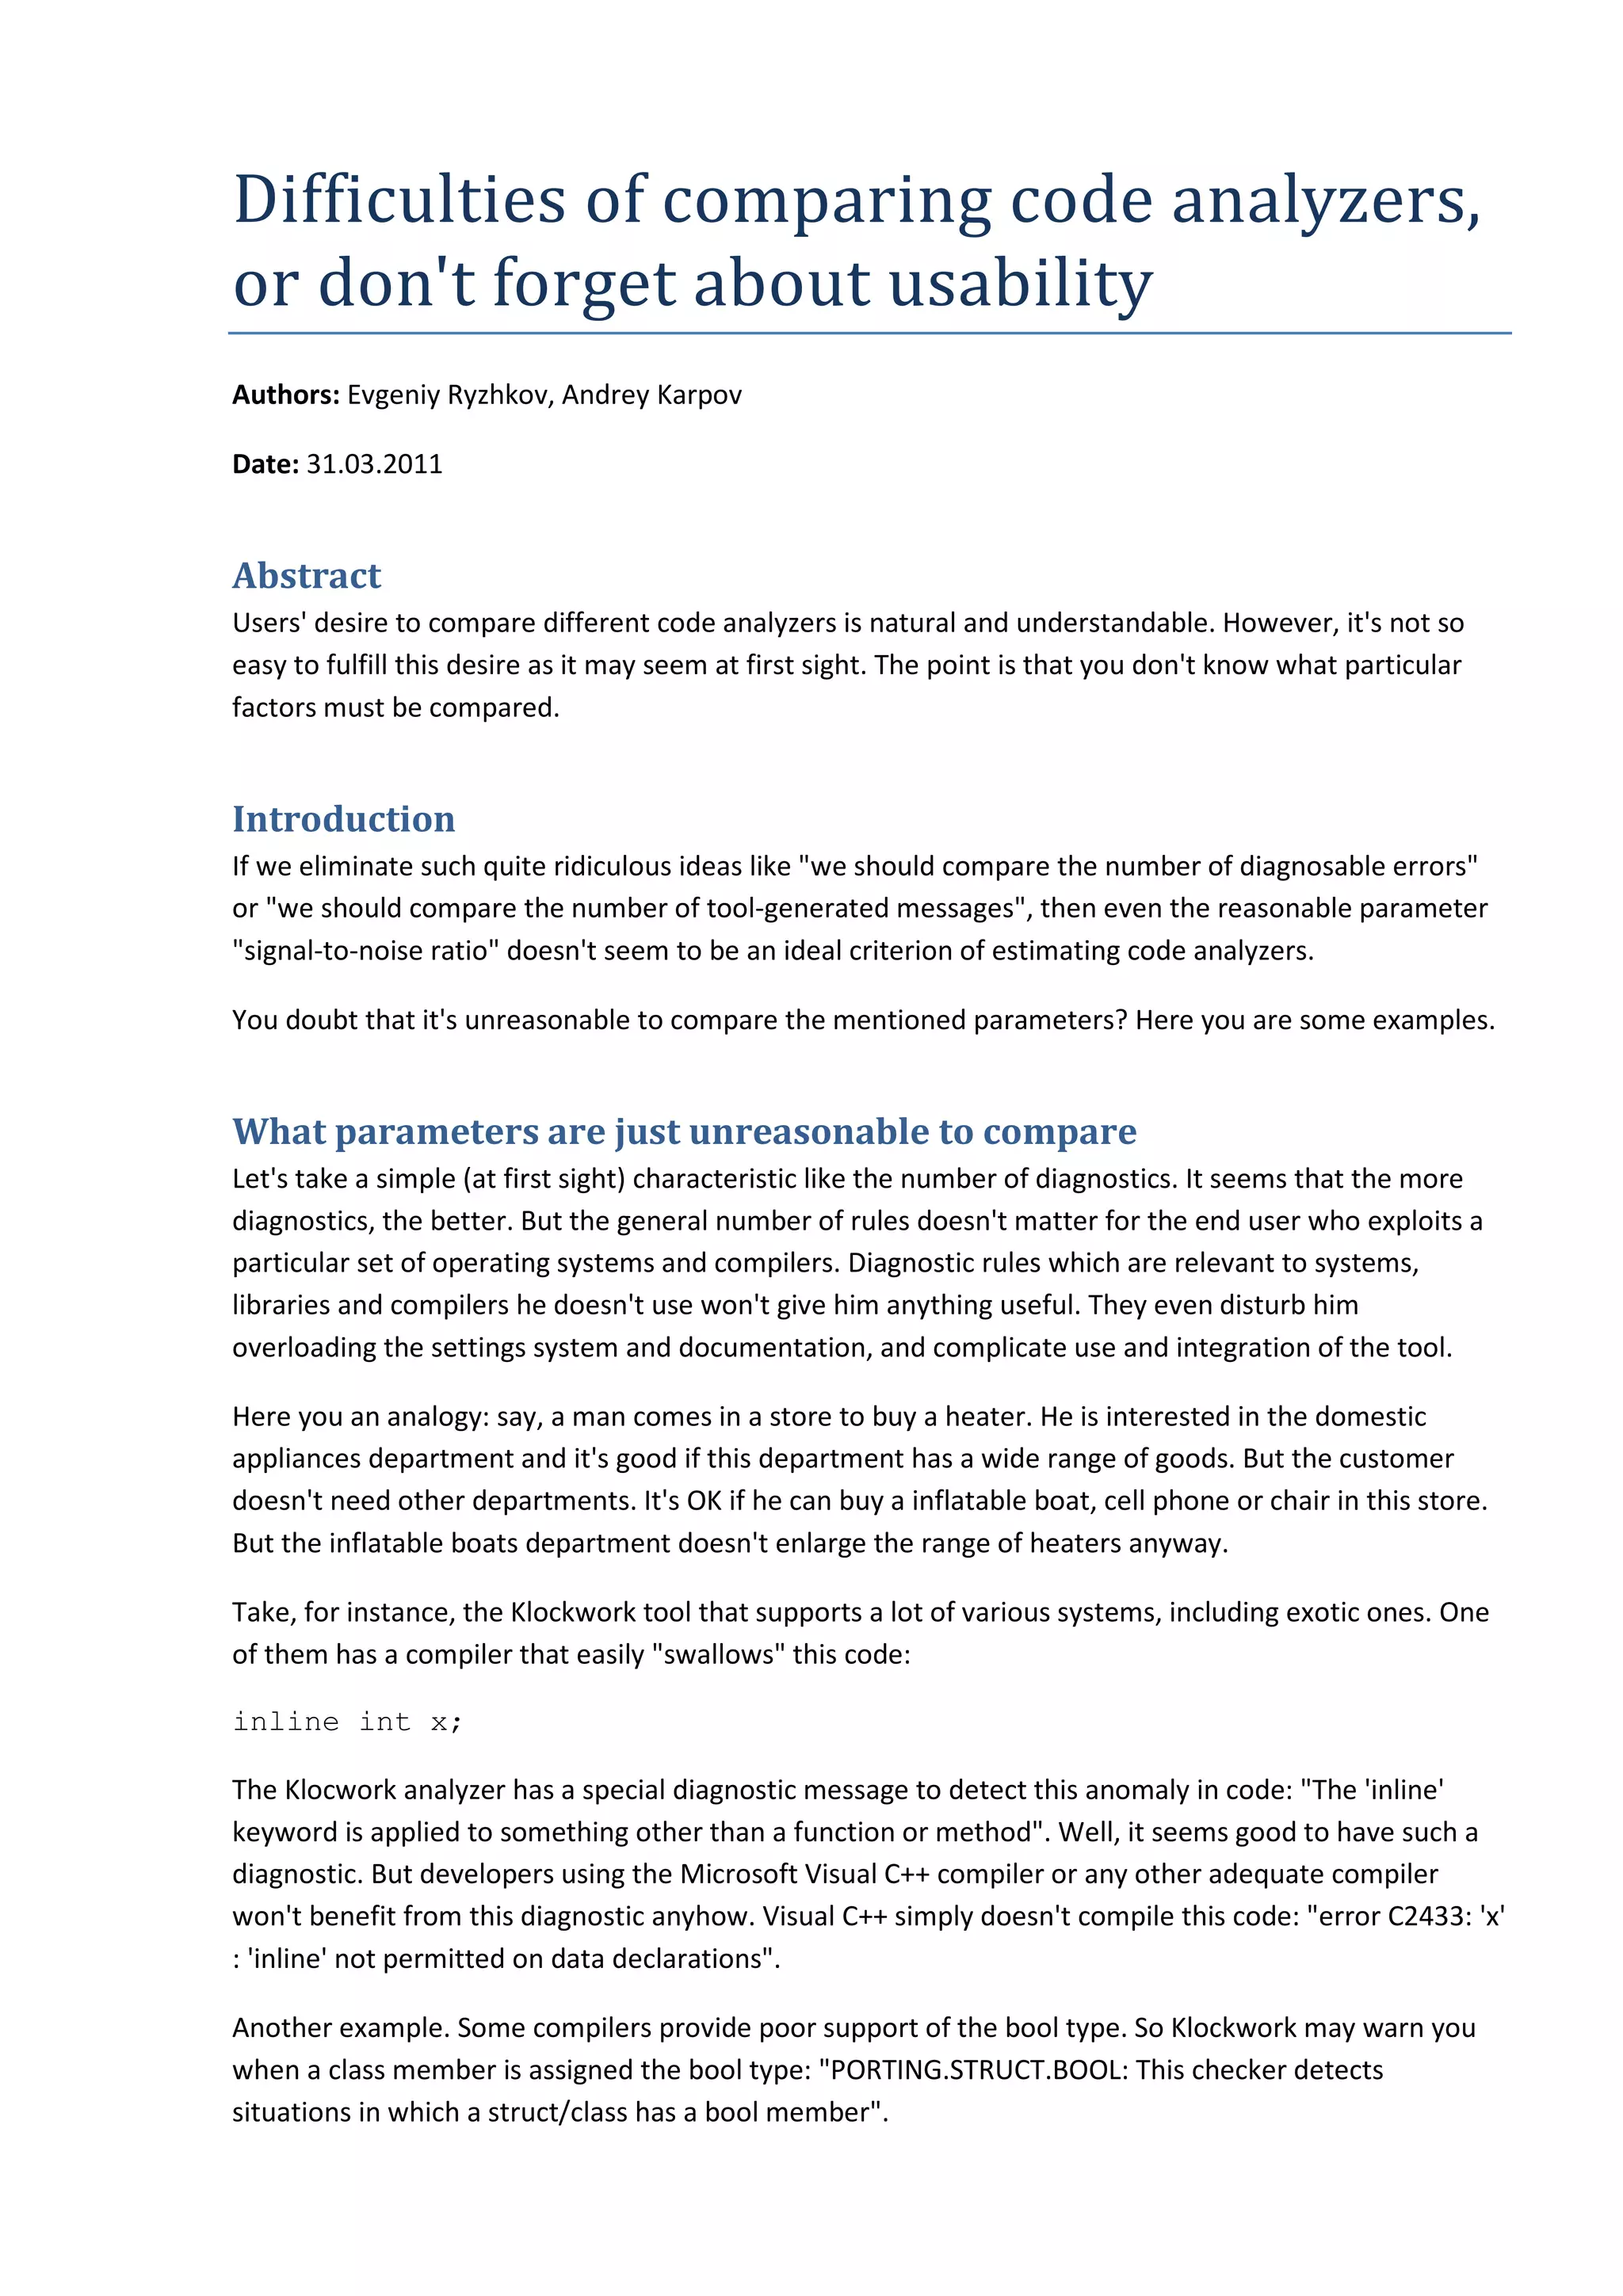
Difficulties of comparing code analyzers,
or don't forget about usability
Authors: Evgeniy Ryzhkov, Andrey Karpov

Date: 31.03.2011


Abstract
Users' desire to compare different code analyzers is natural and understandable. However, it's not so
easy to fulfill this desire as it may seem at first sight. The point is that you don't know what particular
factors must be compared.


Introduction
If we eliminate such quite ridiculous ideas like "we should compare the number of diagnosable errors"
or "we should compare the number of tool-generated messages", then even the reasonable parameter
"signal-to-noise ratio" doesn't seem to be an ideal criterion of estimating code analyzers.

You doubt that it's unreasonable to compare the mentioned parameters? Here you are some examples.


What parameters are just unreasonable to compare
Let's take a simple (at first sight) characteristic like the number of diagnostics. It seems that the more
diagnostics, the better. But the general number of rules doesn't matter for the end user who exploits a
particular set of operating systems and compilers. Diagnostic rules which are relevant to systems,
libraries and compilers he doesn't use won't give him anything useful. They even disturb him
overloading the settings system and documentation, and complicate use and integration of the tool.

Here you an analogy: say, a man comes in a store to buy a heater. He is interested in the domestic
appliances department and it's good if this department has a wide range of goods. But the customer
doesn't need other departments. It's OK if he can buy a inflatable boat, cell phone or chair in this store.
But the inflatable boats department doesn't enlarge the range of heaters anyway.

Take, for instance, the Klockwork tool that supports a lot of various systems, including exotic ones. One
of them has a compiler that easily "swallows" this code:

inline int x;

The Klocwork analyzer has a special diagnostic message to detect this anomaly in code: "The 'inline'
keyword is applied to something other than a function or method". Well, it seems good to have such a
diagnostic. But developers using the Microsoft Visual C++ compiler or any other adequate compiler
won't benefit from this diagnostic anyhow. Visual C++ simply doesn't compile this code: "error C2433: 'x'
: 'inline' not permitted on data declarations".

Another example. Some compilers provide poor support of the bool type. So Klockwork may warn you
when a class member is assigned the bool type: "PORTING.STRUCT.BOOL: This checker detects
situations in which a struct/class has a bool member".
"They wrote bool in class! How awful..." It's clear that only few developers will benefit from having this
diagnostic message.

There are plenty of such examples. So it turns out that the number of diagnostic rules in no way is
related to the number of errors an analyzer can detect in a particular project. An analyzer implementing
100 diagnostics and intended for Windows-applications can find much more errors in a project built with
Microsoft Visual Studio than a cross-platform analyzer implementing 1000 diagnostics.

The conclusion is the number of diagnostic rules cannot be relevant when comparing analyzers by
usability.

You may say: "OK, let's compare the number of diagnostics relevant for a particular system then. For
instance, let's single out all the rules to search for errors in Windows-applications". But this approach
doesn't work either. There are two reasons for that:

First, it may be that some diagnostic is implemented in one diagnostic rule in some analyzer and in
several rules in some other analyzer. If you compare them by the number of diagnostics, the latter
analyzer seems better although they both have the same functional to detect a certain type of errors.

Second, implementation of certain diagnostics may be of different quality. For instance, nearly all the
analyzers have the search of "magic numbers". But, say, some analyzer can detect only magic numbers
dangerous from the viewpoint of code migration to 64-bit systems (4, 8, 32, etc) and some other simply
detects all the magic numbers (1, 2, 3, etc). So it won't do if we only write a plus mark for each analyzer
in the comparison table.

They also like to take the characteristic of tool's speed or number of code lines processessed per second.
But it's unreasonable from the viewpoint of practice either. There is no relation between the speed of a
code analyzer and speed of analysis performed by man! First, code analysis is often launched
automatically during night builds. You just must "be in time" for the morning. And second, they often
forget about the usability parameter when comparing analyzers. Well, let's study this issue in detail.


Tool's usability is very important for adequate comparison
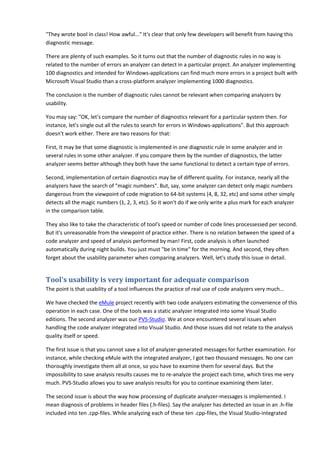
The point is that usability of a tool influences the practice of real use of code analyzers very much...

We have checked the eMule project recently with two code analyzers estimating the convenience of this
operation in each case. One of the tools was a static analyzer integrated into some Visual Studio
editions. The second analyzer was our PVS-Studio. We at once encountered several issues when
handling the code analyzer integrated into Visual Studio. And those issues did not relate to the analysis
quality itself or speed.

The first issue is that you cannot save a list of analyzer-generated messages for further examination. For
instance, while checking eMule with the integrated analyzer, I got two thousand messages. No one can
thoroughly investigate them all at once, so you have to examine them for several days. But the
impossibility to save analysis results causes me to re-analyze the project each time, which tires me very
much. PVS-Studio allows you to save analysis results for you to continue examining them later.

The second issue is about the way how processing of duplicate analyzer-messages is implemented. I
mean diagnosis of problems in header files (.h-files). Say the analyzer has detected an issue in an .h-file
included into ten .cpp-files. While analyzing each of these ten .cpp-files, the Visual Studio-integrated
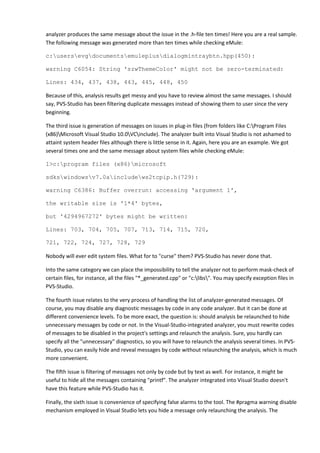
analyzer produces the same message about the issue in the .h-file ten times! Here you are a real sample.
The following message was generated more than ten times while checking eMule:

c:usersevgdocumentsemuleplusdialogmintraybtn.hpp(450):

warning C6054: String 'szwThemeColor' might not be zero-terminated:

Lines: 434, 437, 438, 443, 445, 448, 450

Because of this, analysis results get messy and you have to review almost the same messages. I should
say, PVS-Studio has been filtering duplicate messages instead of showing them to user since the very
beginning.

The third issue is generation of messages on issues in plug-in files (from folders like C:Program Files
(x86)Microsoft Visual Studio 10.0VCinclude). The analyzer built into Visual Studio is not ashamed to
attaint system header files although there is little sense in it. Again, here you are an example. We got
several times one and the same message about system files while checking eMule:

1>c:program files (x86)microsoft

sdkswindowsv7.0aincludews2tcpip.h(729):

warning C6386: Buffer overrun: accessing 'argument 1',

the writable size is '1*4' bytes,

but '4294967272' bytes might be written:

Lines: 703, 704, 705, 707, 713, 714, 715, 720,

721, 722, 724, 727, 728, 729

Nobody will ever edit system files. What for to "curse" them? PVS-Studio has never done that.

Into the same category we can place the impossibility to tell the analyzer not to perform mask-check of
certain files, for instance, all the files "*_generated.cpp" or "c:libs". You may specify exception files in
PVS-Studio.

The fourth issue relates to the very process of handling the list of analyzer-generated messages. Of
course, you may disable any diagnostic messages by code in any code analyzer. But it can be done at
different convenience levels. To be more exact, the question is: should analysis be relaunched to hide
unnecessary messages by code or not. In the Visual-Studio-integrated analyzer, you must rewrite codes
of messages to be disabled in the project's settings and relaunch the analysis. Sure, you hardly can
specify all the "unnecessary" diagnostics, so you will have to relaunch the analysis several times. In PVS-
Studio, you can easily hide and reveal messages by code without relaunching the analysis, which is much
more convenient.

The fifth issue is filtering of messages not only by code but by text as well. For instance, it might be
useful to hide all the messages containing "printf". The analyzer integrated into Visual Studio doesn't
have this feature while PVS-Studio has it.

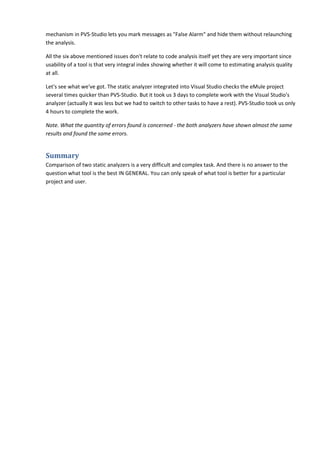
Finally, the sixth issue is convenience of specifying false alarms to the tool. The #pragma warning disable
mechanism employed in Visual Studio lets you hide a message only relaunching the analysis. The
mechanism in PVS-Studio lets you mark messages as "False Alarm" and hide them without relaunching
the analysis.

All the six above mentioned issues don't relate to code analysis itself yet they are very important since
usability of a tool is that very integral index showing whether it will come to estimating analysis quality
at all.

Let's see what we've got. The static analyzer integrated into Visual Studio checks the eMule project
several times quicker than PVS-Studio. But it took us 3 days to complete work with the Visual Studio's
analyzer (actually it was less but we had to switch to other tasks to have a rest). PVS-Studio took us only
4 hours to complete the work.

Note. What the quantity of errors found is concerned - the both analyzers have shown almost the same
results and found the same errors.


Summary
Comparison of two static analyzers is a very difficult and complex task. And there is no answer to the
question what tool is the best IN GENERAL. You can only speak of what tool is better for a particular
project and user.

More Related Content

What's hot

Cyber Defense Forensic Analyst - Real World Hands-on Examples
Cyber Defense Forensic Analyst - Real World Hands-on ExamplesCyber Defense Forensic Analyst - Real World Hands-on Examples
Cyber Defense Forensic Analyst - Real World Hands-on Examples
Sandeep Kumar Seeram
 
Analysis of PascalABC.NET using SonarQube plugins: SonarC# and PVS-Studio
Analysis of PascalABC.NET using SonarQube plugins: SonarC# and PVS-StudioAnalysis of PascalABC.NET using SonarQube plugins: SonarC# and PVS-Studio
Analysis of PascalABC.NET using SonarQube plugins: SonarC# and PVS-Studio
PVS-Studio
 
Lesson 7. The issues of detecting 64-bit errors
Lesson 7. The issues of detecting 64-bit errorsLesson 7. The issues of detecting 64-bit errors
Lesson 7. The issues of detecting 64-bit errors
PVS-Studio
 
Testing parallel programs
Testing parallel programsTesting parallel programs
Testing parallel programs
PVS-Studio
 
Use of Cell Block As An Indent Space In Python
Use of Cell Block As An Indent Space In PythonUse of Cell Block As An Indent Space In Python
Use of Cell Block As An Indent Space In Python
Waqas Tariq
 
Production Debugging at Code Camp Philly
Production Debugging at Code Camp PhillyProduction Debugging at Code Camp Philly
Production Debugging at Code Camp Philly
Brian Lyttle
 
Looking for Bugs in MonoDevelop
Looking for Bugs in MonoDevelopLooking for Bugs in MonoDevelop
Looking for Bugs in MonoDevelop
PVS-Studio
 
Exploit Frameworks
Exploit FrameworksExploit Frameworks
Exploit Frameworks
phanleson
 
Half-automatic Compilable Source Code Recovery
Half-automatic Compilable Source Code RecoveryHalf-automatic Compilable Source Code Recovery
Half-automatic Compilable Source Code Recovery
Joxean Koret
 
Information sheet PVS-Studio
Information sheet PVS-StudioInformation sheet PVS-Studio
Information sheet PVS-Studio
PVS-Studio
 
Static and Dynamic Code Analysis
Static and Dynamic Code AnalysisStatic and Dynamic Code Analysis
Static and Dynamic Code Analysis
Andrey Karpov
 
Detection of vulnerabilities in programs with the help of code analyzers
Detection of vulnerabilities in programs with the help of code analyzersDetection of vulnerabilities in programs with the help of code analyzers
Detection of vulnerabilities in programs with the help of code analyzers
PVS-Studio
 
Breaking av software
Breaking av softwareBreaking av software
Breaking av software
Thomas Pollet
 
Wcre2009 bettenburg
Wcre2009 bettenburgWcre2009 bettenburg
Wcre2009 bettenburg
SAIL_QU
 
Tizen: Summing Up
Tizen: Summing UpTizen: Summing Up
Tizen: Summing Up
PVS-Studio
 
Creation of a Test Bed Environment for Core Java Applications using White Box...
Creation of a Test Bed Environment for Core Java Applications using White Box...Creation of a Test Bed Environment for Core Java Applications using White Box...
Creation of a Test Bed Environment for Core Java Applications using White Box...
cscpconf
 
On the Use of Static Analysis to Safeguard Recursive Dependency Resolution
On the Use of Static Analysis to Safeguard Recursive Dependency ResolutionOn the Use of Static Analysis to Safeguard Recursive Dependency Resolution
On the Use of Static Analysis to Safeguard Recursive Dependency Resolution
Kamil Jezek
 
Understanding Log Lines using Development Knowledge
Understanding Log Lines using Development KnowledgeUnderstanding Log Lines using Development Knowledge
Understanding Log Lines using Development Knowledge
SAIL_QU
 
nullcon 2011 - Reversing MicroSoft patches to reveal vulnerable code
nullcon 2011 - Reversing MicroSoft patches to reveal vulnerable codenullcon 2011 - Reversing MicroSoft patches to reveal vulnerable code
nullcon 2011 - Reversing MicroSoft patches to reveal vulnerable code
n|u - The Open Security Community
 

What's hot (19)

Cyber Defense Forensic Analyst - Real World Hands-on Examples
Cyber Defense Forensic Analyst - Real World Hands-on ExamplesCyber Defense Forensic Analyst - Real World Hands-on Examples
Cyber Defense Forensic Analyst - Real World Hands-on Examples
 
Analysis of PascalABC.NET using SonarQube plugins: SonarC# and PVS-Studio
Analysis of PascalABC.NET using SonarQube plugins: SonarC# and PVS-StudioAnalysis of PascalABC.NET using SonarQube plugins: SonarC# and PVS-Studio
Analysis of PascalABC.NET using SonarQube plugins: SonarC# and PVS-Studio
 
Lesson 7. The issues of detecting 64-bit errors
Lesson 7. The issues of detecting 64-bit errorsLesson 7. The issues of detecting 64-bit errors
Lesson 7. The issues of detecting 64-bit errors
 
Testing parallel programs
Testing parallel programsTesting parallel programs
Testing parallel programs
 
Use of Cell Block As An Indent Space In Python
Use of Cell Block As An Indent Space In PythonUse of Cell Block As An Indent Space In Python
Use of Cell Block As An Indent Space In Python
 
Production Debugging at Code Camp Philly
Production Debugging at Code Camp PhillyProduction Debugging at Code Camp Philly
Production Debugging at Code Camp Philly
 
Looking for Bugs in MonoDevelop
Looking for Bugs in MonoDevelopLooking for Bugs in MonoDevelop
Looking for Bugs in MonoDevelop
 
Exploit Frameworks
Exploit FrameworksExploit Frameworks
Exploit Frameworks
 
Half-automatic Compilable Source Code Recovery
Half-automatic Compilable Source Code RecoveryHalf-automatic Compilable Source Code Recovery
Half-automatic Compilable Source Code Recovery
 
Information sheet PVS-Studio
Information sheet PVS-StudioInformation sheet PVS-Studio
Information sheet PVS-Studio
 
Static and Dynamic Code Analysis
Static and Dynamic Code AnalysisStatic and Dynamic Code Analysis
Static and Dynamic Code Analysis
 
Detection of vulnerabilities in programs with the help of code analyzers
Detection of vulnerabilities in programs with the help of code analyzersDetection of vulnerabilities in programs with the help of code analyzers
Detection of vulnerabilities in programs with the help of code analyzers
 
Breaking av software
Breaking av softwareBreaking av software
Breaking av software
 
Wcre2009 bettenburg
Wcre2009 bettenburgWcre2009 bettenburg
Wcre2009 bettenburg
 
Tizen: Summing Up
Tizen: Summing UpTizen: Summing Up
Tizen: Summing Up
 
Creation of a Test Bed Environment for Core Java Applications using White Box...
Creation of a Test Bed Environment for Core Java Applications using White Box...Creation of a Test Bed Environment for Core Java Applications using White Box...
Creation of a Test Bed Environment for Core Java Applications using White Box...
 
On the Use of Static Analysis to Safeguard Recursive Dependency Resolution
On the Use of Static Analysis to Safeguard Recursive Dependency ResolutionOn the Use of Static Analysis to Safeguard Recursive Dependency Resolution
On the Use of Static Analysis to Safeguard Recursive Dependency Resolution
 
Understanding Log Lines using Development Knowledge
Understanding Log Lines using Development KnowledgeUnderstanding Log Lines using Development Knowledge
Understanding Log Lines using Development Knowledge
 
nullcon 2011 - Reversing MicroSoft patches to reveal vulnerable code
nullcon 2011 - Reversing MicroSoft patches to reveal vulnerable codenullcon 2011 - Reversing MicroSoft patches to reveal vulnerable code
nullcon 2011 - Reversing MicroSoft patches to reveal vulnerable code
 

Similar to Difficulties of comparing code analyzers, or don't forget about usability

PVS-Studio for Visual C++
PVS-Studio for Visual C++PVS-Studio for Visual C++
PVS-Studio for Visual C++
Andrey Karpov
 
Comparing static analysis in Visual Studio 2012 (Visual C++ 2012) and PVS-Studio
Comparing static analysis in Visual Studio 2012 (Visual C++ 2012) and PVS-StudioComparing static analysis in Visual Studio 2012 (Visual C++ 2012) and PVS-Studio
Comparing static analysis in Visual Studio 2012 (Visual C++ 2012) and PVS-Studio
PVS-Studio
 
If the coding bug is banal, it doesn't meant it's not crucial
If the coding bug is banal, it doesn't meant it's not crucialIf the coding bug is banal, it doesn't meant it's not crucial
If the coding bug is banal, it doesn't meant it's not crucial
PVS-Studio
 
Static analysis is most efficient when being used regularly. We'll tell you w...
Static analysis is most efficient when being used regularly. We'll tell you w...Static analysis is most efficient when being used regularly. We'll tell you w...
Static analysis is most efficient when being used regularly. We'll tell you w...
PVS-Studio
 
Regular use of static code analysis in team development
Regular use of static code analysis in team developmentRegular use of static code analysis in team development
Regular use of static code analysis in team development
PVS-Studio
 
PVS-Studio advertisement - static analysis of C/C++ code
PVS-Studio advertisement - static analysis of C/C++ codePVS-Studio advertisement - static analysis of C/C++ code
PVS-Studio advertisement - static analysis of C/C++ code
PVS-Studio
 
Regular use of static code analysis in team development
Regular use of static code analysis in team developmentRegular use of static code analysis in team development
Regular use of static code analysis in team development
PVS-Studio
 
Regular use of static code analysis in team development
Regular use of static code analysis in team developmentRegular use of static code analysis in team development
Regular use of static code analysis in team development
Andrey Karpov
 
How we test the code analyzer
How we test the code analyzerHow we test the code analyzer
How we test the code analyzer
PVS-Studio
 
Static Analysis: From Getting Started to Integration
Static Analysis: From Getting Started to IntegrationStatic Analysis: From Getting Started to Integration
Static Analysis: From Getting Started to Integration
Andrey Karpov
 
War of the Machines: PVS-Studio vs. TensorFlow
War of the Machines: PVS-Studio vs. TensorFlowWar of the Machines: PVS-Studio vs. TensorFlow
War of the Machines: PVS-Studio vs. TensorFlow
PVS-Studio
 
Diving into VS 2015 Day2
Diving into VS 2015 Day2Diving into VS 2015 Day2
Diving into VS 2015 Day2
Akhil Mittal
 
How we test the code analyzer
How we test the code analyzerHow we test the code analyzer
How we test the code analyzer
PVS-Studio
 
An ideal static analyzer, or why ideals are unachievable
An ideal static analyzer, or why ideals are unachievableAn ideal static analyzer, or why ideals are unachievable
An ideal static analyzer, or why ideals are unachievable
PVS-Studio
 
0136 ideal static_analyzer
0136 ideal static_analyzer0136 ideal static_analyzer
0136 ideal static_analyzer
PVS-Studio
 
Static analysis as part of the development process in Unreal Engine
Static analysis as part of the development process in Unreal EngineStatic analysis as part of the development process in Unreal Engine
Static analysis as part of the development process in Unreal Engine
PVS-Studio
 
PVS-Studio Has Finally Got to Boost
PVS-Studio Has Finally Got to BoostPVS-Studio Has Finally Got to Boost
PVS-Studio Has Finally Got to Boost
Andrey Karpov
 
New Year PVS-Studio 6.00 Release: Scanning Roslyn
New Year PVS-Studio 6.00 Release: Scanning RoslynNew Year PVS-Studio 6.00 Release: Scanning Roslyn
New Year PVS-Studio 6.00 Release: Scanning Roslyn
PVS-Studio
 
Searching for bugs in Mono: there are hundreds of them!
Searching for bugs in Mono: there are hundreds of them!Searching for bugs in Mono: there are hundreds of them!
Searching for bugs in Mono: there are hundreds of them!
PVS-Studio
 
How to Improve Visual C++ 2017 Libraries Using PVS-Studio
How to Improve Visual C++ 2017 Libraries Using PVS-StudioHow to Improve Visual C++ 2017 Libraries Using PVS-Studio
How to Improve Visual C++ 2017 Libraries Using PVS-Studio
PVS-Studio
 

Similar to Difficulties of comparing code analyzers, or don't forget about usability (20)

PVS-Studio for Visual C++
PVS-Studio for Visual C++PVS-Studio for Visual C++
PVS-Studio for Visual C++
 
Comparing static analysis in Visual Studio 2012 (Visual C++ 2012) and PVS-Studio
Comparing static analysis in Visual Studio 2012 (Visual C++ 2012) and PVS-StudioComparing static analysis in Visual Studio 2012 (Visual C++ 2012) and PVS-Studio
Comparing static analysis in Visual Studio 2012 (Visual C++ 2012) and PVS-Studio
 
If the coding bug is banal, it doesn't meant it's not crucial
If the coding bug is banal, it doesn't meant it's not crucialIf the coding bug is banal, it doesn't meant it's not crucial
If the coding bug is banal, it doesn't meant it's not crucial
 
Static analysis is most efficient when being used regularly. We'll tell you w...
Static analysis is most efficient when being used regularly. We'll tell you w...Static analysis is most efficient when being used regularly. We'll tell you w...
Static analysis is most efficient when being used regularly. We'll tell you w...
 
Regular use of static code analysis in team development
Regular use of static code analysis in team developmentRegular use of static code analysis in team development
Regular use of static code analysis in team development
 
PVS-Studio advertisement - static analysis of C/C++ code
PVS-Studio advertisement - static analysis of C/C++ codePVS-Studio advertisement - static analysis of C/C++ code
PVS-Studio advertisement - static analysis of C/C++ code
 
Regular use of static code analysis in team development
Regular use of static code analysis in team developmentRegular use of static code analysis in team development
Regular use of static code analysis in team development
 
Regular use of static code analysis in team development
Regular use of static code analysis in team developmentRegular use of static code analysis in team development
Regular use of static code analysis in team development
 
How we test the code analyzer
How we test the code analyzerHow we test the code analyzer
How we test the code analyzer
 
Static Analysis: From Getting Started to Integration
Static Analysis: From Getting Started to IntegrationStatic Analysis: From Getting Started to Integration
Static Analysis: From Getting Started to Integration
 
War of the Machines: PVS-Studio vs. TensorFlow
War of the Machines: PVS-Studio vs. TensorFlowWar of the Machines: PVS-Studio vs. TensorFlow
War of the Machines: PVS-Studio vs. TensorFlow
 
Diving into VS 2015 Day2
Diving into VS 2015 Day2Diving into VS 2015 Day2
Diving into VS 2015 Day2
 
How we test the code analyzer
How we test the code analyzerHow we test the code analyzer
How we test the code analyzer
 
An ideal static analyzer, or why ideals are unachievable
An ideal static analyzer, or why ideals are unachievableAn ideal static analyzer, or why ideals are unachievable
An ideal static analyzer, or why ideals are unachievable
 
0136 ideal static_analyzer
0136 ideal static_analyzer0136 ideal static_analyzer
0136 ideal static_analyzer
 
Static analysis as part of the development process in Unreal Engine
Static analysis as part of the development process in Unreal EngineStatic analysis as part of the development process in Unreal Engine
Static analysis as part of the development process in Unreal Engine
 
PVS-Studio Has Finally Got to Boost
PVS-Studio Has Finally Got to BoostPVS-Studio Has Finally Got to Boost
PVS-Studio Has Finally Got to Boost
 
New Year PVS-Studio 6.00 Release: Scanning Roslyn
New Year PVS-Studio 6.00 Release: Scanning RoslynNew Year PVS-Studio 6.00 Release: Scanning Roslyn
New Year PVS-Studio 6.00 Release: Scanning Roslyn
 
Searching for bugs in Mono: there are hundreds of them!
Searching for bugs in Mono: there are hundreds of them!Searching for bugs in Mono: there are hundreds of them!
Searching for bugs in Mono: there are hundreds of them!
 
How to Improve Visual C++ 2017 Libraries Using PVS-Studio
How to Improve Visual C++ 2017 Libraries Using PVS-StudioHow to Improve Visual C++ 2017 Libraries Using PVS-Studio
How to Improve Visual C++ 2017 Libraries Using PVS-Studio
 

Recently uploaded

Energy Efficient Video Encoding for Cloud and Edge Computing Instances
Energy Efficient Video Encoding for Cloud and Edge Computing InstancesEnergy Efficient Video Encoding for Cloud and Edge Computing Instances
Energy Efficient Video Encoding for Cloud and Edge Computing Instances
Alpen-Adria-Universität
 
Crafting Excellence: A Comprehensive Guide to iOS Mobile App Development Serv...
Crafting Excellence: A Comprehensive Guide to iOS Mobile App Development Serv...Crafting Excellence: A Comprehensive Guide to iOS Mobile App Development Serv...
Crafting Excellence: A Comprehensive Guide to iOS Mobile App Development Serv...
Pitangent Analytics & Technology Solutions Pvt. Ltd
 
AppSec PNW: Android and iOS Application Security with MobSF
AppSec PNW: Android and iOS Application Security with MobSFAppSec PNW: Android and iOS Application Security with MobSF
AppSec PNW: Android and iOS Application Security with MobSF
Ajin Abraham
 
Generating privacy-protected synthetic data using Secludy and Milvus
Generating privacy-protected synthetic data using Secludy and MilvusGenerating privacy-protected synthetic data using Secludy and Milvus
Generating privacy-protected synthetic data using Secludy and Milvus
Zilliz
 
Apps Break Data
Apps Break DataApps Break Data
Apps Break Data
Ivo Velitchkov
 
HCL Notes und Domino Lizenzkostenreduzierung in der Welt von DLAU
HCL Notes und Domino Lizenzkostenreduzierung in der Welt von DLAUHCL Notes und Domino Lizenzkostenreduzierung in der Welt von DLAU
HCL Notes und Domino Lizenzkostenreduzierung in der Welt von DLAU
panagenda
 
Harnessing the Power of NLP and Knowledge Graphs for Opioid Research
Harnessing the Power of NLP and Knowledge Graphs for Opioid ResearchHarnessing the Power of NLP and Knowledge Graphs for Opioid Research
Harnessing the Power of NLP and Knowledge Graphs for Opioid Research
Neo4j
 
Mutation Testing for Task-Oriented Chatbots
Mutation Testing for Task-Oriented ChatbotsMutation Testing for Task-Oriented Chatbots
Mutation Testing for Task-Oriented Chatbots
Pablo Gómez Abajo
 
GNSS spoofing via SDR (Criptored Talks 2024)
GNSS spoofing via SDR (Criptored Talks 2024)GNSS spoofing via SDR (Criptored Talks 2024)
GNSS spoofing via SDR (Criptored Talks 2024)
Javier Junquera
 
Your One-Stop Shop for Python Success: Top 10 US Python Development Providers
Your One-Stop Shop for Python Success: Top 10 US Python Development ProvidersYour One-Stop Shop for Python Success: Top 10 US Python Development Providers
Your One-Stop Shop for Python Success: Top 10 US Python Development Providers
akankshawande
 
Nordic Marketo Engage User Group_June 13_ 2024.pptx
Nordic Marketo Engage User Group_June 13_ 2024.pptxNordic Marketo Engage User Group_June 13_ 2024.pptx
Nordic Marketo Engage User Group_June 13_ 2024.pptx
MichaelKnudsen27
 
HCL Notes and Domino License Cost Reduction in the World of DLAU
HCL Notes and Domino License Cost Reduction in the World of DLAUHCL Notes and Domino License Cost Reduction in the World of DLAU
HCL Notes and Domino License Cost Reduction in the World of DLAU
panagenda
 
Biomedical Knowledge Graphs for Data Scientists and Bioinformaticians
Biomedical Knowledge Graphs for Data Scientists and BioinformaticiansBiomedical Knowledge Graphs for Data Scientists and Bioinformaticians
Biomedical Knowledge Graphs for Data Scientists and Bioinformaticians
Neo4j
 
Programming Foundation Models with DSPy - Meetup Slides
Programming Foundation Models with DSPy - Meetup SlidesProgramming Foundation Models with DSPy - Meetup Slides
Programming Foundation Models with DSPy - Meetup Slides
Zilliz
 
Astute Business Solutions | Oracle Cloud Partner |
Astute Business Solutions | Oracle Cloud Partner |Astute Business Solutions | Oracle Cloud Partner |
Astute Business Solutions | Oracle Cloud Partner |
AstuteBusiness
 
9 CEO's who hit $100m ARR Share Their Top Growth Tactics Nathan Latka, Founde...
9 CEO's who hit $100m ARR Share Their Top Growth Tactics Nathan Latka, Founde...9 CEO's who hit $100m ARR Share Their Top Growth Tactics Nathan Latka, Founde...
9 CEO's who hit $100m ARR Share Their Top Growth Tactics Nathan Latka, Founde...
saastr
 
Fueling AI with Great Data with Airbyte Webinar
Fueling AI with Great Data with Airbyte WebinarFueling AI with Great Data with Airbyte Webinar
Fueling AI with Great Data with Airbyte Webinar
Zilliz
 
“Temporal Event Neural Networks: A More Efficient Alternative to the Transfor...
“Temporal Event Neural Networks: A More Efficient Alternative to the Transfor...“Temporal Event Neural Networks: A More Efficient Alternative to the Transfor...
“Temporal Event Neural Networks: A More Efficient Alternative to the Transfor...
Edge AI and Vision Alliance
 
Columbus Data & Analytics Wednesdays - June 2024
Columbus Data & Analytics Wednesdays - June 2024Columbus Data & Analytics Wednesdays - June 2024
Columbus Data & Analytics Wednesdays - June 2024
Jason Packer
 
Leveraging the Graph for Clinical Trials and Standards
Leveraging the Graph for Clinical Trials and StandardsLeveraging the Graph for Clinical Trials and Standards
Leveraging the Graph for Clinical Trials and Standards
Neo4j
 

Recently uploaded (20)

Energy Efficient Video Encoding for Cloud and Edge Computing Instances
Energy Efficient Video Encoding for Cloud and Edge Computing InstancesEnergy Efficient Video Encoding for Cloud and Edge Computing Instances
Energy Efficient Video Encoding for Cloud and Edge Computing Instances
 
Crafting Excellence: A Comprehensive Guide to iOS Mobile App Development Serv...
Crafting Excellence: A Comprehensive Guide to iOS Mobile App Development Serv...Crafting Excellence: A Comprehensive Guide to iOS Mobile App Development Serv...
Crafting Excellence: A Comprehensive Guide to iOS Mobile App Development Serv...
 
AppSec PNW: Android and iOS Application Security with MobSF
AppSec PNW: Android and iOS Application Security with MobSFAppSec PNW: Android and iOS Application Security with MobSF
AppSec PNW: Android and iOS Application Security with MobSF
 
Generating privacy-protected synthetic data using Secludy and Milvus
Generating privacy-protected synthetic data using Secludy and MilvusGenerating privacy-protected synthetic data using Secludy and Milvus
Generating privacy-protected synthetic data using Secludy and Milvus
 
Apps Break Data
Apps Break DataApps Break Data
Apps Break Data
 
HCL Notes und Domino Lizenzkostenreduzierung in der Welt von DLAU
HCL Notes und Domino Lizenzkostenreduzierung in der Welt von DLAUHCL Notes und Domino Lizenzkostenreduzierung in der Welt von DLAU
HCL Notes und Domino Lizenzkostenreduzierung in der Welt von DLAU
 
Harnessing the Power of NLP and Knowledge Graphs for Opioid Research
Harnessing the Power of NLP and Knowledge Graphs for Opioid ResearchHarnessing the Power of NLP and Knowledge Graphs for Opioid Research
Harnessing the Power of NLP and Knowledge Graphs for Opioid Research
 
Mutation Testing for Task-Oriented Chatbots
Mutation Testing for Task-Oriented ChatbotsMutation Testing for Task-Oriented Chatbots
Mutation Testing for Task-Oriented Chatbots
 
GNSS spoofing via SDR (Criptored Talks 2024)
GNSS spoofing via SDR (Criptored Talks 2024)GNSS spoofing via SDR (Criptored Talks 2024)
GNSS spoofing via SDR (Criptored Talks 2024)
 
Your One-Stop Shop for Python Success: Top 10 US Python Development Providers
Your One-Stop Shop for Python Success: Top 10 US Python Development ProvidersYour One-Stop Shop for Python Success: Top 10 US Python Development Providers
Your One-Stop Shop for Python Success: Top 10 US Python Development Providers
 
Nordic Marketo Engage User Group_June 13_ 2024.pptx
Nordic Marketo Engage User Group_June 13_ 2024.pptxNordic Marketo Engage User Group_June 13_ 2024.pptx
Nordic Marketo Engage User Group_June 13_ 2024.pptx
 
HCL Notes and Domino License Cost Reduction in the World of DLAU
HCL Notes and Domino License Cost Reduction in the World of DLAUHCL Notes and Domino License Cost Reduction in the World of DLAU
HCL Notes and Domino License Cost Reduction in the World of DLAU
 
Biomedical Knowledge Graphs for Data Scientists and Bioinformaticians
Biomedical Knowledge Graphs for Data Scientists and BioinformaticiansBiomedical Knowledge Graphs for Data Scientists and Bioinformaticians
Biomedical Knowledge Graphs for Data Scientists and Bioinformaticians
 
Programming Foundation Models with DSPy - Meetup Slides
Programming Foundation Models with DSPy - Meetup SlidesProgramming Foundation Models with DSPy - Meetup Slides
Programming Foundation Models with DSPy - Meetup Slides
 
Astute Business Solutions | Oracle Cloud Partner |
Astute Business Solutions | Oracle Cloud Partner |Astute Business Solutions | Oracle Cloud Partner |
Astute Business Solutions | Oracle Cloud Partner |
 
9 CEO's who hit $100m ARR Share Their Top Growth Tactics Nathan Latka, Founde...
9 CEO's who hit $100m ARR Share Their Top Growth Tactics Nathan Latka, Founde...9 CEO's who hit $100m ARR Share Their Top Growth Tactics Nathan Latka, Founde...
9 CEO's who hit $100m ARR Share Their Top Growth Tactics Nathan Latka, Founde...
 
Fueling AI with Great Data with Airbyte Webinar
Fueling AI with Great Data with Airbyte WebinarFueling AI with Great Data with Airbyte Webinar
Fueling AI with Great Data with Airbyte Webinar
 
“Temporal Event Neural Networks: A More Efficient Alternative to the Transfor...
“Temporal Event Neural Networks: A More Efficient Alternative to the Transfor...“Temporal Event Neural Networks: A More Efficient Alternative to the Transfor...
“Temporal Event Neural Networks: A More Efficient Alternative to the Transfor...
 
Columbus Data & Analytics Wednesdays - June 2024
Columbus Data & Analytics Wednesdays - June 2024Columbus Data & Analytics Wednesdays - June 2024
Columbus Data & Analytics Wednesdays - June 2024
 
Leveraging the Graph for Clinical Trials and Standards
Leveraging the Graph for Clinical Trials and StandardsLeveraging the Graph for Clinical Trials and Standards
Leveraging the Graph for Clinical Trials and Standards
 

Difficulties of comparing code analyzers, or don't forget about usability

  • 1. Difficulties of comparing code analyzers, or don't forget about usability Authors: Evgeniy Ryzhkov, Andrey Karpov Date: 31.03.2011 Abstract Users' desire to compare different code analyzers is natural and understandable. However, it's not so easy to fulfill this desire as it may seem at first sight. The point is that you don't know what particular factors must be compared. Introduction If we eliminate such quite ridiculous ideas like "we should compare the number of diagnosable errors" or "we should compare the number of tool-generated messages", then even the reasonable parameter "signal-to-noise ratio" doesn't seem to be an ideal criterion of estimating code analyzers. You doubt that it's unreasonable to compare the mentioned parameters? Here you are some examples. What parameters are just unreasonable to compare Let's take a simple (at first sight) characteristic like the number of diagnostics. It seems that the more diagnostics, the better. But the general number of rules doesn't matter for the end user who exploits a particular set of operating systems and compilers. Diagnostic rules which are relevant to systems, libraries and compilers he doesn't use won't give him anything useful. They even disturb him overloading the settings system and documentation, and complicate use and integration of the tool. Here you an analogy: say, a man comes in a store to buy a heater. He is interested in the domestic appliances department and it's good if this department has a wide range of goods. But the customer doesn't need other departments. It's OK if he can buy a inflatable boat, cell phone or chair in this store. But the inflatable boats department doesn't enlarge the range of heaters anyway. Take, for instance, the Klockwork tool that supports a lot of various systems, including exotic ones. One of them has a compiler that easily "swallows" this code: inline int x; The Klocwork analyzer has a special diagnostic message to detect this anomaly in code: "The 'inline' keyword is applied to something other than a function or method". Well, it seems good to have such a diagnostic. But developers using the Microsoft Visual C++ compiler or any other adequate compiler won't benefit from this diagnostic anyhow. Visual C++ simply doesn't compile this code: "error C2433: 'x' : 'inline' not permitted on data declarations". Another example. Some compilers provide poor support of the bool type. So Klockwork may warn you when a class member is assigned the bool type: "PORTING.STRUCT.BOOL: This checker detects situations in which a struct/class has a bool member".
  • 2. "They wrote bool in class! How awful..." It's clear that only few developers will benefit from having this diagnostic message. There are plenty of such examples. So it turns out that the number of diagnostic rules in no way is related to the number of errors an analyzer can detect in a particular project. An analyzer implementing 100 diagnostics and intended for Windows-applications can find much more errors in a project built with Microsoft Visual Studio than a cross-platform analyzer implementing 1000 diagnostics. The conclusion is the number of diagnostic rules cannot be relevant when comparing analyzers by usability. You may say: "OK, let's compare the number of diagnostics relevant for a particular system then. For instance, let's single out all the rules to search for errors in Windows-applications". But this approach doesn't work either. There are two reasons for that: First, it may be that some diagnostic is implemented in one diagnostic rule in some analyzer and in several rules in some other analyzer. If you compare them by the number of diagnostics, the latter analyzer seems better although they both have the same functional to detect a certain type of errors. Second, implementation of certain diagnostics may be of different quality. For instance, nearly all the analyzers have the search of "magic numbers". But, say, some analyzer can detect only magic numbers dangerous from the viewpoint of code migration to 64-bit systems (4, 8, 32, etc) and some other simply detects all the magic numbers (1, 2, 3, etc). So it won't do if we only write a plus mark for each analyzer in the comparison table. They also like to take the characteristic of tool's speed or number of code lines processessed per second. But it's unreasonable from the viewpoint of practice either. There is no relation between the speed of a code analyzer and speed of analysis performed by man! First, code analysis is often launched automatically during night builds. You just must "be in time" for the morning. And second, they often forget about the usability parameter when comparing analyzers. Well, let's study this issue in detail. Tool's usability is very important for adequate comparison The point is that usability of a tool influences the practice of real use of code analyzers very much... We have checked the eMule project recently with two code analyzers estimating the convenience of this operation in each case. One of the tools was a static analyzer integrated into some Visual Studio editions. The second analyzer was our PVS-Studio. We at once encountered several issues when handling the code analyzer integrated into Visual Studio. And those issues did not relate to the analysis quality itself or speed. The first issue is that you cannot save a list of analyzer-generated messages for further examination. For instance, while checking eMule with the integrated analyzer, I got two thousand messages. No one can thoroughly investigate them all at once, so you have to examine them for several days. But the impossibility to save analysis results causes me to re-analyze the project each time, which tires me very much. PVS-Studio allows you to save analysis results for you to continue examining them later. The second issue is about the way how processing of duplicate analyzer-messages is implemented. I mean diagnosis of problems in header files (.h-files). Say the analyzer has detected an issue in an .h-file included into ten .cpp-files. While analyzing each of these ten .cpp-files, the Visual Studio-integrated
  • 3. analyzer produces the same message about the issue in the .h-file ten times! Here you are a real sample. The following message was generated more than ten times while checking eMule: c:usersevgdocumentsemuleplusdialogmintraybtn.hpp(450): warning C6054: String 'szwThemeColor' might not be zero-terminated: Lines: 434, 437, 438, 443, 445, 448, 450 Because of this, analysis results get messy and you have to review almost the same messages. I should say, PVS-Studio has been filtering duplicate messages instead of showing them to user since the very beginning. The third issue is generation of messages on issues in plug-in files (from folders like C:Program Files (x86)Microsoft Visual Studio 10.0VCinclude). The analyzer built into Visual Studio is not ashamed to attaint system header files although there is little sense in it. Again, here you are an example. We got several times one and the same message about system files while checking eMule: 1>c:program files (x86)microsoft sdkswindowsv7.0aincludews2tcpip.h(729): warning C6386: Buffer overrun: accessing 'argument 1', the writable size is '1*4' bytes, but '4294967272' bytes might be written: Lines: 703, 704, 705, 707, 713, 714, 715, 720, 721, 722, 724, 727, 728, 729 Nobody will ever edit system files. What for to "curse" them? PVS-Studio has never done that. Into the same category we can place the impossibility to tell the analyzer not to perform mask-check of certain files, for instance, all the files "*_generated.cpp" or "c:libs". You may specify exception files in PVS-Studio. The fourth issue relates to the very process of handling the list of analyzer-generated messages. Of course, you may disable any diagnostic messages by code in any code analyzer. But it can be done at different convenience levels. To be more exact, the question is: should analysis be relaunched to hide unnecessary messages by code or not. In the Visual-Studio-integrated analyzer, you must rewrite codes of messages to be disabled in the project's settings and relaunch the analysis. Sure, you hardly can specify all the "unnecessary" diagnostics, so you will have to relaunch the analysis several times. In PVS- Studio, you can easily hide and reveal messages by code without relaunching the analysis, which is much more convenient. The fifth issue is filtering of messages not only by code but by text as well. For instance, it might be useful to hide all the messages containing "printf". The analyzer integrated into Visual Studio doesn't have this feature while PVS-Studio has it. Finally, the sixth issue is convenience of specifying false alarms to the tool. The #pragma warning disable mechanism employed in Visual Studio lets you hide a message only relaunching the analysis. The
  • 4. mechanism in PVS-Studio lets you mark messages as "False Alarm" and hide them without relaunching the analysis. All the six above mentioned issues don't relate to code analysis itself yet they are very important since usability of a tool is that very integral index showing whether it will come to estimating analysis quality at all. Let's see what we've got. The static analyzer integrated into Visual Studio checks the eMule project several times quicker than PVS-Studio. But it took us 3 days to complete work with the Visual Studio's analyzer (actually it was less but we had to switch to other tasks to have a rest). PVS-Studio took us only 4 hours to complete the work. Note. What the quantity of errors found is concerned - the both analyzers have shown almost the same results and found the same errors. Summary Comparison of two static analyzers is a very difficult and complex task. And there is no answer to the question what tool is the best IN GENERAL. You can only speak of what tool is better for a particular project and user.