This document summarizes a study on water and cation movement in an Indonesian Ultisol. The study characterized the soil's hydraulic properties and internal drainage, finding that nearly 94% of applied water drained below 112.5 cm depth within 6 hours. Macropores accounted for 26-40% of topsoil porosity and facilitated this drainage. A field experiment examined cation levels and movement over 2 years under different fertilization and residue removal treatments. Results showed 1% of applied K, 5% of applied Ca, and 24% of applied Mg accumulated in the 30-90 cm depth, while 33% of applied K, 26% of applied Ca, and 8% of applied Mg were unaccounted for and likely leached below

![Water and Cation Movementin an Indonesian Ultisol
ThomasS Dierolf, Lalit M. Arya, and Russell S. Yost*
ABSTRACT
Limeandfertilizer are requiredto overcomeacidity andsoil fertility
constraints to cropproductionin the highly weatheredsoils of Sitiung,
Indonesia. The potential leaching of soil amendmentsis enhancedby
the high annual rainfall of 2750 mmand the low effective cation
exchange capacity (ECEC)of these soils. Thepurpose of this study
wasto understand the relationship of soil water hydrology to the
fate of applied soil amendments.Internal soil waterdrainage (field-
measured) andsoil moisture release curves (field- andlaboratory-
measured)weredeterminedto characterize the soil hydraulic proper-
ties of a clayey, kaolinitic, isohyperthermicTypic Kanhapludult.The
results indicated that 6 h after the application of 72.5 mmof water
during a ]00-min period, water equivalent to nearly 94%of the applied
water drained to depths below 112.5 cm. Macroporevolumeaccounted
for 26 to 40%of the total porosity of the top 22.5 cmof soil and5
to 7%in the 22.5- to 112.5-cm depth. Cation movementwas measured
during a 2-yr period in a field experimentthat examinedthe effects
of various rates andtimingof K fertilization (and blanket applications
of Ca and Mg)and stover removal on soil K, Ca, and Mgpools.
Results show that amountsequivalent to 1%of the K, 5%of the Ca,
and24%of the Mgthat were applied as fertilizer nutrients accumu-
lated in the 30- to 90-cmdepth. Anaverage of 33%of the K, 26%
of the Ca, and8%of the Mgapplied as fertilizers werenot accounted
for in the soil or by crop biomass and probably leached below the
90-cmdepth. Weconclude that is difficult to chemically ameliorate
the subsoil below the 30-cm depth and hypothesize that macropore
flow through the soil and a continually wet subsoil are the major
factors limiting subsoil cation accumulation.
Basic CA37~ONSare usually lowin the highly weathered,
acid soils of the humidtropics and replenishing the
soil cation pool with lime and fertilizers is relatively
costly. Improperly managedagricultural systems result
in the inefficient use or loss of soil cations through
excessive removal in biomass and from leaching losses
(Gill and Kamprath, 1990; Wonget al., 1992). In some
cases, base cation leaching is desirable whenthe depth
of rooting of Al-sensitive crops is limited by a high Al-
saturated subsoil. Calciumaccumulation can reduce the
effects of subsoil acidity, thus allowing deeper crop root
growth to tap subsoil water during periods of surface
soil moisture deficit (Ritchey et al., 1980).
Cation Leaching from the Zone of Application
The amountand degree of cation leaching in soils of
the humidtropics ranges widely and reflects the various
factors that control leaching. For example, Ca move-
ment is promoted by applying Ca in forms that include
a mobile anion, such as CaSO4or CaCI2, rather than as
T.S. Dierolf, Jalan KehakimanNo. 283, Bukittinggi, West Sumatra,
Indonesia 26136; L.M. Arya, 3455 Lebon Rd., Apt. 1535, San Diego,
CA;R.S. Yost, Dep. of .Agronomyand Soil Science, Univ. of Hawaii,
Honolulu, HI 96822. Worksupported by the Ctr. for Soil and Agrocli-
mate Res. (CSAR), Bogor, Indonesia, and the Soil ManagementCol-
laborative Res. Support Program (USAID). Received 29 Apr. 1996.
*Corresponding author (rsyost@hawaii.edu).
Published in Agron. J. 89:572-579 (1997).
CaCO3 (Ritchey et al., 1980), and by the addition
acidifying N fertilizers (Pearson et al., 1962). The
amount of cumulative rainfall and drainage has been
related to the decrease in surface-soil cations (Cahnet
al., 1993;Ayarzaet al., 1991). Significant leaching losses
are likely to occur only if the soil ion exchangecapacity
is exceeded, as whenlarge amountsof cations are added
in fertilizers (Friesen et al., 1982; Gill and Kamprath,
1990). Cropped plots reportedly showedreduced cation
leaching as compared with bare plots, presumably be-
cause of the effect of plants on soil drying (reducing
drainage) and nutrient recycling (Wonget al., 1992).
Subsoil Cation Accumulation
Reports of subsoil cation accumulation seem to pre-
dominate from regions with ustic soil moisture regimes
or where substantial subsoil drying can occur. In sepa-
rate studies on a clayey Typic Haplustox in Brazil, K
accumulated to depths of 75 cm (Souza et al., 1979;
Fageria et al., 1990), and Ca and Mgcontents increased
to a depth of 75 cm(Ritchey et al., 1980). Almost all
of the limestone wasaccounted for in the surface 60 cm
in the latter study. Poss and Saragoni (1992) reported
Mgaccumulated to a depth of 80 cm in a sandy Typic
Eutrustox in Togo. On a clayey Typic Haplorthox in
Puerto Rico, Ca and Mgaccumulated in the 45- to 60-
cmdepth by 2 yr after application of high rates of CaCO3
and (NH4)2SO4 (Pearson et al., 1962).
Mixedresults are reported from soils with udic mois-
ture regimes. Soil K did not increase below 30 cmin a
clayey Typic Haplorthox in Indonesia (Gill and Kam-
prath, 1990). Theauthors reported that K equivalent to
24%of the 480 kg K ha-1 applied was leached to below
the 90-cmdepth. Fifteen years of continuous cropping
and fertilization of a Typic Paleudult in Yurimaguas,
Peru, resulted in an increase of Ca and Mgonly to
the 20- to 40-cm depth (Alegre and Sanchez, 1991).
However, Ayarza et al. (1991) reported that 2700
of rain wassufficient to accumulateK in the 60- to 100-
cm depth of a fine-loamy Typic Paleudult from Yurima-
guas. Theywere able to account for the entire applica-
tion amount of 150 kg K ha-1 within the surface 100
cm.Friesen et al. (1982)calculated that nearly all of the
Ca contained in as much as 4 MgCa(OH)2 -I was
recovered in the surface 90 cmof soil by 3 yr after liming
a coarse-textured Typic Paleudult in Nigeria.
Macropore Flow and Subsoil Water Status
Well-structured soils, whichare characteristic of Siti-
ung, Indonesia, often exhibit macropore water flow
(Anderson and Bouma, 1977). Macropore flow allows
percolating water to pass through the soil without com-
pletely displacing the resident soil water contained in
micropores (Beven and Germann, 1982). Water flowing
Abbreviations: ECEC,effective cation exchange capacity.
572](https://image.slidesharecdn.com/38611300-cb11-41b5-9320-fb80b08d2720-160123031153/85/DierolfAryaYostWater1997-2-320.jpg)
![DIEROLF ET AL.: WATERANDCATION MOVEMENTIN AN INDONESIANULTISOL 573
in saturated macropores can movesolutes into unsatu-
rated micropores, whereas saturated micropores will
largely, except for somediffusion, be bypassed by the
water and solutes (Youngs and Leeds-Harrison, 1990).
Thus, the degree of micropore saturation in the subsoil
can influence the movementof drainage water and sol-
utes, and maypartly explain the range of results on
subsoil cation accumulation discussed in the previous
section. For example, if a subsoil is dry, and the micro-
pores are not filled with water, it is possible that water
carrying cations from the surface layer will enter these
pores and result in subsoil cation accumulation.
The Brazilian savanna, where the Oxisols mentioned
previously are located (Souza et al., 1979; Ritchey et
al., 1980; Fageria et al,, 1990), undergoesa 3- to 6-too
dry period that encourages drying out of the subsoil.
Similarly, the subsoil of the Oxisol from Puerto Rico
(Pearson et al., 1962) can dry to the permanentwilting
point (Bouldin, 1979). The subsoil cation accumulation
reported at both sites may have been promoted by a
relatively dry subsoil that allowedfor water and nutrient
movementinto subsoil micropore space.
In contrast, the Oxisols and Ultisols of Peru (Alegre
and Sanchez, 1991; Ayarzaet al., 1991), Indonesia (Gill
and Kamprath,1990), and Nigeria (Friesen et al., 1982),
referred to previously, have an udic moisture regime
with an evenly distributed annual rainfall. The mixed
results on subsoil cation accumulation reported from
these areas maybe a result of the effect that subsoil
texture and structure can have on subsoil drying. For
example, the clayey subsoil of an Ultisol in Indonesia
that is similar to and geographically near to the one
reported on by Gill and Kamprath (1990) maintained
a high pore saturation even during an uncommon36-d
drought (Arya et al., 1992). Thecoarse-textured Ultisol
in Nigeria (Friesen et al., 1982) mayhave allowed for
moresubsoil drying, thus letting water and nutrients
moveinto the subsoil micropore space.
The previously mentioned reports emphasized the
movementand accumulation of cations, but they did
not provide detailed information on the nature of water
flow through the respective soil. Ourobjective was to
characterize water movementin a highly weathered soil
of the humidtropics and to relate this to the movement
and subsoil accumulation of basic cations in a 2-yr
field experiment.
MATERIALS AND METHODS
Site Characteristics
Field experimentswereconductednear the village of Siti-
ung1A,WestSumatra,Indonesia(102° E, 1° S). Therainforest
originally coveringthe site wascut and cleared by bulldozer
in 1976.Afterthree seasonsof rice (Oryzasativa L.), the field
wasfallowedand then becamedominatedby alang-alanggrass
[Imperatacylindrica (L.) Raeusch.]. Thealang-alang was
sprayedwith herbicide andthen cut and removed.Thesurface
15 cmwas plowed and alang-alang roots were removed. A
soil pedonin an adjacent,unplowedarea wastentatively classi-
fied as a clayey, kaolinitic, isohyperthermicTypicKanhaplu-
dult (Table1). Initial levels of extractablecations fromsoil
of a nearbyexperimentwere(in cmolckg-1) 0.73 Ca, 0.18 K,
0.29 Mg,and 4.63 AI+Hfor the surface 15 cm,and 0.25 Ca,
0.05 K, 0.07 Mg,and 4.01 AI+Hfor the 15- to 30-cmdepth.
Surfacesoil organicCwas27.1 g kg-1, andpHwas4.9 in H20
and 3.9 in 1 MKC1.Rainfall ranges from 2500to 3000mm
yr-~ and averages morethan 200mmper monthfrom October
to May,and from 100 to 200 mmfrom June to September.
Internal Drainage
Internal drainagewasmeasuredin a 17.2m2 plot delineated
with plastic sheeting to a depth of 1.5 m. Twodiagonally
opposed quadrants were each instrumented with a neutron
probeaccess tube and tensiometersinstalled at depths from
7.5 to 120cmin 15-cmdepth increments. Theneutron probe
wascalibrated in both an emptyand a full water tank to
determinethe slope of the regression equation for relating
neutroncountto volumetricwatercontent (0). Theintercept
of the equation wascalculated fromthe soil core-measured
bulk density and fromthe gravimetric water content of soil
that wassampledwhile taking neutron counts.
Theplot wasirrigated with 71 mmof water 2 d before
the drainage test, to ensure maximumwetnessand moisture
uniformity.For the test, the plot wasirrigated with 72.5mm
of waterappliedwith sprinklingcansduringa 100-minperiod.
After irrigation ceased, the plot surface wascoveredwith a
plastic sheet anda shelter. Valuesof 0 at depthsfrom7.5 to
112.5 cmwere measuredwith a neutron probe. The0 of the
0- to 7.5-cmdepth wasdeterminedfromperiodic gravimetric
sampling.Soil matric potential wasmeasuredwith a portable
transducer. Tensiometer and neutron probe readings were
takenat several-minuteintervals initially andthen less fre-
quentlyup to 963h after irrigation ceased.
Total water content for a soil layer wasdetermined by
multiplyingthe volumetricwater content by the layer thick-
ness. Total water fromthe soil surface to a soil depth z was
obtained by summingthe total water content for each of the
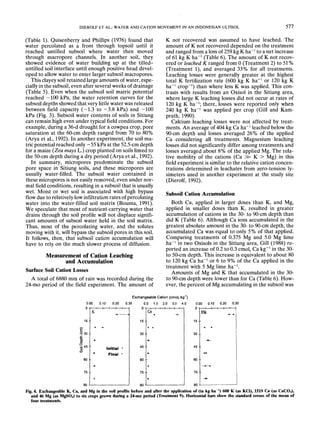
Table 1. Soil profile description for the study soil, near the village of Sitiung, WestSumatra,Indonesia.~"
Horizon Depth Color Texture~
Particlesize][
Structure§ sand clay
cm
A 0- 12 10YR3/4 sicl
Btl 12- 35 10YR4/4 d
Bt2 35- 72 7.SYR4/4 cl
Bt3 72- 97 7.SYR4/6 cl
Bt4 97-143 5YR518 d
Bt5 143-160 5YR518 cl
ffm sbk 8 62
f/m sbk 11 66
f/m sbk 6 73
f/m sbk 7 65
ffm sbk 7 54
ffm sbk 7 52
"~ Dataprovidedby the Ctr. for Soil andAgroclimateRes. (CSAR),Bogor, Indonesia.
~:si, silty;ci, clay.
§ f, fine; m, medium;sbk, subangularblocky.
][ Pipette methodafter sonification in sodiumhexametaphosphate.](https://image.slidesharecdn.com/38611300-cb11-41b5-9320-fb80b08d2720-160123031153/85/DierolfAryaYostWater1997-3-320.jpg)
![574 AGRONOMYJOURNAL,VOL.89, JULY-AUGUST1997
soil layers to depth z. Hydraulic conductivities at the various
depths were calculated by combining Darcy’s law and the
equation of continuity (Hillel et al., 1972) with computed
values of volumetric water content and soil matric potential.
Waterfluxes were calculated from changes in total water con-
tent with time or drainage curves. The volumetric water con-
tent at field capacity for each depth interval wasdetermined
from curves fit to the change in volumetric water content with
time. The drained-pore volumeat field capacity was used to
estimate the macroporosity. A similar approach has been used
on soil cores (Germannand Beven, 1981). Our definition
macroporosity probably also includes somemesopores, which
Luxmoore(1981) defined as pores which hold water between
-0.3 and -30 kPa.
Soil Moisture Release Curves
Watercontents for matric potentials -< 100 kPa were deter-
minedon field samples. Soil cores were sampledat soil depths
of 10, 25, and 60 cm, adjacent to tensiometers that were in-
stalled at the respective depth. Undisturbed soil cores (77 mrn
in diam., by 40 mmhigh) were sampled at midpoint depths
of 2, 10, 25, and 60 cmand were placed in pressure chambers
to measure water contents at matric potentials up to -400
kPa. Macroporosity wasalso estimated from the soil moisture
release curve by determining the volumetric water content at
the soil matric potential measuredat field capacity during the
internal drainage experiment.
Potassium Management Experiment
A field experiment was conducted to quantify the changes
in soil cation pools as affected by various stover management
and Kfertilization managementpractices. Arange of K inputs
and outputs was obtained in the soil system by varying KC1
applications and by either removingor returning crop biomass.
Nine treatments were arranged in a randomized complete
block design with four replications (Table 2). Plots measured
42 m2, with a 12 m2 harvest area. Basal fertilizers totaling (in
kg ha-~) 170 P (as TSP), 240 N (as urea), 46 Mg(as MgSO4),
10 Zn (as ZnSO4), and 15 B (as borate) were applied during
the experiment. Calcium carbonate to reduce A1 saturation
to 25%(1.3 to 2.7 IVlg ha-1, dependingon individual plot soil
analyses) wasapplied before the first crop and an additional
2 Mgha-a was applied before the sixth crop. Basal lime and
fertilizer treatments were incorporated into the surface 15 cm
of soil.
Six crops (cowpea [Vigna unguiculata (L.) Walp.]--cowpea-
rice-soybean [Glycine max (L.) Merr.]-rice-soybean) were
grown in sequence from May 1989 to May 1991. Nutrient
removalin harvested grain and stover wascalculated by multi-
plying percent composition by dry weight of the respective
fractions. Soil samples were taken (five 10-cm-diam.cores per
Table 2. Treatmentsfor the Kmanagementexperiment.
Treatment Total K Application Stover
code applied timing-~ management
kg Kha-t
1 70 single returned
2 250 single returned
3 250 split returned
4 600 split returned
5 70 single removed
6 250 single removed
7 250 split removed
8 600 split removed
9~ 215 split removed
Single,all fertilizerwasappliedtothefirstcrop.Split,fertilizerwassplit
over sev/eral crops.
150kgKha-~ appliedas KCIfertilizer, remainderappliedas cattle
manure.
66
"E64
6O
-0.4017Ln(x)+64.154
0.9032
200 400 600 800 1000
Time(hours)
Fig. 1. Drainagecurveshowingtotal watercontentfor the0 to 112.5-
cmdepthas a functionof timefrom0.07to 963h after irrigation
with72.5 mmof waterduringa 100-rainperiod(symbolsrepresent
tworeplications).
plot) before fertilizing the first crop and after harvesting the
final crop in 15-cmincrements to a depth of 90 cm.
Extractable soil cation values were converted to massequiv-
alents (kg ha-~) by using the respective bulk densities. The
cation accumulation for a depth increment was calculated as
the difference between initial and final soil mass equivalent
values. The amountof applied cation that was not recovered
within the 90-cmdepth or in harvested biomass (D) was calcu-
lated using D = a - b - c, where a is the total amount of
cation applied as fertilizer, b is the amountof cation removed
in harvested biomass, and c is the cation accumulation within
the 0- to 90-cmdepth. Aseparate laboratory incubation study
determined that less than 10%of K added as fertilizer KCI
to this soil taken from the 0- to 15- and 15- to 30-cmdepths
may not be recovered by 1 MNH4OAcextraction (Dierolf,
1992). Thus, to simplify the discussion, we assumedthat all
of the K, Ca, and Mgnot recovered in the soil (c) or accounted
for in crop removal (b), was lost to leaching (D).
Cations were extracted from soil samples with 1 M
NHaOAc.The soil extracts were analyzed for cations by atomic
absorption spectrophotometry. The harvest fraction of each
crop was analyzed for nutrient content by the University of
Hawaii’s Agricultural Diagnostic Services Center. Samples
were dry ashed at 550°C and nutrients were determined by
inductively coupled plasma emission spectrometry. Linear re-
gression and analysis of variance were conducted using the
Statistix analytical software(Statistix, 1992).
RESULTS AND DISCUSSION
Hydraulic Properties
Water Drainage
The total soil water content in the 0- to 112.5-cm
depth decreased sharply within 6 h after the 100-min
Table3. Drainageof water fromthe 0- to 112.5-cmsoil depth
for several times (t) after the applicationof 72.5 mmof water
(P) duringa 100-minperiod in the drainageexperiment.
t WS~" P WS,t D~ AWD~
h cm %
0.07 63.01(0.28)§ 7.25 65.33(0.75) 4.93 68
6 63.01(0.28) 7.25 63.45(0.29) 6.81 94
24 63.01(0.28) 7.25 62.87(0.16) 7.39 102
Initial waterstorage(WSi)is total waterpresentin profile prior
irrigation.Waterstorageat timet (WS,)is thepredictedtotal water
contenttakenfromregressionequationssuchas shownin Fig. 1.
Drainage(D) is calculatedas D= WSI+ P - WS,andappliedwater
drainedbelow112.5cm(AWD)is calculatedas D/P.
Valuesin parenthesesare standarddeviations.](https://image.slidesharecdn.com/38611300-cb11-41b5-9320-fb80b08d2720-160123031153/85/DierolfAryaYostWater1997-4-320.jpg)
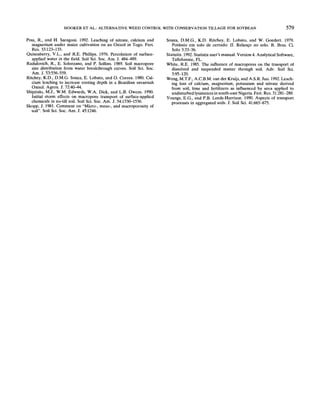
![DIEROLF ET AL.: WATERANDCATION MOVEMENTIN AN INDONESIANULTISOL 575
~._.0.70 L
’o E ~ ~ o.o y =-0.0357Ln(x)+ 0.6397
~o.5o’- ~
~ y = -O.0392Ln(x)* 0.4534
~
R2 = 0.9861
lO lOO lOOO
Matricpotential(-kPa)
Fig. 2. ttydradic conductivity at the 22.5- andll2.5-cm depths as a
function of the averagevolumetricwatercontent for the respective
15-cm depth increment above each depth. The 22.5-cm depth was
unreplicated due to tensiometer failure. Symbolsrepresent calcu-
lated values for each replication at the 22.5-cm(solid circles) and
the 52.5-cm (open, solid squares) depths.
irrigation period ceased (Fig. 1). However,the change
in soil watershownin Fig. 1 represents drainageequal
to only 32%of the applied water, because 68%of the
applied water had drained (AWD)past the 112.5-cm
depthwithin 4.2 minafter irrigation hadceased(Table
3). Six hoursafter irrigation ceased, about94%of the
applied water had drained below 112.5 cm.
Hydraulic conductivities at various depths initially
ranged from 2 to 8 cmh-1, but decreased abruptly with
a slight dropin the watercontent(Fig. 2). For example,
after 24 h of drainage, the volumetric water content at
the 112.5-cm depth decreased from an initial value of
0.622 cm3 cm-3 to 0.606 cm3 cm-3, while the hydraulic
conductivity decreased from 8.03 cmh-] to about 0.06
cm
Water Content and Retention
Watercontent at field capacity (at 24 h after irrigation
ceased) increased with depth (Table 4). Morewater
retained at a given matric potential in the 55- to 65-
cmdepth than in the 0- to 4-cm depth (Fig. 3). The
macroporosityrangedfrom26 to 40%of the total poros-
ity in the surface 22.5 cmand 5 to 7%in the subsoil.
Macroporosities determined from the water retention
data (0 to 4 cm = 40%, 5 to 15 cm = 22%, 20 to 30
10
8 o.ol
0.001
0.0001
log Y=~24~6C3mx-76.79 = /.
! 112.5 cm "~
t~ log Y =~- 82.12 E
~ R= = 0.795
0.650.45 0.50 0.55 0.60
Volumetricwatercontent(cm3 cm"3)
Fig. 3. Soil moisture release curves determined on field (open
squares) and core (solid squares) samples at the 55 to 65-cmdepth
andfor core (solid circles) samplesat the 0 to 4-cmdepth. Regres-
sion statistics for the twodepths not shownin the figure are: 5 to
15 cm, Y = -0.06 iogX + 0.55, Rz = 0.685, n = 41; 20 to 30 cm,
Y = -0.02 IogX + 0.55, Rz = 0.303, n = 41. Except for the 0- to
4-cm depth, the data points at -400 kPa werenot included in the
regression analyses.
cm = 10%,and 55 to 65 cm = 4%), were similar to those
determined at field capacity in the drainage experiment
(Table 4).
Thesoil matric potential at field capacity generally
decreased with depth and ranged from -4.6 kPa at 7.5
cm to -1.8 kPa at 105 cm(Table 4). Evenafter 963
of drainage, the soil matric potential did not exceed
-10.0 kPa (data not shown). Irrigation did not signifi-
cantly increase subsoil pore saturation, becausethe ini-
tial pore saturation was already high and remained so
even after 963 h of drainage (Table 5).
Hydraulic Conductivity
Conductivities determined from the drainage experi-
ment confirm that a large volume of water can move
rapidly throughthis soil (Fig. 2). Aryaet al. (1993)
reported high field-saturated hydraulic conductivities,
ranging from 2 to morethan 9 cmh-1, in an experiment
conducted near the present experiment. The ability of
this clay-textured soil to rapidly transmit water, as im-
plied by saturated conductivityanddrainagerates (Ta-
ble 3) and by the sharp drop in the total water content
curves over time (Fig. 1), suggests the presence of mac-
ropore flow.
Table 4. Bulk density (BD), particle density (PD), porosity (P), and soil matric potential (~), volumetric water content (0), and
macroporosity (MP) at field capacity for several depths.
Mean
Atfield capacity§
depth BD PD? P~ 0 0¶ MP#
cm gem-3 cmJ cm-3 kPa em3 cm-~ %
3.75?? 0.91 (0.03)$$ 2.61 (0.01) 0.651 -4.6 (0.8)$$ 0.389(0.005) 40
15 0.9310.06) 2.70 (0.08) 0.656 -4.4 (0.9) 0.486 (0.020) 26
30 1.09(0.03) 2.72(0.02) 0.599 -3.5 (0.9) 0.569(0.013) 5
45 1.05(0.05) 2.75 (0.01) 0.618 -3.4 (0.7) 0.578(0.009) 7
60 1.03(0.03) 2.72(0.06) 0.621 -2.6 (0.6) 0.579(0.008) 7
75 1.00(0.04) 2.72 (0.04) 0.632 -2.9 (0.7) 0.587(0.008) 7
90 1.01(0.02) 2.80(0.03) 0.639 -2.3 (0.7) 0.596(0.007) 7
105 0.97(0.02) 2.75 (0.05) 0.647 -1.8 (0.9) 0.602(0.007) 7
Meanof three samples using pycnometer method.
P = 1 - (BD/PD).
Values at field opacity weredeterminedfromthe internal drainageexperiment.
Meanvolumetricwatercontent(24 h after irrigation ceased)predictedfromregression equations that werefit to drainagecurvesfor eachdepthincrement.
[1 - (volumetric water content/P)] x 100.
?? Tensiometermidpointlocated at 7.5 cmfor this depth.
:~:~ Valuesin parenthesesare standarddeviations (for BDand PD)or standarderrors (for 0 and 0).](https://image.slidesharecdn.com/38611300-cb11-41b5-9320-fb80b08d2720-160123031153/85/DierolfAryaYostWater1997-5-320.jpg)