SlideShare a Scribd company logo
1 of 30
Download to read offline
DICK’S SPORTING GOODS, INC.
(NYSE: DKS)
HOLD EPS (2016) = $3.27 Target Price (2016): $48.10
P/E (ttm) = 12.78
Qualitative Risk Assessment:
High Risk
Analyst: Aaron Martschenko
and Andrew Johnson
Report Date November 22, 2015
Recent Price $38.98
52-Week Range $33.42 - $60.33
One Year Return -19.07%
Shares Out. (mrq) 117,739
Insider Ownership
% of Shares Held 1.91%
# of Shrs Bought 0.00
# of Shrs Sold 20,000
Institutional Ownership
% of Shares Held 92.52%
% of Float Held 94.32%
% Δ Inst. Hold. 1.20%
INVESTMENT THESIS
Dick’s Sporting Goods, Inc. is a leading sporting goods retailer in the United States. They operate approximately 700 stores,
delivering a wide variety of high quality goods including apparel, footwear, and sporting equipment. With an appealing product
mix, aggressive expansion, and growth in e-commerce, we believe they have improved the defensibility of their competitive
position. However, their expansion is not free of risk. They are exposed to a potential weakened consumer with their shift to
higher margin apparel and footwear, supply issues from unexpected seasonal changes, and increased competition from major
manufacturers with higher brand power. Thus, we do not believe their recent discounted price is discounted enough to outweigh
the potential impact of existing risks.
KEY POINTS
□ One-stop shop appeal and growing e-commerce platform improve defensibility of competitive position
□ New partnerships with U.S Olympic Committee, Nike, Under Armour, Polo Sport, and Skechers should benefit margins
as sales mix shifts more towards high margin apparel and footwear
□ Business is heavily impacted by unexpected seasonal changes
□ Faces intense and growing competition from major manufacturers, mass merchants, and other sporting goods stores
□ Spends favorably to grow business with store expansion and rewards shareholders with $1B share repurchase program
□ Increased promotional activity in Q4 as indicated by management after a weak Q3 could lead to decreased performance
in the short-term
SUMMARY OF KEY FINANCIAL INFORMATION CONSENSUS ESTIMATES (2016)
Market Cap. $4.57B L-T Debt/Equity (mrq) 0.32% EPS $3.31
Total Assets (mrq) $4.06B Beta 0.93 Sales $7.933B
Total Liabilities (mrq) $2.34B Dividend Yield (ttm) 1.08% Net Income $377.182M
Sales (ttm) $7.19B Dividend (ttm) $0.55 Forward P/E 12.92
Net Income (ttm) $357M PEG Ratio 1.00 Long-term Growth 13.14%
Gross Margin (ttm) 30.6% Price/Sales (ttm) 0.64 Target Price $46.74
EBIT Margin (ttm) 8.04% Price/Book (mrq) 2.66 Buy/Hold/Sell 14/14/01
Net Margin (ttm) 4.96% Fiscal Year End Jan-31 Disclosure: Aaron Martschenko and Andrew
Johnson do not own any shares of DKSReturn on Equity (ttm) 20.7% Most Recent Quarter Oct-31
Company Overview
Dick’s Sporting Goods is a sporting goods retailer that began operations in 1948 in Binghamton, NY and is now
headquartered in Coraopolis, PA. As a sporting goods store, DKS offers a wide variety of products. They separate their
product segments into hardlines, apparel, footwear, and other. While they maintain a higher-quality of sporting goods
products, Dick’s accommodates the consumer’s style from a beginner to an enthusiast athlete. Hardlines refers to items
such as sporting goods equipment, fitness equipment, golf equipment and outdoors gear. The category other, refers to
Dick’s non-merchandising sales category, which includes in-store services provided and revenue from shipping. The
following chart expresses the approximate percentage of sales in regards to the four categories for fiscal year 2014:
Dick’s also owns and operates three specialty stores; Field & Stream, Golf Galaxy, and True Runner. Dick’s
prides itself on presenting and selling higher-performance items geared more directly towards the serious athlete. As of
August 2015, Dick’s operates over 600 stores in 46 states, 75 Golf Galaxy stores in 29 states, 12 Field & Stream stores in
seven states, and three True Runner stores in three states. A majority of these stores are located from the Mideast to the
East coast of the United States, but Dick’s is making strides to open more stores on the West coast, offering a wider range
of operations.
In terms of the management of DKS, the company has been held in family hands since Edward Stack, son of
Dick’s founder, became the CEO and Chairman of the Board of Directors in 1984. The Board of Directors is comprised of
Stack, William Colombo, and seven members outside the company.
Industry Outlook
The Sporting Goods Stores industry in the United States can be characterized by high internal and external
competition, a mature life cycle stage, and reliance on the business cycle and consumer preferences.
Overall, industry growth is fairly flat. This is due to the high amount of competition and lack of differentiation
across competing companies. Within the industry, sporting goods stores face significant competition from each other
because major suppliers such as Nike and Adidas supply products to nearly every company. In order to stay competitive,
these major brands must be carried at all stores. Therefore, the amount of differentiation in products offered between stores
is minimal. Competition is furthered by the threat of external competitors. External competitors include mass
merchandisers such as Walmart and Target, and major suppliers to the sporting goods store industry. Mass merchandisers
add to the competition for sporting goods sales because they typically carry a range of lower to medium priced goods that
tend to be lesser quality than some of the brands typically offered at sporting goods stores. This is a threat to lower priced
goods sold in the industry. Major suppliers contribute to the competition for sporting goods sales because they carry the
same high quality products that are stocked at sporting goods stores, albeit a narrower selection of brands. The more direct-
to-consumer avenues that major suppliers develop, the greater risk to the sales of participants in the sporting goods store
industry. These avenues can include an increasing number of outlet stores and a growing online retail presence. In fact,
both mass merchandisers and major suppliers carry the threat to the sporting goods store industry of developing better
online retail sites.
Despite all of the competition those in the industry are exposed to and the industry’s mature life cycle stage, there
are still attractive investment opportunities. To combat external competition, sporting goods stores need to grow their
online retailing abilities and increase the amount of high quality products they offer. A way this can be done is by securing
key relationships with suppliers to provide private-label brands and other less commonly found products that appeal to
niche markets and provide unique value. We believe that what makes a customer prefer to shop in one store over another
for their sporting goods is the amount and quality of selection they have available to them. It makes it much easier on the
customer to walk into only one store and compare products like shoes and baseball bats of varying prices and brands,
instead of having to shop at multiple locations to identify the best product. By offering a large selection of high quality and
highly demanded products in comparison to other companies, sporting goods stores can offer a one-stop shop appeal that
other competitors don’t have. This is crucial in minimizing the negative impact that direct internal competition, and also
external competitors like mass merchandisers and major suppliers to the industry will have.
We believe that going forward, there is investment opportunity and growth in companies that can offer the
broadest product portfolio of high quality goods for one-stop shop appeal, develop online retail, and expand their
geographical footprint to draw a larger consumer base and build brand reputation.
Company Outlook
To stay competitive in the industry, sporting goods stores have to develop a business model that adapts to new
consumer shopping preferences and keeps customers from purchasing their sporting goods from other distribution channels.
We believe Dick’s has responded to the threat of competition better than their competitors and have set themselves up for
future success. As major manufacturers such as Nike and Adidas increase their direct-to-consumer distribution channels
with both online and brick-and-mortar stores, it is imperative for sporting goods stores to do the same if they hope to keep
their customer base. In the general retail environment, we believe that e-commerce will play a role of increasing
importance because it provides customers with the value of having immediate information. Customers are able to quickly
shop around for the best price online and then order the product right now, or go to a physical store location to test out the
product before they purchase it. We see three ways that companies can adjust to the impact of changing consumer behavior
and believe Dick’s Sporting Goods has made adjustments superior to those of their competitors in their industry. Those
three things are to further develop one-stop shop appeal and grow their brand, adapt product mix to consumer preferences,
and grow their e-commerce segment.
We believe Dick’s Sporting Goods has developed their one-stop shop appeal much better than competitors in the
industry. We view this factor as one of the most important aspects that contributes to long-term success. Although e-
commerce growth is a key factor in long-term success, we are convinced that what really attracts people to a sporting goods
store over a mass merchant or outlet store for Nike is the wide availability of high quality products. When a customer goes
into a sporting goods store, having more options appeals to the value-conscious consumer and is important in retaining
customer base. Dick’s has an advantage because they have secured key relationships with suppliers that others don’t have
and the average size of their stores is larger than competitors. Dick’s operates stores that are about 50,000 square feet on
average while their closest competitor in Hibbett Sports only averages about 5,000 square feet. They have expanded each
year in store count by adding about 35-50 stores each year. Other companies in the industry have not been able to exhibit
this kind of expansion and we believe this increases Dick’s brand power relative to other sporting goods stores.
In addition to the appeal of their stores, they have made changes in their sales mix, which we see as a positive.
Not only has Dick’s secured relationships with major companies like Nike and Under Armour to offer a store-within-a-
store format, they have also shifted their product mix to being more heavily weighted in apparel and footwear. This
capitalizes on the current athleisure trend in the industry. They have secured a partnership with the United States Olympic
Committee, Skechers, Polo Sport, and Nike Air Jordan. We believe incorporating these products into their sales mix adds
more variety to the products and services they offer and with each of these partnerships providing high quality and higher
margin goods, it will improve the appeal of their store over those of competitors.
In addition, growth in e-commerce is something we believe will be a major factor going forward in the ways
consumers shop for goods. Because consumers have so much data available to them, they can shop around quickly for the
best price. Having an established brand and e-commerce platform brings customer attention to the company and even if the
customer doesn’t purchase the goods directly from the website, they may want to go to the store to test out the product
before ordering it. Thus, e-commerce growth is important in keeping strong sales at physical locations too, not just online.
We view growth in e-commerce sales as a major factor in keeping customers from shopping online at a Nike website or
other competitor.
Overall, we believe Dick’s Sporting Goods has made more aggressive efforts to expand their presence in the
industry and compete with external competition. With their growth strategy, attractive store layout and shifts in product
mix, we believe they have improved the defensibility of their competitive position. Despite these strengths, given their
recent weak performance in the third quarter and management’s expressed interest to create a “more promotional
environment,” we do believe the short-term outlook is not as strong as over the long-term. Promotional and advertisings
costs are one of the major factors for drops in profit margins for the past year and this could lead to weaker performance to
round out the year. We expect promotional costs will be higher because Dick’s will want to get rid of the piled up
inventory, and will hope to increase traffic in their stores as same store sales growth was weaker than expected in the third
quarter. Thus, we believe they may struggle in the near-term and that the risk is too high to be overly optimistic on their
long-term outlook.
Financial Analysis
Historically, return on equity for Dick’s Sporting Goods has been higher than the industry average but slightly
lower than their most similar competitor, Hibbett Sports. Growth in return on equity is due to improvement in profit
margins and more efficient use of assets. The use of debt has been limited and has had minimal positive or negative impact
on ROE in past years.
Table 1 – Return on Equity Components for Dick’s Sporting Goods, Inc.
2010 2011 2012 2013 2014 TTM
Hibbett
Sports
Industry
Average
Net profit margin 3.7% 4.9% 5.3% 5.4% 5.1% 5.0% 8.1% 6.8%
Total asset turnover 1.9 times 1.7 times 2.0 times 2.0 times 2.0 times 1.8 times 2.0 times 1.3 times
Equity multiplier 1.9 times 1.8 times 1.8 times 1.8 times 1.9 times 2.4 times 1.4 times 2.1 times
Return on equity 13.4% 15.6% 19.5% 20.0% 18.8% 20.7% 23.4% 18.6%
Source: Return on equity components are calculated from company financial statements
Industry averages are calculated from Bloomberg data
Each year, profit margins have had the most fluctuation and most impact on return on equity. After evaluation of
companies within the industry, factors we believe have the largest impact on profitability are: competitive pressures that
result in increased spending, and efficient production from existing stores.
In the sporting goods store industry, there are high levels of both internal and external competition. To retain the
appeal of a sporting goods store and defend against rising competition, those within the industry need to expand their
presence by increasing the size and number of brick-and-mortar stores, and by furthering their online presence.
Accomplishing this without hurting margins significantly is no easy task because it requires a substantial amount of
spending. Due to the increased emphasis on brand presence and expansion, cash has declined (Appendix A-4), while
additional costs have accumulated. Major costs incurred include occupancy costs of new and/or larger facilities, increased
shipping costs associated with the growing importance of e-commerce development, and advertising costs to promote
newly established stores.
Companies such as Dick’s Sporting Goods have responded to increased competition by ramping up spending and
expansion. The degree of spending and expansion has led to increased inventory levels for Dick’s over the past five years,
as well as property, plant & equipment (Appendix A-3). Other companies within the industry have not exhibited the same
amount of expansion efforts. The closest comparison is with Hibbett Sports, which has an ROE greater than that of Dick’s.
They have expanded with approximately 15 stores each year and with their average store size being approximately 1/10 the
size of a Dick’s store, their expenses associated with expansion are much less. As a result, Dick’s absolute revenue is much
higher than Hibbett Sports and commands significantly more market share. However, Dick’s expense ratios are also
higher, indicated by lower profit margins. They have incurred significant costs related to the increased salary expenses,
increased shipping expenses, advertising costs for products and new stores, and occupancy costs over the past several years.
Due to these higher expenses, their gains in profit margins from increased sales have been limited and we believe it’s the
main reason for not being up to par with the margins of Hibbett Sports. In the most recent fiscal year, Dick’s net profit
margin had declined due to these additional expenses and offset any gains from their move to a higher margin product mix.
Despite being below their closest competitor in net profit margins, we believe their expansion strategy will allow them to
improve in the future. The more market share they gain, a smaller amount of money will have to be spent on some
expenses that have hurt their profit margins in the past. For example, occupancy costs as a percentage of net sales dropped
ten basis points in their most recent fiscal year, which is a trend we believe will continue based on results of same store
sales in the industry.
Table 2 – Annual Same Store Sales Increase for DKS and Main Competitors
2010 2011 2012 2013 2014
DKS 7.4% 2.0% 4.3% 1.9% 2.4%
HIBB 1.6% 2.8% 6.9% 3.9% (12.3%)
CAB 0.1% 9.8% 6.8% 6.9% 1.8%
Source: Data obtained from company financial statements
Shown in Table 2, Dick’s same store sales growth has been more than those of their closest publicly traded
competitors in the most recent fiscal year, indicating improvements in efficiency of existing stores. Cabela’s had suffered
because of a decline for demand in hunting and fishing equipment, which makes up most of their sales. We believe Hibbett
Sports suffered because of their lack of ability to defend against rising competition. Hibbett Sports performs well in
smaller markets away from large competitors where they rely on their customer service to attract customers despite a
smaller product selection than companies such like Dick’s. We believe there are two major factors hurting their same store
sales. The first is the lack of development in their e-commerce platform that leaves them vulnerable to competition from
companies like Nike, Adidas, and Under Armour with strong internet presence. Secondly, the increasing presence of
Dick’s Sporting Goods across the United States competes with their stores in smaller markets, possibly stealing away sales
because we believe Dick’s offers a much larger selection of and more high profile products that consumers prefer in a
sporting goods store.
In regards to same store sales growth, we believe it can be improved through proper asset management. Dick’s
total asset turnover ratio of 2.0 (Table 1), is above industry average and right in-line with 2.0 for Hibbett Sports. Although
their fixed asset turnover ratio is lower than the industry (Appendix A-6), because of the risk of new stores not immediately
performing well in new markets, their higher inventory turnover allows them to get more production out of each asset.
Product mix is of critical importance in determining total asset turnover. We believe Dick’s product mix is better because
of their shift to a higher proportion of higher margin athletic apparel and footwear in their stores and supplier relationships
that allow them to carry products that other stores in the industry do not. The shift to a product mix with more apparel and
footwear capitalizes on the current athleisure trend and appeals to what the consumer wants now, aiding inventory turnover
and overall asset management. Historically, strong asset management has been a stable area of performance for Dick’s
Sporting Goods and has allowed them to have a return on equity exceeding that of the industry average despite having
lower profit margins.
Aside from the impacts of decisions impacting profitability and efficient use of assets in the industry, the use of
financial leverage is another factor impacting return on equity. However, it has played less of a role in upward or
downward moves in Dick’s return on equity. This is mainly due to their emphasis on not using much debt in financing
their expansion. After fiscal 2011, the use of debt financing played even less of a role. We believe this has allowed them to
still be in decent financial position even with a low level of liquidity. Going forward we expect debt will be used in
emergency situations such as in this most recent quarter in FY 2015, with the impact displayed in their TTM ROE (Table
2). Management’s assertions to have zero outstanding debt under their revolving credit facility demonstrates their efforts to
have very limited use of debt, and we believe it is indicative of how they will handle future borrowings (Appendix B-4).
Based on Dick’s corporate strategy, we believe their financial condition is sound. Dick’s Sporting Goods has
typically been able to generate a free cash flow per share greater than industry average (Appendix A-6) due to their efforts to
improve profitability and obtain more production out of each asset. To improve profitability, they have improved the
defensibility of their competitive position by further expanding into new markets and strengthening their internet presence,
and they have shifted their product mix to a higher proportion of high margin athletic apparel and footwear. By improving
their brand presence and better accommodating product mix to consumer preferences, they have been able to improve
efficiency of each asset and their existing stores, with limited exceptions such as their most recent quarter. This has
allowed them to expand with little use of debt. In addition, Dick’s has approached its brand presence expansion through the
usage of their cash balances as sources of funding. Between FY 2011 and FY 2013, cash & cash equivalents decreased
11.2% in relation to revenue (Appendix A-5). Despite having low liquidity due to the heavy use of cash balances used to
grow the company, we believe that they will continue to generate free cash flow per share above the industry average
because of how well they have implemented their corporate strategy focused on long-term growth. There is still the risk
that newly established stores and/or existing stores may perform worse than expected due to a variety of factors leading
DKS to not generate their usual level of free cash flow per share. However, because we are confident in their ability to
generate more than enough cash to pay down their low levels of debt, we believe Dick’s is in great financial condition.
Stock Valuation
We are using a justified P/E ratio of 14.0 times in our valuation, which is higher than Dick’s TTM P/E of 12.78.
We believe this is a conservative multiple based on what investors are willing to pay for comparable companies (Appendix
B-7). Our view is that Dick’s stock is trading much cheaper now because of the recent influx of negative news surrounding
many US retailers, management’s EPS guidance cut for the current fiscal year, and negative performance in the third
quarter consistent with that of overall retail companies. Because we believe Dick’s growth strategy will have its most
beneficial impacts in the future due to how they have improved the defensibility of their competitive position and investors
have proven to pay a historical average of 21.45 times earnings, we have raised our justified P/E higher than that of their
TTM P/E.
We have applied our justified P/E ratio to our expected 2016 diluted EPS of $3.29 (Appendix B-2). Our earnings
per share outlook sharply declined after Dick’s reported earnings in the third quarter. The main drivers behind this were
management’s drastic guidance cut and our belief that to get rid of excess inventory, Dick’s would have to ramp up
promotional activity and sales, which would put pressure on margins (Appendix B-3). This puts our forecasted one year
EPS growth rate at 10.03%, which is significantly lower than their 4-year EPS growth rate of 26.03%. However, as Dick’s
growth in EPS has slowed in recent years, we believe it is more representative of the current picture (Appendix B-6). We
believe our estimate of $3.29 is correct and is a fairly conservative estimate as it is just under consensus EPS of $3.31 and
slightly higher than the average of other analyst’s revisions after the most recent quarter (Appendix B-5).
In regards to our EV/EBITDA multiple, we have used 8.0 times, which is right around both Dick’s and Hibbett’s
TTM EV/EBITDA. Although we see a possibility in Dick’s performing better in the future, we applied a more
conservative multiple to display the risk of a weakened consumer and challenges in developing new stores in that
environment. Our estimate captures the recent performance from DKS and their closest competitor, and it is lower than
both of their three year averages (Appendix B-8), which was a period of increased performance for those in the sporting
goods store industry. We believe that multiples closer to those of the most recent year are more indicative of spending
behaviors than a historical three year view. Using a multiple of 8.0 times and our expected 2016 EBITDA of $851,461, we
arrived at a target price of $58.82.
To arrive at our target price per share of $49.27, we used weighted average of P/E and EV/EBITDA valuation
metrics. We believe our P/E ratio gives a better estimate of how investors will value a sporting goods retailer like Dick’s
than valuation using our EV/EBITDA multiple. Valuation using our EV/EBITDA multiple gives us a target price outside
of the highest of other analyst target prices (Appendix B-9). Thus, we decided to weight our P/E multiple at 75% and
valuation using EV/EBITDA at 25%, arriving at a target price of $49.27 (refer to Appendix B-1 for further valuation
discussion and Appendix B-10 for detailed valuation).
Investment Risks
Risks related to performance include consumer spending behavior, seasonal impacts, effects of Dick’s gross profit
margin, and impact of increased competition. Being involved in retail, Dick’s is inherently vulnerable to changes in
consumer spending habits. This could impact Dick’s because as they have shifted their product mix to high margin apparel
and footwear. The shift in product mix was largely seen as a positive because it goes along with the athleisure trend in the
industry. However, these products tend to be more expensive and their sales could be negatively impacted if consumers are
less willing to spend on discretionary items. This could have a large impact on Dick’s performance because as they have
expanded aggressively to defend against competition and grow their brand, they have also included significant costs. If
customers are not as willing to spend and their new stores that are incurring expenses do not generate the revenue as
expected, their profits could take a hit.
In regards to how many retail companies have performed this most recent quarter, the impacts of unexpected
seasonal adjustments are clear. In the third quarter, many retail companies have reported weaker than expected earnings.
Many of them cite the reason for this as sluggish sales and the build-up of inventory due to surprising warm weather that
impacts more seasonal products. In Dick’s most recent quarter, they had similar problems because of warmer weather that
offset any gains they had in athletic apparel and footwear. It goes to show how prone retail companies are to weather
conditions for a large assortment of products. Selling more apparel in sporting goods stores could leave them more
vulnerable in the future to weather trends and they could have a repeat performance of this most recent quarter. Products
dependent on weather conditions in a Dick’s Sporting Goods store include their hunting equipment and various types of
clothing.
Gross profit has decreased to 30.6% after reaching their peak in 2012 at 31.5%. The decline can be attributed to
expenses related to expansion (Appendix A-1). Main reasons for a decline are higher inventory costs, higher promotional
costs as a percentage of sales, and higher shipping costs. With the recent decline in the gross profit margin, this has a direct
impact on diluted earnings per share. However, due to the five year, $1,000,000,000 share repurchase program announced
in March 2013, the growth rate in diluted EPS has declined at a lesser rate compared to that of the growth rate in net income
(Appendix A-2) as a percentage of sales. Moving forward, store expansion and the variability of associated costs
incorporates risk factors relating to Dick’s overall performance.
Lastly, Dick’s Sporting Goods performance could be influenced by the impact of increased competition. Both
Nike and Under Armour are two major companies that have expressed desires to increase their direct-to-consumer
segments, both with online and physical store locations. This could have an adverse impact on sales because even though
Under Armour and Nike don’t have as wide of a variety, both offer many of the same high quality products and carry
higher brand power.
The impact of these risks can be substantial, each with the ability to put downward pressure on margins, as can be
seen in the most recent quarter. Management’s guidance was cut severely for FY 2015. We believe they anticipate lower
profit margins because of the need to get rid of inventory using more promotional selling measures. Colder weather apparel
and hunting products are often higher margin and higher priced goods. In the absence of typical these key sales in the later
parts of the year, gross profit could suffer. Our forecasts for revenue growth rate and gross profit margins are 8.0% and
30.7% respectively, with a projected diluted EPS of $3.29 for FY 2016. Shown in Table 3, even a small decline in gross
profit margins would have a large impact on earnings per share for DKS.
Table 3: Impact of Investment Risks on Diluted EPS
Source: Analyst’s Calculations
Recommendation
Dick’s Sporting Goods is a HOLD at the current share price of $38.98. Their improvements in e-commerce,
aggressive expansion strategy, relationships with suppliers, and shift to a more favorable product mix based on industry
trends give them the tools to improve their competitive position. This could potentially make them an attractive buy later
on. However, because they are so dependent on consumer spending and are prone to adverse impacts from competition in
companies that have much larger brand power, we only foresee Dick’s moderately besting the market, and with high risk to
that assertion. In the short-term, we expect they will struggle. Management had cut EPS guidance for FY 2015 to a range
of $2.85 - $3.00 from a range of $3.13 to $3.21. They had also indicated that they would have a more promotional
environment in the fourth quarter of this year. We believe this is because their same store sales in the quarter were not as
high as expected and need more marketing efforts to drive up their sales. Promotional costs in the past have proven to be
one of the driving forces in putting pressure on their margins. Even though we expect some margin improvement because
of a better sales mix, higher promotional activity will likely limit these gains once again. We believe Dick’s is a great
company with the possibility of upside because of their attractive store layout and product mix. However, we do not
believe the stock is a buy right now because of the risks involved while they are trying to expand aggressively.
References
1. Bloomberg Finance L.P
2. Athletic Apparel: Outperforming the Competition in 2014. Retrieved from http://fortune.com/2014/12/25/athletic-
apparel-top-performer/. Author: Kell, John.
3. Sporting Goods Logistics: Keeping the Ball Rolling. Retrieved from
http://www.inboundlogistics.com/cms/article/sporting-goods-logistics-keeping-the-ball-rolling/. Author: Brown,
Justine.
4. Product Life Cycle Stages. Retrieved from http://productlifecyclestages.com/product-life-cycle-stages/maturity/
5. 7 Charts that Show the State of Youth Sports in the US and Why it Matters. Retrieved from
http://www.aspeninstitute.org/about/blog/7-charts-that-show-the-state-of-youth-sports-in-the-us-and-why-it-
matters. Author: Lee, Alice.
6. IBISWorld Industry Report 45111 – Sporting goods Stores in the US. IBISworld.com. Retrieved from http://0-
clients1.ibisworld.com/wncln.wncln.org/reports/us/industry/default.aspx?entid=1079.
7. Sporting Goods Industry FAQ. Retrieved from https://www.nsga.org/globalassets/research/public/sporting-goods-
industry-faq---2015.pdf.
8. Edited Transcript of DKS Earnings Conference Call. Retrieved from http://finance.yahoo.comnews/edited-
transcript-dks-earnings-conference-012935404.html.
9. Investor Relations – Dick’s Sporting Goods. Retrieved from http://investors.dicks.com/company-
information/company-overview.aspx.
10. Why Nike Air Jordan, Polo Sport stores-within-a-store coming to Dick’s Sporting Goods Near You. Retrieved
from http://www.bizjournals.com/pittsburgh/news/2015/08/18/why-ralph-laurennike-air-jordan-polo-sport-
stores.html. Author: Schooley, Tim.
11. Dick’s Sporting Goods, Inc. Form 10-K. U.S Securities and Exchange Commission. Retrieved from
http://www.sec.gov/cgi-bin/browse-edgar?CIK=DKS&Find=Search&owner=exclude&action=getcompany
 2010
 2011
 2012
 2013
 2014
12. Dick’s Sporting Goods, Inc. Form 10-Q. U.S Securities and Exchange Commission. Retrieved from
http://www.sec.gov/cgi-bin-browse/edgar?CIK=DKS&Find=Search&ownder=exclude&action=getcompany
 10-Q: Filed 08/28/2014
 10-Q: Filed 11/26/2014
 10-Q: Filed 05/28/2015
 10-Q: Filed 08/27/2015
References (cont.)
13. Dick’s Sporting Goods, Inc. Form 8-K. US Securities and Exchange Commission. Retrieved from
http://www.sec.gov/Archives/edgar/data/1089063/000108906315000084/0001089063-15-000084-index.htm
Appendix A-1: Income Statement
Source: Company Filings & Analyst’s Estimates
INCOMESTATEMENT
Fiscal year 2010A 2011A* 2012A* 2013A 2014A TTM 2015P 2016P
Fiscal year end date 1/29/2011 1/28/2012 2/2/2013 2/1/2014 1/31/2015 10/31/2015 1/31/2016 1/31/2017
Net sales 4,871,492 5,211,802 5,836,119 6,213,173 6,814,479 7,190,920 7,393,710 7,985,206
Cost of good sold, inc. occupancy and distribution costs (3,422,462) (3,616,921) (3,998,956) (4,269,223) (4,727,813) (4,988,743) (5,131,235) (5,533,748)
Gross profit 1,449,030 1,594,881 1,837,163 1,943,950 2,086,666 2,202,177 2,262,475 2,451,458
Selling, general and administrative expenses (1,129,293) (1,148,268) (1,297,413) (1,386,315) (1,502,089) (1,590,424) (1,663,585) (1,812,642)
Pre-opening expenses (10,488) (14,593) (16,076) (20,823) (30,518) (33,874) (36,969) (39,926)
EBIT/income from operations 309,249 432,020 523,674 536,812 554,059 577,879 561,922 598,890
Interest expense (14,016) (13,868) (6,034) (2,929) (3,215) (3,535) (627) (542)
Interest income 0 0 0 0 0 0 0 0
Other income 2,278 (26) 4,555 12,224 5,170 1,119 5,170 5,170
EBT/income before income taxes 297,511 418,126 522,195 546,107 556,014 575,463 566,465 603,519
Provision for income taxes (115,434) (162,651) (212,533) (208,509) (211,816) (218,528) (215,111) (229,182)
Net income 182,077 255,475 309,662 337,598 344,198 356,935 351,354 374,337
Basic shares outstanding 116,236 120,232 121,629 122,878 119,244 116,101 116,045 112,068
Impact of dilutive securities 5,488 5,536 4,366 2,750 1,994 1,638 1,638 1,638
Diluted shares outstanding 121,724 125,768 125,995 125,628 121,238 117,739 117,683 113,706
Basic EPS $1.57 $2.12 $2.55 $2.75 $2.89 $3.07 $3.03 $3.34
DilutedEPS $1.50 $2.03 $2.46 $2.69 $2.84 $3.03 $2.99 $3.29
Appendix A-2: Common-Size Income Statement
Source: Company Filings & Analyst’s Estimates
COMMON-SIZEINCOMESTATEMENT
Fiscal year 2010A 2011A* 2012A* 2013A 2014A TTM 2015P 2016P
Fiscal year end date 1/29/2011 1/28/2012 2/2/2013 2/1/2014 1/31/2015 10/31/2015 1/31/2016 1/31/2017
Net Sales 100.0% 100.0% 100.0% 100.0% 100.0% 100.0% 100.0% 100.0%
Cost of good sold, inc. occupancy and distribution costs 70.3% 69.4% 68.5% 68.7% 69.4% 69.4% 69.4% 69.3%
Gross profit 29.7% 30.6% 31.5% 31.3% 30.6% 30.6% 30.6% 30.7%
Selling, general and administrative expenses 23.2% 22.0% 22.2% 22.3% 22.0% 22.1% 22.5% 22.7%
Pre-opening expenses 0.2% 0.3% 0.3% 0.3% 0.4% 0.5% 0.5% 0.5%
EBIT/income from operations 6.3% 8.3% 9.0% 8.6% 8.1% 8.0% 7.6% 7.5%
Interest expense 0.3% 0.3% 0.1% 0.0% 0.0% 0.0% 0.0% 0.0%
Interest income 0.0% 0.0% 0.0% 0.0% 0.0% 0.0% 0.0% 0.0%
Other income 0.0% 0.0% 0.1% 0.2% 0.1% 0.0% 0.1% 0.1%
EBT/income before income taxes 6.1% 8.0% 8.9% 8.8% 8.2% 8.0% 7.7% 7.6%
Provision for income taxes 2.4% 3.1% 3.6% 3.4% 3.1% 3.0% 2.9% 2.9%
Net income 3.7% 4.9% 5.3% 5.4% 5.1% 5.0% 4.8% 4.7%
Appendix A-3: Balance Sheet
Source: Company Filings & Analyst’s Estimates
BALANCESHEET
Fiscal year 2010A 2011A* 2012A* 2013A 2014A MRQ 2015P 2016P
Fiscal year end date 1/29/2011 1/28/2012 2/2/2013 2/1/2014 1/31/2015 10/31/2015 1/31/2016 1/31/2017
Assets
Current assets:
Cash and cash equivalents 546,052 734,402 345,214 181,731 221,679 73,799 165,397 199,808
Accounts receivable, net 34,978 38,338 34,625 60,779 80,292 96,406 96,118 111,793
Income taxes receivable 9,050 4,113 15,737 7,275 14,293 8,719 14,293 14,293
Inventories, net 896,895 1,014,997 1,096,186 1,232,065 1,390,767 1,997,105 1,693,307 1,770,799
Prepaid expenses and other current assets 58,394 64,213 73,838 99,386 91,767 107,755 91,767 91,767
Deferred income taxes 18,961 12,330 30,289 38,835 51,586 47,789 51,586 51,586
Total current assets 1,564,330 1,868,393 1,595,889 1,620,071 1,850,384 2,331,573 2,112,468 2,240,047
Property and equipment, net 684,886 775,896 840,135 1,084,529 1,203,382 1,341,166 1,384,084 1,579,243
Construction in progress --- leased facilities 0 2,138 0 0 0 0 0 0
Intangible assets, net (inc. Goodwill) 251,664 251,084 299,497 298,849 310,756 310,421 309,203 307,705
Deferred income taxes 27,157 12,566 4,382 2,477 1,862 1,355 1,862 1,862
Other assets 69,499 86,375 147,904 65,561 69,814 73,912 69,814 69,814
Total assets 2,597,536 2,996,452 2,887,807 3,071,487 3,436,198 4,058,427 3,877,432 4,198,670
Liabilities andStockholder's Equity
Current liabilities:
Accounts payable 446,511 510,398 507,247 562,439 614,511 941,973 872,310 913,068
Accrued expenses 279,284 264,073 269,900 265,040 283,828 345,052 354,898 375,305
Deferred revenue and other liabilities 121,753 128,765 146,362 154,384 172,259 133,593 184,843 199,630
Income taxes payable 0 29,484 68,746 19,825 47,698 0 47,698 47,698
Current portion of other long-termdebt and leasing obligations 995 7,426 8,513 899 537 575 800 950
Total current liabilities 848,543 940,146 1,000,768 1,002,587 1,118,833 1,421,193 1,460,549 1,536,651
Long-termliabilities:
Revolver 0 0 0 0 0 342,400 0 0
Long-termdebt and leasing obligations 139,846 151,596 7,762 6,476 5,913 5,477 5,113 4,163
Non-cash obligations for construction in progress --- leased facilities 0 2,138 0 0 0 0 0 0
Deferred income taxes 0 0 7,413 38,617 44,494 29,078 44,494 44,494
Deferred revenue and other liabilities 245,566 269,827 284,540 331,628 434,733 536,973 517,560 574,935
Total long-termliabilities 385,412 423,561 299,715 376,721 485,140 913,928 567,167 623,592
Total liabilities 1,233,955 1,363,707 1,300,483 1,379,308 1,603,973 2,335,121 2,027,715 2,160,243
Stockholder's equity:
Common stock / additional paid-in capital 626,122 700,730 875,217 959,904 1,016,336 1,054,631 1,045,009 1,076,009
Class B common stock 250 250 249 249 249 249 249 249
Retained earnings 730,468 932,871 911,704 1,187,514 1,471,182 1,623,962 1,760,000 2,067,711
Other comprehensive income / (loss) 6,741 118 112 24 (73) (125) (73) (73)
Treasury stock 0 (1,224) (199,958) (455,512) (655,469) (955,411) (955,469) (1,105,469)
Total stockholder's equity 1,363,581 1,632,745 1,587,324 1,692,179 1,832,225 1,723,306 1,849,716 2,038,427
Total liabilities andstockholder's equity 2,597,536 2,996,452 2,887,807 3,071,487 3,436,198 4,058,427 3,877,432 4,198,670
Appendix A-4: Common-Size Balance Sheet
Source: Company Filings & Analyst’s Estimates
COMMON-SIZEBALANCESHEET
Fiscal year 2010A 2011A* 2012A* 2013A 2014A MRQ 2015P 2016P
Fiscal year end date 1/29/2011 1/28/2012 2/2/2013 2/1/2014 1/31/2015 10/31/2015 1/31/2016 1/31/2017
Assets
Current assets:
Cash and cash equivalents 21.0% 24.5% 12.0% 5.9% 6.5% 1.8% 4.3% 4.8%
Accounts receivable, net 1.3% 1.3% 1.2% 2.0% 2.3% 2.4% 2.5% 2.7%
Income taxes receivable 0.3% 0.1% 0.5% 0.2% 0.4% 0.2% 0.4% 0.3%
Inventories, net 34.5% 33.9% 38.0% 40.1% 40.5% 49.2% 43.7% 42.2%
Prepaid expenses and other current assets 2.2% 2.1% 2.6% 3.2% 2.7% 2.7% 2.4% 2.2%
Deferred income taxes 0.7% 0.4% 1.0% 1.3% 1.5% 1.2% 1.3% 1.2%
Total current assets 60.2% 62.4% 55.3% 52.7% 53.8% 57.5% 54.5% 53.4%
Property and equipment, net 26.4% 25.9% 29.1% 35.3% 35.0% 33.0% 35.7% 37.6%
Construction in progress --- leased facilities 0.0% 0.1% 0.0% 0.0% 0.0% 0.0% 0.0% 0.0%
Intangible assets, net (inc. Goodwill) 9.7% 8.4% 10.4% 9.7% 9.0% 7.6% 8.0% 7.3%
Deferred income taxes 1.0% 0.4% 0.2% 0.1% 0.1% 0.0% 0.0% 0.0%
Other assets 2.7% 2.9% 5.1% 2.1% 2.0% 1.8% 1.8% 1.7%
Total assets 100.0% 100.0% 100.0% 100.0% 100.0% 100.0% 100.0% 100.0%
Liabilities andStockholder's Equity
Current liabilities:
Accounts payable 17.2% 17.0% 17.6% 18.3% 17.9% 23.2% 22.5% 21.7%
Accrued expenses 10.8% 8.8% 9.3% 8.6% 8.3% 8.5% 9.2% 8.9%
Deferred revenue and other liabilities 4.7% 4.3% 5.1% 5.0% 5.0% 3.3% 4.8% 4.8%
Income taxes payable 0.0% 1.0% 2.4% 0.6% 1.4% 0.0% 1.2% 1.1%
Current portion of other long-termdebt and leasing obligations 0.0% 0.2% 0.3% 0.0% 0.0% 0.0% 0.0% 0.0%
Total current liabilities 32.7% 31.4% 34.7% 32.6% 32.6% 35.0% 37.7% 36.6%
Long-termliabilities:
Revolver 0.0% 0.0% 0.0% 0.0% 0.0% 8.4% 0.0% 0.0%
Long-termdebt and leasing obligations 5.4% 5.1% 0.3% 0.2% 0.2% 0.1% 0.1% 0.1%
Non-cash obligations for construction in progress --- leased facilities 0.0% 0.1% 0.0% 0.0% 0.0% 0.0% 0.0% 0.0%
Deferred income taxes 0.0% 0.0% 0.3% 1.3% 1.3% 0.7% 1.1% 1.1%
Deferred revenue and other liabilities 9.5% 9.0% 9.9% 10.8% 12.7% 13.2% 13.3% 13.7%
Total long-termliabilities 14.8% 14.1% 10.4% 12.3% 14.1% 22.5% 14.6% 14.9%
Total liabilities 47.5% 45.5% 45.0% 44.9% 46.7% 57.5% 52.3% 51.5%
Stockholder's equity:
Common stock / additional paid-in capital 24.1% 23.4% 30.3% 31.3% 29.6% 26.0% 27.0% 25.6%
Class B common stock 0.0% 0.0% 0.0% 0.0% 0.0% 0.0% 0.0% 0.0%
Retained earnings 28.1% 31.1% 31.6% 38.7% 42.8% 40.0% 45.4% 49.2%
Other comprehensive income / (loss) 0.3% 0.0% 0.0% 0.0% 0.0% 0.0% 0.0% 0.0%
Treasury stock 0.0% 0.0% -6.9% -14.8% -19.1% -23.5% -24.6% -26.3%
Total stockholder's equity 52.5% 54.5% 55.0% 55.1% 53.3% 42.5% 47.7% 48.5%
Total liabilities andstockholder's equity 100.0% 100.0% 100.0% 100.0% 100.0% 100.0% 100.0% 100.0%
Appendix A-5: Balance Sheet as a Percentage of Revenue
Source: Company Filings & Analyst’s Estimates
BALANCESHEET AS % OF REVENUE
Fiscal year 2010A 2011A* 2012A* 2013A 2014A MRQ 2015P 2016P
Fiscal year end date 1/29/2011 1/28/2012 2/2/2013 2/1/2014 1/31/2015 10/31/2015 1/31/2016 1/31/2017
Assets
Current assets:
Cash and cash equivalents 11.2% 14.1% 5.9% 2.9% 3.3% 1.0% 2.2% 2.5%
Accounts receivable, net 0.7% 0.7% 0.6% 1.0% 1.2% 1.3% 1.3% 1.4%
Income taxes receivable 0.2% 0.1% 0.3% 0.1% 0.2% 0.1% 0.2% 0.2%
Inventories, net 18.4% 19.5% 18.8% 19.8% 20.4% 27.8% 22.9% 22.2%
Prepaid expenses and other current assets 1.2% 1.2% 1.3% 1.6% 1.3% 1.5% 1.2% 1.1%
Deferred income taxes 0.4% 0.2% 0.5% 0.6% 0.8% 0.7% 0.7% 0.6%
Total current assets 32.1% 35.8% 27.3% 26.1% 27.2% 32.4% 28.6% 28.1%
Property and equipment, net 14.1% 14.9% 14.4% 17.5% 17.7% 18.7% 18.7% 19.8%
Construction in progress --- leased facilities 0.0% 0.0% 0.0% 0.0% 0.0% 0.0% 0.0% 0.0%
Intangible assets, net (inc. Goodwill) 5.2% 4.8% 5.1% 4.8% 4.6% 4.3% 4.2% 3.9%
Deferred income taxes 0.6% 0.2% 0.1% 0.0% 0.0% 0.0% 0.0% 0.0%
Other assets 1.4% 1.7% 2.5% 1.1% 1.0% 1.0% 0.9% 0.9%
Total assets 53.3% 57.5% 49.5% 49.4% 50.4% 56.4% 52.4% 52.6%
Liabilities andStockholder's Equity
Current liabilities:
Accounts payable 9.2% 9.8% 8.7% 9.1% 9.0% 13.1% 11.8% 11.4%
Accrued expenses 5.7% 5.1% 4.6% 4.3% 4.2% 4.8% 4.8% 4.7%
Deferred revenue and other liabilities 2.5% 2.5% 2.5% 2.5% 2.5% 1.9% 2.5% 2.5%
Income taxes payable 0.0% 0.6% 1.2% 0.3% 0.7% 0.0% 0.6% 0.6%
Current portion of other long-termdebt and leasing obligations 0.0% 0.1% 0.1% 0.0% 0.0% 0.0% 0.0% 0.0%
Total current liabilities 17.4% 18.0% 17.1% 16.1% 16.4% 19.8% 19.8% 19.2%
Long-termliabilities:
Revolver 0.0% 0.0% 0.0% 0.0% 0.0% 4.8% 0.0% 0.0%
Long-termdebt and leasing obligations 2.9% 2.9% 0.1% 0.1% 0.1% 0.1% 0.1% 0.1%
Non-cash obligations for construction in progress --- leased facilities 0.0% 0.0% 0.0% 0.0% 0.0% 0.0% 0.0% 0.0%
Deferred income taxes 0.0% 0.0% 0.1% 0.6% 0.7% 0.4% 0.6% 0.6%
Deferred revenue and other liabilities 5.0% 5.2% 4.9% 5.3% 6.4% 7.5% 7.0% 7.2%
Total long-termliabilities 7.9% 8.1% 5.1% 6.1% 7.1% 12.7% 7.7% 7.8%
Total liabilities 25.3% 26.2% 22.3% 22.2% 23.5% 32.5% 27.4% 27.1%
Stockholder's equity:
Common stock / additional paid-in capital 12.9% 13.4% 15.0% 15.4% 14.9% 14.7% 14.1% 13.5%
Class B common stock 0.0% 0.0% 0.0% 0.0% 0.0% 0.0% 0.0% 0.0%
Retained earnings 15.0% 17.9% 15.6% 19.1% 21.6% 22.6% 23.8% 25.9%
Other comprehensive income / (loss) 0.1% 0.0% 0.0% 0.0% 0.0% 0.0% 0.0% 0.0%
Treasury stock 0.0% 0.0% -3.4% -7.3% -9.6% -13.3% -12.9% -13.8%
Total stockholder's equity 28.0% 31.3% 27.2% 27.2% 26.9% 24.0% 25.0% 25.5%
Total liabilities andstockholder's equity 53.3% 57.5% 49.5% 49.4% 50.4% 56.4% 52.4% 52.6%
Appendix A-6: Financial Ratios
Source: Company Filings & Analyst’s Estimates
RATIO ANALYSIS
Fiscal year 2010A 2011A* 2012A* 2013A 2014A TTM 2015P 2016P Industry Avg.
Fiscal year end date 1/29/2011 1/28/2012 2/2/2013 2/1/2014 1/31/2015 10/31/2015 1/31/2016 1/31/2017
Profitability
Gross Profit Margin 29.7% 30.6% 31.5% 31.3% 30.6% 30.6% 30.6% 30.7% 39.7%
EBIT Margin 6.3% 8.3% 9.0% 8.6% 8.1% 8.0% 7.6% 7.5% 11.1%
EBITDA Margin 9.1% 11.0% 11.7% 11.6% 11.1% 10.9% 10.8% 10.7% 13.5%
PretaxProfit Margin 6.1% 8.0% 8.9% 8.8% 8.2% 8.0% 7.7% 7.6% 10.8%
Net Profit Margin 3.7% 4.9% 5.3% 5.4% 5.1% 5.0% 4.8% 4.7% 6.8%
Return on Assets 7.0% 8.5% 10.7% 11.0% 10.0% 8.8% 9.1% 8.9% 9.9%
Return on Equity 13.4% 15.6% 19.5% 20.0% 18.8% 20.7% 19.0% 18.4% 17.6%
Return on Invested Capital 12.6% 14.7% 19.4% 19.5% 18.7% 17.3% 18.8% 18.2% 16.1%
YOYGrowth in Revenue n/a 7.0% 12.0% 6.5% 9.7% n/a 8.5% 8.0% n/a
YOYGrowth in Net Income n/a 40.3% 21.2% 9.0% 2.0% n/a 2.1% 6.5% n/a
YOYGrowth in Diluted EPS n/a 35.8% 21.0% 9.3% 5.6% n/a 5.2% 10.3% n/a
Asset Management
Inventory Turnover 3.8 times 3.6 times 3.6 times 3.5 times 3.4 times 2.5 times 3.0 times 3.1 times 2.7 times
Average Collection Period 3 days 3 days 2 days 4 days 4 days 5 days 5 days 5 days 213 days
Fixed Asset Turnover 7.1 times 6.7 times 6.9 times 5.7 times 5.7 times 5.4 times 5.3 times 5.1 times 6.4 times
Total Asset Turnover 1.9 times 1.7 times 2.0 times 2.0 times 2.0 times 1.8 times 1.9 times 1.9 times 1.3 times
Leverage andLiquidity
Times Interest Earned 22.1 times 31.2 times 86.8 times 183.3 times 172.3 times 163.5 times 896.5 times 1105.0 times 192.0 times
Long-termDebt/Common Equity 10.3% 9.3% 0.5% 0.4% 0.3% 0.3% 0.3% 0.2% 14.0%
Debt-to-Invested Capital 9.3% 8.5% 0.5% 0.4% 0.3% 0.3% 0.3% 0.2% 18.0%
Total Debt Ratio 47.5% 45.5% 45.0% 44.9% 46.7% 57.5% 52.3% 51.5% 52.3%
Equity Multiplier 1.9 times 1.8 times 1.8 times 1.8 times 1.9 times 2.4 times 2.1 times 2.1 times 2.1 times
Current Ratio 1.8 times 2.0 times 1.6 times 1.6 times 1.7 times 1.6 times 1.4 times 1.5 times 3.5 times
Quick Ratio 0.7 times 0.8 times 0.4 times 0.2 times 0.3 times 0.1 times 0.2 times 0.2 times 1.6 times
Additional Ratios
Free Cash Flow Per Share n/a (0.34) 4.36 1.47 0.50 2.48 2.14 1.14 0.28
Dividend Yield (%) 0.0% 1.2% 5.2% 1.0% 1.0% 1.1% 1.0% 0.9% 0.0%
YOYGrowth in Dividends Per Share 0.0% 5000.0% 400.0% -80.0% 0.0% 10.0% 10.0% 0.0% 0.0%
Weighted-Average Cost of Capital 12.6% 11.5% 10.6% 10.4% 7.9%
BondRatings (list each bondissue andthe rating on the issue) n/a n/a n/a n/a n/a n/a n/a n/a n/a
Appendix A-6: Financial Ratios (cont.)
Source: Company Filings & Analyst’s Estimates
DuPont Analysis
Net profit margin 3.7% 4.9% 5.3% 5.4% 5.1% 5.0% 4.8% 4.7% 6.8%
Total asset turnover 1.9 times 1.7 times 2.0 times 2.0 times 2.0 times 1.8 times 1.9 times 1.9 times 1.3 times
Equity multiplier 1.9 times 1.8 times 1.8 times 1.8 times 1.9 times 2.4 times 2.1 times 2.1 times 2.1 times
Return on equity 13.4% 15.6% 19.5% 20.0% 18.8% 20.7% 19.0% 18.4% 18.6%
ExtendedDuPont Analysis
EBIT Margin 6.3% 8.3% 9.0% 8.6% 8.1% 8.0% 7.6% 7.5%
Total Asset Turnover 1.9 times 1.7 times 2.0 times 2.0 times 2.0 times 1.8 times 1.9 times 1.9 times
Equity Multiplier 1.9 times 1.8 times 1.8 times 1.8 times 1.9 times 2.4 times 2.1 times 2.1 times
Interest Burden 96.2% 96.8% 99.7% 101.7% 100.4% 99.6% 100.8% 100.8%
TaxBurden 61.2% 61.1% 59.3% 61.8% 61.9% 62.0% 62.0% 62.0%
Return on equity 13.4% 15.6% 19.5% 20.0% 18.8% 20.7% 19.0% 18.4%
Free Cash Flow
Net Income n/a 255,475 309,662 337,598 344,198 356,935 351,354 374,337
Plus: Depreciation & Amortization n/a 116,581 125,096 154,928 179,431 180,114 205,324 221,570
Less: Change in Working Capital n/a 212,460 (333,126) 22,363 114,067 89,988 (79,631) 51,476
Less: Capital Expenditures n/a 201,807 219,026 285,668 349,007 154,785 384,473 415,231
Free Cash Flow n/a (42,211) 548,858 184,495 60,555 292,276 251,836 129,201
Appendix B-1: Multiples Justification
Justified P/E
Our P/E used for valuation purposes is 14.0 times. Dick’s TTM P/E is 12.78. We adjusted our P/E higher than that
of the TTM for a number of reasons. First, we believe Dick’s stock is trading at a discount right now. In tandem
with other retailers, Dick’s stock price has fallen considerably in the last month, further pushing their stock down,
which was due to poor performance in the third quarter. Dick’s management had stated the main reason for this was
an unexpected warmer climate that impacted cold weather apparel and hunting equipment sales. We believe that
this is not an event that will occur with any sort of regularity. However, because it does expose Dick’s weakness to
unexpected weather changes, we still believe that in the future, investors will not be willing to pay as much for DKS
stock as they have in the past. Historically, their stock has been trading at 21.45 times. This accounts for years
when Dick’s was growing at a much more rapid pace than they are and does not reflect their current situation. It
also does not reflect what investors are willing to pay for comparable companies. Hibbett Sports’ TMM P/E is
11.48 and Cabela’s TTM P/E is 17.01, where Hibbett Sports is a closer comparison to DKS. Thus, because Dick’s
is not growing as fast as they have been in the past and they are currently have some troubles along with the rest of
the retail sector, we believe that investors will only be willing to pay a slight amount more for their stock in 14
months (14.0 vs. 12.78).
EV/EBITDA
The EV/EBITDA multiple we have used for valuation purposes is 8.0 times. In this case we decided to use a
conservative estimate. Dick’s TTM EV/EVBITDA is 7.93 and Hibbett Sports’ TTM EV/EBITDA is 8.04. They are
trading lower than both their three year and five year EV/EBITDA historical averages. We believe Dick’s EBIT
margins have upside potential because we are convinced that their growth strategy has positioned themselves better
than competitors in the future. However, there is a fair amount of risk in them being able to generate their expected
profits from the new stores they have been opening. Thus, we applied a conservative estimate of 8.0 times to reflect
the risk of Dick’s aggressive expansion potentially being impacted by increasing competition from companies with
larger brand power and weaker consumer spending.
Weighted-Average Target Price
Our target price per share of $49.27 is a function of a weighted average of both valuation metrics. We weighted P/E
valuation at 75% and EV/EBITDA valuation at 25%. We weighted P/E valuation much higher because we view its
target price as being more realistic. With a consensus target price of $46.74 and the highest analyst target price
being $55 (based on revised target prices after weak Q3), a target price of $58.82 reached with our EV/EBITDA
valuation seemed much too high. P/E valuation returned a target price of $46.09, which we believe is much more
reasonable. In addition, we expect that investors could be wary of investing in retail stocks given recent negative
news and that our P/E valuation reflects this better than EV/EBITDA valuation.
Appendix B-2: EPS Justification
Diluted EPS
Our forecasted diluted earnings per share for FY 2016 is $3.29. This is lower than consensus EPS, but is higher than
average broker analyst’s estimates of EPS of $3.26 (after Nov 17). We chose to compare to both consensus EPS and
broker analyst’s estimates of EPS after Nov 17 because Dick’s third quarter earnings came out the morning of Nov
17. Before earnings release, many analysts had projected EPS for FY 2016 between $3.50 and $3.60. Sharp
downward revisions were made after the company downgraded its FY 2015 EPS guidance from a range of $3.13 -
$3.21 to a range of $2.85 - $3.00. This made a substantial difference in our EPS estimates as well. In addition to
management lowering EPS guidance for FY 2015, we believe a big driver for the lowering of many other analyst’s
estimates was the anticipated pressure on profit margins. Management had stated that the fourth quarter would be a
more promotional environment and in the past, promotional costs have put a damper on margins even in the
presence of gains from shifting to a higher margin product mix. After earnings were released, we made adjustments
to both gross and SG&A margins to reflect our takeaways from the earnings report, which made our forecasted EPS
relatively close in-line with those of other analysts.
Appendix B-3: Income Statement Assumptions
Income Statement Assumptions 2015P 2016P
Revenue Growth 8.5% 8.0%
Gross Profit Margin 30.6% 30.7%
SG&A Margin 22.5% 22.7%
Pre-opening Expenses as a % of Sales 0.5% 0.5%
Marginal Tax Rate 38.0% 38.0%
Source: Analyst’s Calculations
Revenue Growth: our forecasts shows strong revenue growth in FY 2015 and FY 2016, although at a decreasing
rate. We believe revenue growth will remain strong because of how DKS has improved their brand power and
online presence, giving them some protection from increased competition. However, competition is increasing and
will likely have some impact, especially on new stores where Dick’s brand is less established. Thus, we have stated
revenue at a declining rate. This is fairly in-line with consensus revenue estimates for FY 2016. Our model
forecasts $7.985B in FY 2016 while consensus estimates are at $7.933B.
Gross Profit Margin: forecasts for gross profit margins show only a marginal increase. After DKS third quarter
earnings release, they had discussed a more promotional environment in the coming months to get rid of their
inventory that had piled up because of unanticipated weather conditions. Although we still believe their shift in
product mix to higher margin apparel and footwear is a good move, it does come with risks. In their most recent 10-
K, they had cited promotional costs as being a big factor in offsetting gains from improvements in sales mix. We
believe they will be more profitable over a longer horizon, but in 14 months, we expect the build-up of inventory
and the promotional activity will put downward pressure on margins, especially because colder weather apparel
tends to be higher margin goods and future weak consumer spending could result in more promotional activity.
SG&A Margin: major expenses for Dick’s in this line item include advertising, marketing, and payroll costs. We
forecasted an increase for selling, general, and administrative expenses as a percentage of sales because as they
expand away from the southeast where their brand is strong, there is the risk that their stores won’t be as productive
and more advertising efforts may need to be put into place to get more production out of them.
Pre-opening Expenses as a % of Sales: this line item mainly includes marketing and payroll costs incurred before
a store is opened. In accordance with their growth strategy, we forecasted increases in pre-opening expenses
roughly similar to the increases they’ve had in the past, demonstrating steady growth in number of stores.
Appendix B-3: Income Statement Assumptions (cont.)
Marginal Tax Rate: we forecasted a tax rate of 38.0%. This is in-line with what they have paid in the trailing
twelve months.
Appendix B-4: Other Key Modeling Assumptions
Treasury Stock: for our treasury stock schedule, we have forecasted $300M of stock repurchases in FY 2015 and
$150M of stock repurchases in FY 2016. In March of 2013, Dick’s authorized a five year, one billion dollar share
repurchase program. As of Q3 in FY 2015, Dick’s has spent $300M in stock repurchases. Because of their recent
struggles, we do not foresee more buybacks in the period as $300M in one fiscal year already surpasses any of their
previous amounts. The amount remaining in their five year repurchase program is $245M. In FY 2016, we
forecasted that DKS would repurchase $150M in common stock as they’re share price is trading significantly lower
than their high of approximately $60 in 2016. We believe they would repurchase a significant amount as they could
buy back their stock at a relatively discounted price to reward shareholders, leaving approximately $100M left on
their repurchase program.
Revolver: in the most recent quarter, Dick’s had $342,400,000 in outstanding debt on their revolving credit facility.
Our forecast shows them ending FY 2015 with a zero balance as stated by management. For the following year in
FY 2016, we also forecast a zero balance for year end, staying consistent the company’s historical use of their
revolver.
Appendix B-5: Security Analyst’s Estimates
Firm Analyst Date Estimated EPS
Stifel David A Schick 11.19.15 $3.33
PERM DENIED Req. Entitlement 11.18.15 $3.46
PERM DENIED Req. Entitlement 11.18.15 $3.15
Brean Capital LLC Eric B Tracy 11.18.15 $3.15
PERM DENIED Req. Entitlement 11.18.15 $3.15
PERM DENIED Req. Entitlement 11.18.15 $3.25
PERM DENIED Req. Entitlement 11.18.15 $3.34
PERM DENIED Req. Entitlement 11.18.15 $3.25
PERM DENIED Req. Entitlement 11.18.15 $3.34
PERM DENIED Req. Entitlement 11.18.15 $3.30
PERM DENIED Req. Entitlement 11.18.15 $3.36
PERM DENIED Req. Entitlement 11.17.15 $3.25
PERM DENIED Req. Entitlement 11.17.15 $3.27
PERM DENIED Req. Entitlement 11.17.15 $3.57
PERM DENIED Req. Entitlement 11.17.15 $3.42
PERM DENIED Req. Entitlement 11.17.15 $3.13
SunTrust Robinson Humphrey Req. Entitlement 11.17.15 $3.30
PERM DENIED Req. Entitlement 11.17.15 $3.21
PERM DENIED Req. Entitlement 11.17.15 $3.25
Raymond James Daniel R Wewer Jr 11.17.15 $3.30
PERM DENIED Req. Entitlement 11.17.15 $3.40
Oppenheimer & Co Brian W Nagel 11.17.15 $3.10
PERM DENIED Req. Entitlement 11.17.15 $3.53
PERM DENIED Req. Entitlement 11.17.15 $3.18
Susquehanna Financial Christopher Svezia 11.17.15 $3.28
Wolfe Research Aram Rubinson 11.17.15 $2.76
Source: Bloomberg
Consensus EPS = $3.31
High (Date ≥ Nov.17) = $3.57
Average EPS (Date ≥ Nov.17) = $3.26
Low (Date ≥ Nov.17) = $2.76
Our Estimated EPS = $3.29
Appendix B-6: Earnings Growth Rate Estimate Applied to Current Earnings
DKS Historical EPS Data
Fiscal Year EPS 1 Yr. Growth Rate
2014 $2.84 5.6%
2013 $2.69 28.1%
2012 $2.10 40.0%
2011 $1.50 30.4%
2010 $1.15 419.4%
2009 ($0.36) (127.1%)
2008 $1.33 31.68%
2007 $1.01 48.53%
2006 $0.68 6.25%
2005 $0.64 156.0%
2004 $0.25 n/a
Source: Bloomberg and Analyst’s Calculations
4 Yr. EPS Growth = 26.03%
EPS2016 = 2.84 (1+0.2603)14/12
= $3.72 (4 Yr. EPS growth rate applied to current EPS)
Note: Only four years of historical data were included in EPS growth rate calculations. The growth rate in 2010 is
skewed because of how poorly Dick’s performed after the recession. Prior to 2010, their growth rates were very
sporadic. Thus, we believe that only the past four years of data have real meaning.
Appendix B-7: Comparative Analysis of P/E Ratios
P/E Multiple
TTM P/E – DKS 12.78
TTM P/E – HIBB 11.48
TTM P/E – CAB 17.01
Historical Average P/E – DKS 21.45
Historical Average P/E – HIBB 20.25
Justified P/E 14.00
Source: Bloomberg & Analyst’s Calculations
Note: For comparative analysis of P/E ratios, we focused on what investors are willing to pay for Dick’s Sporting
Goods and their competitors most recently, and what investors are willing to pay for Dick’s and their closest
competitor historically. We chose to closely look at what investors are willing to pay for DKS and comparable
companies most recently because retail, in general, have been hit pretty hard by the market recently. Many major
retailers have reported sour earnings and that has had an impact on Dick’s and Hibbett Sports particularly. To a
lesser degree, we considered what investors are willing pay to for Dick’s and their closest competitor on a historical
basis because today’s prices are trading at a discount. However, because we believe that investor expectations of
retail stocks will remain fairly low, but we placed more weight on TTM P/E ratios.
Appendix B-8: Comparative Analysis of EV/EBITDA Ratios
EV/EBITDA Comparison
TTM EV/EBITDA – DKS 7.93
TTM EV/EBITDA – HIBB 8.04
Historical 3 Yr. Average EV/EBITDA – DKS 8.46
Historical 3 Yr. Average EV/EBITDA – HIBB 9.67
Justified EV/EBITDA 8.00
Source: Bloomberg & Analyst’s Calculations
Note: For EV/EBITDA ratios we placed most of our emphasis on comparing Dick’s Sporting Goods to Hibbett
Sports. Cabela’s, although a competitor in the industry, sells a much larger proportion of outdoor equipment. Thus,
aside from a few similarities, they face a different set of risks to operating profits than Dick’s and Hibbett Sports do.
As a conservative estimate, we estimated closer to TTM EV/EBITDA between both DKS and HIBB because we
Dick’s current performance will be closer to future performance than an average of performance from three years
ago. Dick’s EBITDA margins peaked in 2012 and have declined steadily since then.
Appendix B-9: Target Price Estimates
Broker Analyst Target Price Estimates
Firm Analyst Date Target Price
Stifel David A Shick 11.19.15 $46
Monness, Crespi, Hardt & Co Jim Chartier 11.19.15 $45
Morgan Stanley Simeon Gutman 11.18.15 $44
Goldman Sachs Stephen Tanal 11.18.15 $49
Brean Capital LLC Eric B Tracy 11.18.15 $44
UBS Michael Lasser 11.18.15 $43
Stephens Inc Rick Nelson 11.18.15 $42
Canaccord Genuity Camilo R Lyon 11.18.15 $46
Barclays Matthew McClintock 11.18.15 $50
Tesley Advisory Group Joseph I Feldman 11.18.15 $50
BMO Capital Markets Wayne Hood 11.17.15 $48
RBC Capital Markets R Scot Ciccarelli 11.17.15 $45
Credit Suisse Seth Sigman 11.17.15 $40
SunTrust Robinson Humphrey David G Magee 11.17.15 $43
J.P Morgan Christopher Horvers 11.17.15 $41
Robert Baird Peter S Benedict 11.17.15 $42
Sterne Agee CRT Sam Poser 11.17.15 $55
Cowen John Kernan 11.17.15 $43
Susquehanna Financial Christopher Svezia 11.17.15 $53
Wolfe Research Aram Rubinson 11.17.15 $32
Argus Research Corp Christopher Graja 08.26.15 $63
Imperial Capital LLC John O’Neil 07.08.15 $62
Source: Bloomberg
Note: Third quarter results were reported November 17, 2015
Consensus Target Price = $46.74
High (Date ≥ Nov 17) = $55
Average Target Price (Date ≥ Nov 17) = $45.05
Low (Date ≥ Nov 17) = $32
Our Target Price = $49.27
Appendix B-10: Valuation Template
Source: Analyst’s Calculations
Valuation Date November 20, 2015
Target Date January 31, 2017
Expected Diluted EPS $3.29 Method Value Weight Product
Justified P/E 14.0 P/E Multiple 46.09$ 75% 34.57
Target Price 46.09$ EV/EBITDA Multiple 58.82$ 25% 14.70
Target Price Per Share 49.27$
Expected EBITDA 851,461$ Risk-free rate 3.02%
Justified EV/EBITDA 8.0 Market risk premium 6.7%
Enterprise Value 6,811,689$ Beta 0.93
Required Rate of Return 9.3%
Size Premium 1.01%
Current portion of L-T debt - Required Return Adjusted for Size 10.3%
Current portion of capital leases 950
Short termdebt -
Long termdebt - Target Price 49.27$
Capital leases 4,163 Required Return 10.3%
Minority interest - Number of months to discount 14
Preferred stock - Current value $43.97
Other -
Less: Excess cash 118,421
Less: Investment securities - Current Stock Value $43.97
Less: Other Nonoperating assets - Current Stock Price 38.90$
Less: Equity investments - Margin of Safety 13.0%
Net Debt 123,534$
Enterprise Value 6,811,689
Less: Net Debt (123,534)
Equity Value 6,688,156$
Equity Value 6,688,156
Shares outstanding 113,706
Equity value / share 58.82$
Current Value Calculation
Margin of Safety Calculation
Calculation of Equity Value
Calculation of Equity Value per Share
Valuation Basedon P/E Targe Price Calculation
Valuation Basedon EV/EBITDA
Calculation of Enterprise Value Estimating RequiredRate of Return on Equity
Calculation of ExpectedNet Debt

More Related Content

What's hot

Sporting goods
Sporting goodsSporting goods
Sporting goods9418001038
 
IMC 610 Integrated Marketing Communication Plan for Kmart
IMC 610 Integrated Marketing Communication Plan for KmartIMC 610 Integrated Marketing Communication Plan for Kmart
IMC 610 Integrated Marketing Communication Plan for KmartStephanie Marchant
 
Group 7 Final: Target to Expand Internationally to Mexico (final draft)
Group 7 Final: Target to Expand Internationally to Mexico (final draft) Group 7 Final: Target to Expand Internationally to Mexico (final draft)
Group 7 Final: Target to Expand Internationally to Mexico (final draft) Kenneth Griffith
 
Hunter Boots Wellington - case study report
Hunter Boots Wellington - case study reportHunter Boots Wellington - case study report
Hunter Boots Wellington - case study reportAttila Németh
 
Molson Canadian vs Labatt Blue Battle of the Brands
Molson Canadian vs Labatt Blue Battle of the BrandsMolson Canadian vs Labatt Blue Battle of the Brands
Molson Canadian vs Labatt Blue Battle of the BrandsKey Point Consultants
 
Abercrombie & Fitch in Brazil
Abercrombie & Fitch in BrazilAbercrombie & Fitch in Brazil
Abercrombie & Fitch in BrazilLuis Banlaky
 
Michael Kors - SHA15444384
Michael Kors - SHA15444384Michael Kors - SHA15444384
Michael Kors - SHA15444384Simaan Shaikh
 
Strategic Marketing Plan - Michael Kors
Strategic Marketing Plan - Michael KorsStrategic Marketing Plan - Michael Kors
Strategic Marketing Plan - Michael KorsApple Lee
 
Garibaldi_Genesis_Michael Kors Accounting Annual Report
Garibaldi_Genesis_Michael Kors Accounting Annual ReportGaribaldi_Genesis_Michael Kors Accounting Annual Report
Garibaldi_Genesis_Michael Kors Accounting Annual ReportGenesis Garibaldi
 
JumpBall Apparel - The New Breed
JumpBall Apparel - The New Breed JumpBall Apparel - The New Breed
JumpBall Apparel - The New Breed Danny Essix
 
American Apparel Integrated Marketing Strategy
American Apparel Integrated Marketing StrategyAmerican Apparel Integrated Marketing Strategy
American Apparel Integrated Marketing StrategySona Martirosian
 
IMC 610 Final Project: IMC Plan for Kmart featuring Adam Levine
IMC 610 Final Project: IMC Plan for Kmart featuring Adam LevineIMC 610 Final Project: IMC Plan for Kmart featuring Adam Levine
IMC 610 Final Project: IMC Plan for Kmart featuring Adam LevineSusan Sullivan
 
A Marketing Research Proposal for Michael Kors (March 2016)
A Marketing Research Proposal for Michael Kors (March 2016)A Marketing Research Proposal for Michael Kors (March 2016)
A Marketing Research Proposal for Michael Kors (March 2016)Ashley Peterson
 
IMC 610: Intro to Integrated Marketing Communication Class Final Project (Kmart)
IMC 610: Intro to Integrated Marketing Communication Class Final Project (Kmart)IMC 610: Intro to Integrated Marketing Communication Class Final Project (Kmart)
IMC 610: Intro to Integrated Marketing Communication Class Final Project (Kmart)Colin Haas
 
Organization And Management Kmart
Organization And Management KmartOrganization And Management Kmart
Organization And Management Kmartguest634b8da
 
Specialty Retail Clothing Industry Evaluation
Specialty Retail Clothing Industry EvaluationSpecialty Retail Clothing Industry Evaluation
Specialty Retail Clothing Industry Evaluationjschiff47
 
Adidas 'Sneakerhead Market' Research Plan
Adidas 'Sneakerhead Market' Research Plan Adidas 'Sneakerhead Market' Research Plan
Adidas 'Sneakerhead Market' Research Plan Daniel Lawrence
 
Coors Marketing Plan 2
Coors Marketing Plan 2Coors Marketing Plan 2
Coors Marketing Plan 2tpaterson42
 

What's hot (20)

Sporting goods
Sporting goodsSporting goods
Sporting goods
 
IMC 610 Integrated Marketing Communication Plan for Kmart
IMC 610 Integrated Marketing Communication Plan for KmartIMC 610 Integrated Marketing Communication Plan for Kmart
IMC 610 Integrated Marketing Communication Plan for Kmart
 
Group 7 Final: Target to Expand Internationally to Mexico (final draft)
Group 7 Final: Target to Expand Internationally to Mexico (final draft) Group 7 Final: Target to Expand Internationally to Mexico (final draft)
Group 7 Final: Target to Expand Internationally to Mexico (final draft)
 
Hunter Boots Wellington - case study report
Hunter Boots Wellington - case study reportHunter Boots Wellington - case study report
Hunter Boots Wellington - case study report
 
Molson Canadian vs Labatt Blue Battle of the Brands
Molson Canadian vs Labatt Blue Battle of the BrandsMolson Canadian vs Labatt Blue Battle of the Brands
Molson Canadian vs Labatt Blue Battle of the Brands
 
Abercrombie & Fitch in Brazil
Abercrombie & Fitch in BrazilAbercrombie & Fitch in Brazil
Abercrombie & Fitch in Brazil
 
Michael Kors - SHA15444384
Michael Kors - SHA15444384Michael Kors - SHA15444384
Michael Kors - SHA15444384
 
Strategic Marketing Plan - Michael Kors
Strategic Marketing Plan - Michael KorsStrategic Marketing Plan - Michael Kors
Strategic Marketing Plan - Michael Kors
 
Garibaldi_Genesis_Michael Kors Accounting Annual Report
Garibaldi_Genesis_Michael Kors Accounting Annual ReportGaribaldi_Genesis_Michael Kors Accounting Annual Report
Garibaldi_Genesis_Michael Kors Accounting Annual Report
 
JumpBall Apparel - The New Breed
JumpBall Apparel - The New Breed JumpBall Apparel - The New Breed
JumpBall Apparel - The New Breed
 
240CoachFinalProduct
240CoachFinalProduct240CoachFinalProduct
240CoachFinalProduct
 
American Apparel Integrated Marketing Strategy
American Apparel Integrated Marketing StrategyAmerican Apparel Integrated Marketing Strategy
American Apparel Integrated Marketing Strategy
 
IMC 610 Final Project: IMC Plan for Kmart featuring Adam Levine
IMC 610 Final Project: IMC Plan for Kmart featuring Adam LevineIMC 610 Final Project: IMC Plan for Kmart featuring Adam Levine
IMC 610 Final Project: IMC Plan for Kmart featuring Adam Levine
 
A Marketing Research Proposal for Michael Kors (March 2016)
A Marketing Research Proposal for Michael Kors (March 2016)A Marketing Research Proposal for Michael Kors (March 2016)
A Marketing Research Proposal for Michael Kors (March 2016)
 
IMC 610: Intro to Integrated Marketing Communication Class Final Project (Kmart)
IMC 610: Intro to Integrated Marketing Communication Class Final Project (Kmart)IMC 610: Intro to Integrated Marketing Communication Class Final Project (Kmart)
IMC 610: Intro to Integrated Marketing Communication Class Final Project (Kmart)
 
Sports goods retailing
Sports goods retailingSports goods retailing
Sports goods retailing
 
Organization And Management Kmart
Organization And Management KmartOrganization And Management Kmart
Organization And Management Kmart
 
Specialty Retail Clothing Industry Evaluation
Specialty Retail Clothing Industry EvaluationSpecialty Retail Clothing Industry Evaluation
Specialty Retail Clothing Industry Evaluation
 
Adidas 'Sneakerhead Market' Research Plan
Adidas 'Sneakerhead Market' Research Plan Adidas 'Sneakerhead Market' Research Plan
Adidas 'Sneakerhead Market' Research Plan
 
Coors Marketing Plan 2
Coors Marketing Plan 2Coors Marketing Plan 2
Coors Marketing Plan 2
 

Viewers also liked

Мультиканальные последовательности, автор Антон Липский
Мультиканальные последовательности, автор Антон ЛипскийМультиканальные последовательности, автор Антон Липский
Мультиканальные последовательности, автор Антон ЛипскийTanya Mikhalchenko
 
Caso tivo
Caso tivoCaso tivo
Caso tivoPUCPR
 
TiVo Presentation
TiVo PresentationTiVo Presentation
TiVo Presentationmikerpitt
 
principle of accounts sba
principle of accounts sbaprinciple of accounts sba
principle of accounts sbaShanny Brown
 
Principles of accounts sba
Principles of accounts sbaPrinciples of accounts sba
Principles of accounts sbaAnnakay Blake
 
How Millennials are Affecting the Workplace
How Millennials are Affecting the WorkplaceHow Millennials are Affecting the Workplace
How Millennials are Affecting the WorkplaceElodie A.
 

Viewers also liked (11)

Dicks Sporting Goods
Dicks Sporting GoodsDicks Sporting Goods
Dicks Sporting Goods
 
Мультиканальные последовательности, автор Антон Липский
Мультиканальные последовательности, автор Антон ЛипскийМультиканальные последовательности, автор Антон Липский
Мультиканальные последовательности, автор Антон Липский
 
3d shapes
3d shapes3d shapes
3d shapes
 
CFA IRC Team E
CFA IRC Team ECFA IRC Team E
CFA IRC Team E
 
accounts sba
accounts sbaaccounts sba
accounts sba
 
Tivo
TivoTivo
Tivo
 
Caso tivo
Caso tivoCaso tivo
Caso tivo
 
TiVo Presentation
TiVo PresentationTiVo Presentation
TiVo Presentation
 
principle of accounts sba
principle of accounts sbaprinciple of accounts sba
principle of accounts sba
 
Principles of accounts sba
Principles of accounts sbaPrinciples of accounts sba
Principles of accounts sba
 
How Millennials are Affecting the Workplace
How Millennials are Affecting the WorkplaceHow Millennials are Affecting the Workplace
How Millennials are Affecting the Workplace
 

Similar to Dick's Sporting Goods, Inc. Analyst Report

Nihar Patel - DKS HF Report
Nihar Patel - DKS HF ReportNihar Patel - DKS HF Report
Nihar Patel - DKS HF ReportNihar Patel
 
Wholesale Club Industry Analysis
Wholesale Club Industry AnalysisWholesale Club Industry Analysis
Wholesale Club Industry AnalysisDante Frontiera II
 
My cap stone project is below(My proposed Capstone project is .docx
My cap stone project is below(My proposed Capstone project is .docxMy cap stone project is below(My proposed Capstone project is .docx
My cap stone project is below(My proposed Capstone project is .docxroushhsiu
 
Brand Valuation Methodology
Brand Valuation MethodologyBrand Valuation Methodology
Brand Valuation MethodologyJulia Orsa
 
RESEARCHINTRODUCTIONAs people these days are concerned abo.docx
RESEARCHINTRODUCTIONAs people these days are concerned abo.docxRESEARCHINTRODUCTIONAs people these days are concerned abo.docx
RESEARCHINTRODUCTIONAs people these days are concerned abo.docxaudeleypearl
 
Target Corporation - Strategic Analysis
Target Corporation - Strategic AnalysisTarget Corporation - Strategic Analysis
Target Corporation - Strategic AnalysisKyle Brown
 
Assessment of most selling staples & FMCG products in mop & pop stores close ...
Assessment of most selling staples & FMCG products in mop & pop stores close ...Assessment of most selling staples & FMCG products in mop & pop stores close ...
Assessment of most selling staples & FMCG products in mop & pop stores close ...BHOMA RAM
 
Emmerging tech assignment 1
Emmerging tech assignment 1Emmerging tech assignment 1
Emmerging tech assignment 1tiyabanu123
 
costco Assigment.docx
costco Assigment.docxcostco Assigment.docx
costco Assigment.docxsdfghj21
 
Foundations of Marketing
Foundations of MarketingFoundations of Marketing
Foundations of MarketingMaithiliKoparde
 
Costco
CostcoCostco
Costcolakvij
 
Boardroom Eco Apparel Marketing Plan
Boardroom Eco Apparel Marketing PlanBoardroom Eco Apparel Marketing Plan
Boardroom Eco Apparel Marketing PlanSaqib Yakoob Hussain
 
Derivatives ProjectFall 2020 - FIN 42206220Due Decemb
Derivatives ProjectFall 2020 - FIN 42206220Due DecembDerivatives ProjectFall 2020 - FIN 42206220Due Decemb
Derivatives ProjectFall 2020 - FIN 42206220Due DecembLinaCovington707
 
Unlock the Secrets to Conquering Costco Wholesale with Tim Forrest
Unlock the Secrets to Conquering Costco Wholesale with Tim ForrestUnlock the Secrets to Conquering Costco Wholesale with Tim Forrest
Unlock the Secrets to Conquering Costco Wholesale with Tim ForrestTim Forrest Consulting
 
Costco: Banking on Consistency and Efficiency
Costco: Banking on Consistency and Efficiency  Costco: Banking on Consistency and Efficiency
Costco: Banking on Consistency and Efficiency James Rothaar
 
GNC Presentation on Growth from 2011
GNC Presentation on Growth from 2011GNC Presentation on Growth from 2011
GNC Presentation on Growth from 2011Neil Kimberley
 
Target analysis
Target analysisTarget analysis
Target analysisHao Zheng
 

Similar to Dick's Sporting Goods, Inc. Analyst Report (20)

Nihar Patel - DKS HF Report
Nihar Patel - DKS HF ReportNihar Patel - DKS HF Report
Nihar Patel - DKS HF Report
 
Wholesale Club Industry Analysis
Wholesale Club Industry AnalysisWholesale Club Industry Analysis
Wholesale Club Industry Analysis
 
POB SBA 2014
POB SBA 2014POB SBA 2014
POB SBA 2014
 
My cap stone project is below(My proposed Capstone project is .docx
My cap stone project is below(My proposed Capstone project is .docxMy cap stone project is below(My proposed Capstone project is .docx
My cap stone project is below(My proposed Capstone project is .docx
 
Brand Valuation Methodology
Brand Valuation MethodologyBrand Valuation Methodology
Brand Valuation Methodology
 
RESEARCHINTRODUCTIONAs people these days are concerned abo.docx
RESEARCHINTRODUCTIONAs people these days are concerned abo.docxRESEARCHINTRODUCTIONAs people these days are concerned abo.docx
RESEARCHINTRODUCTIONAs people these days are concerned abo.docx
 
Target Corporation - Strategic Analysis
Target Corporation - Strategic AnalysisTarget Corporation - Strategic Analysis
Target Corporation - Strategic Analysis
 
Assessment of most selling staples & FMCG products in mop & pop stores close ...
Assessment of most selling staples & FMCG products in mop & pop stores close ...Assessment of most selling staples & FMCG products in mop & pop stores close ...
Assessment of most selling staples & FMCG products in mop & pop stores close ...
 
Emmerging tech assignment 1
Emmerging tech assignment 1Emmerging tech assignment 1
Emmerging tech assignment 1
 
costco Assigment.docx
costco Assigment.docxcostco Assigment.docx
costco Assigment.docx
 
Foundations of Marketing
Foundations of MarketingFoundations of Marketing
Foundations of Marketing
 
Costco
CostcoCostco
Costco
 
Boardroom Eco Apparel Marketing Plan
Boardroom Eco Apparel Marketing PlanBoardroom Eco Apparel Marketing Plan
Boardroom Eco Apparel Marketing Plan
 
Retail Strategy.pdf
Retail Strategy.pdfRetail Strategy.pdf
Retail Strategy.pdf
 
Maximize Final
Maximize FinalMaximize Final
Maximize Final
 
Derivatives ProjectFall 2020 - FIN 42206220Due Decemb
Derivatives ProjectFall 2020 - FIN 42206220Due DecembDerivatives ProjectFall 2020 - FIN 42206220Due Decemb
Derivatives ProjectFall 2020 - FIN 42206220Due Decemb
 
Unlock the Secrets to Conquering Costco Wholesale with Tim Forrest
Unlock the Secrets to Conquering Costco Wholesale with Tim ForrestUnlock the Secrets to Conquering Costco Wholesale with Tim Forrest
Unlock the Secrets to Conquering Costco Wholesale with Tim Forrest
 
Costco: Banking on Consistency and Efficiency
Costco: Banking on Consistency and Efficiency  Costco: Banking on Consistency and Efficiency
Costco: Banking on Consistency and Efficiency
 
GNC Presentation on Growth from 2011
GNC Presentation on Growth from 2011GNC Presentation on Growth from 2011
GNC Presentation on Growth from 2011
 
Target analysis
Target analysisTarget analysis
Target analysis
 

Dick's Sporting Goods, Inc. Analyst Report

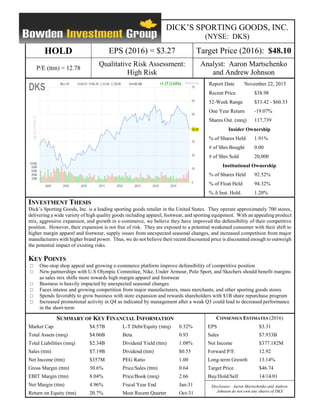
  • 1. DICK’S SPORTING GOODS, INC. (NYSE: DKS) HOLD EPS (2016) = $3.27 Target Price (2016): $48.10 P/E (ttm) = 12.78 Qualitative Risk Assessment: High Risk Analyst: Aaron Martschenko and Andrew Johnson Report Date November 22, 2015 Recent Price $38.98 52-Week Range $33.42 - $60.33 One Year Return -19.07% Shares Out. (mrq) 117,739 Insider Ownership % of Shares Held 1.91% # of Shrs Bought 0.00 # of Shrs Sold 20,000 Institutional Ownership % of Shares Held 92.52% % of Float Held 94.32% % Δ Inst. Hold. 1.20% INVESTMENT THESIS Dick’s Sporting Goods, Inc. is a leading sporting goods retailer in the United States. They operate approximately 700 stores, delivering a wide variety of high quality goods including apparel, footwear, and sporting equipment. With an appealing product mix, aggressive expansion, and growth in e-commerce, we believe they have improved the defensibility of their competitive position. However, their expansion is not free of risk. They are exposed to a potential weakened consumer with their shift to higher margin apparel and footwear, supply issues from unexpected seasonal changes, and increased competition from major manufacturers with higher brand power. Thus, we do not believe their recent discounted price is discounted enough to outweigh the potential impact of existing risks. KEY POINTS □ One-stop shop appeal and growing e-commerce platform improve defensibility of competitive position □ New partnerships with U.S Olympic Committee, Nike, Under Armour, Polo Sport, and Skechers should benefit margins as sales mix shifts more towards high margin apparel and footwear □ Business is heavily impacted by unexpected seasonal changes □ Faces intense and growing competition from major manufacturers, mass merchants, and other sporting goods stores □ Spends favorably to grow business with store expansion and rewards shareholders with $1B share repurchase program □ Increased promotional activity in Q4 as indicated by management after a weak Q3 could lead to decreased performance in the short-term SUMMARY OF KEY FINANCIAL INFORMATION CONSENSUS ESTIMATES (2016) Market Cap. $4.57B L-T Debt/Equity (mrq) 0.32% EPS $3.31 Total Assets (mrq) $4.06B Beta 0.93 Sales $7.933B Total Liabilities (mrq) $2.34B Dividend Yield (ttm) 1.08% Net Income $377.182M Sales (ttm) $7.19B Dividend (ttm) $0.55 Forward P/E 12.92 Net Income (ttm) $357M PEG Ratio 1.00 Long-term Growth 13.14% Gross Margin (ttm) 30.6% Price/Sales (ttm) 0.64 Target Price $46.74 EBIT Margin (ttm) 8.04% Price/Book (mrq) 2.66 Buy/Hold/Sell 14/14/01 Net Margin (ttm) 4.96% Fiscal Year End Jan-31 Disclosure: Aaron Martschenko and Andrew Johnson do not own any shares of DKSReturn on Equity (ttm) 20.7% Most Recent Quarter Oct-31
  • 2. Company Overview Dick’s Sporting Goods is a sporting goods retailer that began operations in 1948 in Binghamton, NY and is now headquartered in Coraopolis, PA. As a sporting goods store, DKS offers a wide variety of products. They separate their product segments into hardlines, apparel, footwear, and other. While they maintain a higher-quality of sporting goods products, Dick’s accommodates the consumer’s style from a beginner to an enthusiast athlete. Hardlines refers to items such as sporting goods equipment, fitness equipment, golf equipment and outdoors gear. The category other, refers to Dick’s non-merchandising sales category, which includes in-store services provided and revenue from shipping. The following chart expresses the approximate percentage of sales in regards to the four categories for fiscal year 2014: Dick’s also owns and operates three specialty stores; Field & Stream, Golf Galaxy, and True Runner. Dick’s prides itself on presenting and selling higher-performance items geared more directly towards the serious athlete. As of August 2015, Dick’s operates over 600 stores in 46 states, 75 Golf Galaxy stores in 29 states, 12 Field & Stream stores in seven states, and three True Runner stores in three states. A majority of these stores are located from the Mideast to the East coast of the United States, but Dick’s is making strides to open more stores on the West coast, offering a wider range of operations. In terms of the management of DKS, the company has been held in family hands since Edward Stack, son of Dick’s founder, became the CEO and Chairman of the Board of Directors in 1984. The Board of Directors is comprised of Stack, William Colombo, and seven members outside the company. Industry Outlook The Sporting Goods Stores industry in the United States can be characterized by high internal and external competition, a mature life cycle stage, and reliance on the business cycle and consumer preferences. Overall, industry growth is fairly flat. This is due to the high amount of competition and lack of differentiation across competing companies. Within the industry, sporting goods stores face significant competition from each other
  • 3. because major suppliers such as Nike and Adidas supply products to nearly every company. In order to stay competitive, these major brands must be carried at all stores. Therefore, the amount of differentiation in products offered between stores is minimal. Competition is furthered by the threat of external competitors. External competitors include mass merchandisers such as Walmart and Target, and major suppliers to the sporting goods store industry. Mass merchandisers add to the competition for sporting goods sales because they typically carry a range of lower to medium priced goods that tend to be lesser quality than some of the brands typically offered at sporting goods stores. This is a threat to lower priced goods sold in the industry. Major suppliers contribute to the competition for sporting goods sales because they carry the same high quality products that are stocked at sporting goods stores, albeit a narrower selection of brands. The more direct- to-consumer avenues that major suppliers develop, the greater risk to the sales of participants in the sporting goods store industry. These avenues can include an increasing number of outlet stores and a growing online retail presence. In fact, both mass merchandisers and major suppliers carry the threat to the sporting goods store industry of developing better online retail sites. Despite all of the competition those in the industry are exposed to and the industry’s mature life cycle stage, there are still attractive investment opportunities. To combat external competition, sporting goods stores need to grow their online retailing abilities and increase the amount of high quality products they offer. A way this can be done is by securing key relationships with suppliers to provide private-label brands and other less commonly found products that appeal to niche markets and provide unique value. We believe that what makes a customer prefer to shop in one store over another for their sporting goods is the amount and quality of selection they have available to them. It makes it much easier on the customer to walk into only one store and compare products like shoes and baseball bats of varying prices and brands, instead of having to shop at multiple locations to identify the best product. By offering a large selection of high quality and highly demanded products in comparison to other companies, sporting goods stores can offer a one-stop shop appeal that other competitors don’t have. This is crucial in minimizing the negative impact that direct internal competition, and also external competitors like mass merchandisers and major suppliers to the industry will have. We believe that going forward, there is investment opportunity and growth in companies that can offer the broadest product portfolio of high quality goods for one-stop shop appeal, develop online retail, and expand their geographical footprint to draw a larger consumer base and build brand reputation. Company Outlook To stay competitive in the industry, sporting goods stores have to develop a business model that adapts to new consumer shopping preferences and keeps customers from purchasing their sporting goods from other distribution channels. We believe Dick’s has responded to the threat of competition better than their competitors and have set themselves up for future success. As major manufacturers such as Nike and Adidas increase their direct-to-consumer distribution channels with both online and brick-and-mortar stores, it is imperative for sporting goods stores to do the same if they hope to keep their customer base. In the general retail environment, we believe that e-commerce will play a role of increasing importance because it provides customers with the value of having immediate information. Customers are able to quickly shop around for the best price online and then order the product right now, or go to a physical store location to test out the product before they purchase it. We see three ways that companies can adjust to the impact of changing consumer behavior
  • 4. and believe Dick’s Sporting Goods has made adjustments superior to those of their competitors in their industry. Those three things are to further develop one-stop shop appeal and grow their brand, adapt product mix to consumer preferences, and grow their e-commerce segment. We believe Dick’s Sporting Goods has developed their one-stop shop appeal much better than competitors in the industry. We view this factor as one of the most important aspects that contributes to long-term success. Although e- commerce growth is a key factor in long-term success, we are convinced that what really attracts people to a sporting goods store over a mass merchant or outlet store for Nike is the wide availability of high quality products. When a customer goes into a sporting goods store, having more options appeals to the value-conscious consumer and is important in retaining customer base. Dick’s has an advantage because they have secured key relationships with suppliers that others don’t have and the average size of their stores is larger than competitors. Dick’s operates stores that are about 50,000 square feet on average while their closest competitor in Hibbett Sports only averages about 5,000 square feet. They have expanded each year in store count by adding about 35-50 stores each year. Other companies in the industry have not been able to exhibit this kind of expansion and we believe this increases Dick’s brand power relative to other sporting goods stores. In addition to the appeal of their stores, they have made changes in their sales mix, which we see as a positive. Not only has Dick’s secured relationships with major companies like Nike and Under Armour to offer a store-within-a- store format, they have also shifted their product mix to being more heavily weighted in apparel and footwear. This capitalizes on the current athleisure trend in the industry. They have secured a partnership with the United States Olympic Committee, Skechers, Polo Sport, and Nike Air Jordan. We believe incorporating these products into their sales mix adds more variety to the products and services they offer and with each of these partnerships providing high quality and higher margin goods, it will improve the appeal of their store over those of competitors. In addition, growth in e-commerce is something we believe will be a major factor going forward in the ways consumers shop for goods. Because consumers have so much data available to them, they can shop around quickly for the best price. Having an established brand and e-commerce platform brings customer attention to the company and even if the customer doesn’t purchase the goods directly from the website, they may want to go to the store to test out the product before ordering it. Thus, e-commerce growth is important in keeping strong sales at physical locations too, not just online. We view growth in e-commerce sales as a major factor in keeping customers from shopping online at a Nike website or other competitor. Overall, we believe Dick’s Sporting Goods has made more aggressive efforts to expand their presence in the industry and compete with external competition. With their growth strategy, attractive store layout and shifts in product mix, we believe they have improved the defensibility of their competitive position. Despite these strengths, given their recent weak performance in the third quarter and management’s expressed interest to create a “more promotional environment,” we do believe the short-term outlook is not as strong as over the long-term. Promotional and advertisings costs are one of the major factors for drops in profit margins for the past year and this could lead to weaker performance to round out the year. We expect promotional costs will be higher because Dick’s will want to get rid of the piled up inventory, and will hope to increase traffic in their stores as same store sales growth was weaker than expected in the third quarter. Thus, we believe they may struggle in the near-term and that the risk is too high to be overly optimistic on their long-term outlook.
  • 5. Financial Analysis Historically, return on equity for Dick’s Sporting Goods has been higher than the industry average but slightly lower than their most similar competitor, Hibbett Sports. Growth in return on equity is due to improvement in profit margins and more efficient use of assets. The use of debt has been limited and has had minimal positive or negative impact on ROE in past years. Table 1 – Return on Equity Components for Dick’s Sporting Goods, Inc. 2010 2011 2012 2013 2014 TTM Hibbett Sports Industry Average Net profit margin 3.7% 4.9% 5.3% 5.4% 5.1% 5.0% 8.1% 6.8% Total asset turnover 1.9 times 1.7 times 2.0 times 2.0 times 2.0 times 1.8 times 2.0 times 1.3 times Equity multiplier 1.9 times 1.8 times 1.8 times 1.8 times 1.9 times 2.4 times 1.4 times 2.1 times Return on equity 13.4% 15.6% 19.5% 20.0% 18.8% 20.7% 23.4% 18.6% Source: Return on equity components are calculated from company financial statements Industry averages are calculated from Bloomberg data Each year, profit margins have had the most fluctuation and most impact on return on equity. After evaluation of companies within the industry, factors we believe have the largest impact on profitability are: competitive pressures that result in increased spending, and efficient production from existing stores. In the sporting goods store industry, there are high levels of both internal and external competition. To retain the appeal of a sporting goods store and defend against rising competition, those within the industry need to expand their presence by increasing the size and number of brick-and-mortar stores, and by furthering their online presence. Accomplishing this without hurting margins significantly is no easy task because it requires a substantial amount of spending. Due to the increased emphasis on brand presence and expansion, cash has declined (Appendix A-4), while additional costs have accumulated. Major costs incurred include occupancy costs of new and/or larger facilities, increased shipping costs associated with the growing importance of e-commerce development, and advertising costs to promote newly established stores. Companies such as Dick’s Sporting Goods have responded to increased competition by ramping up spending and expansion. The degree of spending and expansion has led to increased inventory levels for Dick’s over the past five years, as well as property, plant & equipment (Appendix A-3). Other companies within the industry have not exhibited the same amount of expansion efforts. The closest comparison is with Hibbett Sports, which has an ROE greater than that of Dick’s. They have expanded with approximately 15 stores each year and with their average store size being approximately 1/10 the size of a Dick’s store, their expenses associated with expansion are much less. As a result, Dick’s absolute revenue is much higher than Hibbett Sports and commands significantly more market share. However, Dick’s expense ratios are also higher, indicated by lower profit margins. They have incurred significant costs related to the increased salary expenses, increased shipping expenses, advertising costs for products and new stores, and occupancy costs over the past several years. Due to these higher expenses, their gains in profit margins from increased sales have been limited and we believe it’s the
  • 6. main reason for not being up to par with the margins of Hibbett Sports. In the most recent fiscal year, Dick’s net profit margin had declined due to these additional expenses and offset any gains from their move to a higher margin product mix. Despite being below their closest competitor in net profit margins, we believe their expansion strategy will allow them to improve in the future. The more market share they gain, a smaller amount of money will have to be spent on some expenses that have hurt their profit margins in the past. For example, occupancy costs as a percentage of net sales dropped ten basis points in their most recent fiscal year, which is a trend we believe will continue based on results of same store sales in the industry. Table 2 – Annual Same Store Sales Increase for DKS and Main Competitors 2010 2011 2012 2013 2014 DKS 7.4% 2.0% 4.3% 1.9% 2.4% HIBB 1.6% 2.8% 6.9% 3.9% (12.3%) CAB 0.1% 9.8% 6.8% 6.9% 1.8% Source: Data obtained from company financial statements Shown in Table 2, Dick’s same store sales growth has been more than those of their closest publicly traded competitors in the most recent fiscal year, indicating improvements in efficiency of existing stores. Cabela’s had suffered because of a decline for demand in hunting and fishing equipment, which makes up most of their sales. We believe Hibbett Sports suffered because of their lack of ability to defend against rising competition. Hibbett Sports performs well in smaller markets away from large competitors where they rely on their customer service to attract customers despite a smaller product selection than companies such like Dick’s. We believe there are two major factors hurting their same store sales. The first is the lack of development in their e-commerce platform that leaves them vulnerable to competition from companies like Nike, Adidas, and Under Armour with strong internet presence. Secondly, the increasing presence of Dick’s Sporting Goods across the United States competes with their stores in smaller markets, possibly stealing away sales because we believe Dick’s offers a much larger selection of and more high profile products that consumers prefer in a sporting goods store. In regards to same store sales growth, we believe it can be improved through proper asset management. Dick’s total asset turnover ratio of 2.0 (Table 1), is above industry average and right in-line with 2.0 for Hibbett Sports. Although their fixed asset turnover ratio is lower than the industry (Appendix A-6), because of the risk of new stores not immediately performing well in new markets, their higher inventory turnover allows them to get more production out of each asset. Product mix is of critical importance in determining total asset turnover. We believe Dick’s product mix is better because of their shift to a higher proportion of higher margin athletic apparel and footwear in their stores and supplier relationships that allow them to carry products that other stores in the industry do not. The shift to a product mix with more apparel and footwear capitalizes on the current athleisure trend and appeals to what the consumer wants now, aiding inventory turnover and overall asset management. Historically, strong asset management has been a stable area of performance for Dick’s Sporting Goods and has allowed them to have a return on equity exceeding that of the industry average despite having lower profit margins.
  • 7. Aside from the impacts of decisions impacting profitability and efficient use of assets in the industry, the use of financial leverage is another factor impacting return on equity. However, it has played less of a role in upward or downward moves in Dick’s return on equity. This is mainly due to their emphasis on not using much debt in financing their expansion. After fiscal 2011, the use of debt financing played even less of a role. We believe this has allowed them to still be in decent financial position even with a low level of liquidity. Going forward we expect debt will be used in emergency situations such as in this most recent quarter in FY 2015, with the impact displayed in their TTM ROE (Table 2). Management’s assertions to have zero outstanding debt under their revolving credit facility demonstrates their efforts to have very limited use of debt, and we believe it is indicative of how they will handle future borrowings (Appendix B-4). Based on Dick’s corporate strategy, we believe their financial condition is sound. Dick’s Sporting Goods has typically been able to generate a free cash flow per share greater than industry average (Appendix A-6) due to their efforts to improve profitability and obtain more production out of each asset. To improve profitability, they have improved the defensibility of their competitive position by further expanding into new markets and strengthening their internet presence, and they have shifted their product mix to a higher proportion of high margin athletic apparel and footwear. By improving their brand presence and better accommodating product mix to consumer preferences, they have been able to improve efficiency of each asset and their existing stores, with limited exceptions such as their most recent quarter. This has allowed them to expand with little use of debt. In addition, Dick’s has approached its brand presence expansion through the usage of their cash balances as sources of funding. Between FY 2011 and FY 2013, cash & cash equivalents decreased 11.2% in relation to revenue (Appendix A-5). Despite having low liquidity due to the heavy use of cash balances used to grow the company, we believe that they will continue to generate free cash flow per share above the industry average because of how well they have implemented their corporate strategy focused on long-term growth. There is still the risk that newly established stores and/or existing stores may perform worse than expected due to a variety of factors leading DKS to not generate their usual level of free cash flow per share. However, because we are confident in their ability to generate more than enough cash to pay down their low levels of debt, we believe Dick’s is in great financial condition. Stock Valuation We are using a justified P/E ratio of 14.0 times in our valuation, which is higher than Dick’s TTM P/E of 12.78. We believe this is a conservative multiple based on what investors are willing to pay for comparable companies (Appendix B-7). Our view is that Dick’s stock is trading much cheaper now because of the recent influx of negative news surrounding many US retailers, management’s EPS guidance cut for the current fiscal year, and negative performance in the third quarter consistent with that of overall retail companies. Because we believe Dick’s growth strategy will have its most beneficial impacts in the future due to how they have improved the defensibility of their competitive position and investors have proven to pay a historical average of 21.45 times earnings, we have raised our justified P/E higher than that of their TTM P/E. We have applied our justified P/E ratio to our expected 2016 diluted EPS of $3.29 (Appendix B-2). Our earnings per share outlook sharply declined after Dick’s reported earnings in the third quarter. The main drivers behind this were management’s drastic guidance cut and our belief that to get rid of excess inventory, Dick’s would have to ramp up
  • 8. promotional activity and sales, which would put pressure on margins (Appendix B-3). This puts our forecasted one year EPS growth rate at 10.03%, which is significantly lower than their 4-year EPS growth rate of 26.03%. However, as Dick’s growth in EPS has slowed in recent years, we believe it is more representative of the current picture (Appendix B-6). We believe our estimate of $3.29 is correct and is a fairly conservative estimate as it is just under consensus EPS of $3.31 and slightly higher than the average of other analyst’s revisions after the most recent quarter (Appendix B-5). In regards to our EV/EBITDA multiple, we have used 8.0 times, which is right around both Dick’s and Hibbett’s TTM EV/EBITDA. Although we see a possibility in Dick’s performing better in the future, we applied a more conservative multiple to display the risk of a weakened consumer and challenges in developing new stores in that environment. Our estimate captures the recent performance from DKS and their closest competitor, and it is lower than both of their three year averages (Appendix B-8), which was a period of increased performance for those in the sporting goods store industry. We believe that multiples closer to those of the most recent year are more indicative of spending behaviors than a historical three year view. Using a multiple of 8.0 times and our expected 2016 EBITDA of $851,461, we arrived at a target price of $58.82. To arrive at our target price per share of $49.27, we used weighted average of P/E and EV/EBITDA valuation metrics. We believe our P/E ratio gives a better estimate of how investors will value a sporting goods retailer like Dick’s than valuation using our EV/EBITDA multiple. Valuation using our EV/EBITDA multiple gives us a target price outside of the highest of other analyst target prices (Appendix B-9). Thus, we decided to weight our P/E multiple at 75% and valuation using EV/EBITDA at 25%, arriving at a target price of $49.27 (refer to Appendix B-1 for further valuation discussion and Appendix B-10 for detailed valuation). Investment Risks Risks related to performance include consumer spending behavior, seasonal impacts, effects of Dick’s gross profit margin, and impact of increased competition. Being involved in retail, Dick’s is inherently vulnerable to changes in consumer spending habits. This could impact Dick’s because as they have shifted their product mix to high margin apparel and footwear. The shift in product mix was largely seen as a positive because it goes along with the athleisure trend in the industry. However, these products tend to be more expensive and their sales could be negatively impacted if consumers are less willing to spend on discretionary items. This could have a large impact on Dick’s performance because as they have expanded aggressively to defend against competition and grow their brand, they have also included significant costs. If customers are not as willing to spend and their new stores that are incurring expenses do not generate the revenue as expected, their profits could take a hit. In regards to how many retail companies have performed this most recent quarter, the impacts of unexpected seasonal adjustments are clear. In the third quarter, many retail companies have reported weaker than expected earnings. Many of them cite the reason for this as sluggish sales and the build-up of inventory due to surprising warm weather that impacts more seasonal products. In Dick’s most recent quarter, they had similar problems because of warmer weather that offset any gains they had in athletic apparel and footwear. It goes to show how prone retail companies are to weather conditions for a large assortment of products. Selling more apparel in sporting goods stores could leave them more vulnerable in the future to weather trends and they could have a repeat performance of this most recent quarter. Products
  • 9. dependent on weather conditions in a Dick’s Sporting Goods store include their hunting equipment and various types of clothing. Gross profit has decreased to 30.6% after reaching their peak in 2012 at 31.5%. The decline can be attributed to expenses related to expansion (Appendix A-1). Main reasons for a decline are higher inventory costs, higher promotional costs as a percentage of sales, and higher shipping costs. With the recent decline in the gross profit margin, this has a direct impact on diluted earnings per share. However, due to the five year, $1,000,000,000 share repurchase program announced in March 2013, the growth rate in diluted EPS has declined at a lesser rate compared to that of the growth rate in net income (Appendix A-2) as a percentage of sales. Moving forward, store expansion and the variability of associated costs incorporates risk factors relating to Dick’s overall performance. Lastly, Dick’s Sporting Goods performance could be influenced by the impact of increased competition. Both Nike and Under Armour are two major companies that have expressed desires to increase their direct-to-consumer segments, both with online and physical store locations. This could have an adverse impact on sales because even though Under Armour and Nike don’t have as wide of a variety, both offer many of the same high quality products and carry higher brand power. The impact of these risks can be substantial, each with the ability to put downward pressure on margins, as can be seen in the most recent quarter. Management’s guidance was cut severely for FY 2015. We believe they anticipate lower profit margins because of the need to get rid of inventory using more promotional selling measures. Colder weather apparel and hunting products are often higher margin and higher priced goods. In the absence of typical these key sales in the later parts of the year, gross profit could suffer. Our forecasts for revenue growth rate and gross profit margins are 8.0% and 30.7% respectively, with a projected diluted EPS of $3.29 for FY 2016. Shown in Table 3, even a small decline in gross profit margins would have a large impact on earnings per share for DKS. Table 3: Impact of Investment Risks on Diluted EPS Source: Analyst’s Calculations Recommendation Dick’s Sporting Goods is a HOLD at the current share price of $38.98. Their improvements in e-commerce, aggressive expansion strategy, relationships with suppliers, and shift to a more favorable product mix based on industry trends give them the tools to improve their competitive position. This could potentially make them an attractive buy later on. However, because they are so dependent on consumer spending and are prone to adverse impacts from competition in
  • 10. companies that have much larger brand power, we only foresee Dick’s moderately besting the market, and with high risk to that assertion. In the short-term, we expect they will struggle. Management had cut EPS guidance for FY 2015 to a range of $2.85 - $3.00 from a range of $3.13 to $3.21. They had also indicated that they would have a more promotional environment in the fourth quarter of this year. We believe this is because their same store sales in the quarter were not as high as expected and need more marketing efforts to drive up their sales. Promotional costs in the past have proven to be one of the driving forces in putting pressure on their margins. Even though we expect some margin improvement because of a better sales mix, higher promotional activity will likely limit these gains once again. We believe Dick’s is a great company with the possibility of upside because of their attractive store layout and product mix. However, we do not believe the stock is a buy right now because of the risks involved while they are trying to expand aggressively.
  • 11. References 1. Bloomberg Finance L.P 2. Athletic Apparel: Outperforming the Competition in 2014. Retrieved from http://fortune.com/2014/12/25/athletic- apparel-top-performer/. Author: Kell, John. 3. Sporting Goods Logistics: Keeping the Ball Rolling. Retrieved from http://www.inboundlogistics.com/cms/article/sporting-goods-logistics-keeping-the-ball-rolling/. Author: Brown, Justine. 4. Product Life Cycle Stages. Retrieved from http://productlifecyclestages.com/product-life-cycle-stages/maturity/ 5. 7 Charts that Show the State of Youth Sports in the US and Why it Matters. Retrieved from http://www.aspeninstitute.org/about/blog/7-charts-that-show-the-state-of-youth-sports-in-the-us-and-why-it- matters. Author: Lee, Alice. 6. IBISWorld Industry Report 45111 – Sporting goods Stores in the US. IBISworld.com. Retrieved from http://0- clients1.ibisworld.com/wncln.wncln.org/reports/us/industry/default.aspx?entid=1079. 7. Sporting Goods Industry FAQ. Retrieved from https://www.nsga.org/globalassets/research/public/sporting-goods- industry-faq---2015.pdf. 8. Edited Transcript of DKS Earnings Conference Call. Retrieved from http://finance.yahoo.comnews/edited- transcript-dks-earnings-conference-012935404.html. 9. Investor Relations – Dick’s Sporting Goods. Retrieved from http://investors.dicks.com/company- information/company-overview.aspx. 10. Why Nike Air Jordan, Polo Sport stores-within-a-store coming to Dick’s Sporting Goods Near You. Retrieved from http://www.bizjournals.com/pittsburgh/news/2015/08/18/why-ralph-laurennike-air-jordan-polo-sport- stores.html. Author: Schooley, Tim. 11. Dick’s Sporting Goods, Inc. Form 10-K. U.S Securities and Exchange Commission. Retrieved from http://www.sec.gov/cgi-bin/browse-edgar?CIK=DKS&Find=Search&owner=exclude&action=getcompany  2010  2011  2012  2013  2014 12. Dick’s Sporting Goods, Inc. Form 10-Q. U.S Securities and Exchange Commission. Retrieved from http://www.sec.gov/cgi-bin-browse/edgar?CIK=DKS&Find=Search&ownder=exclude&action=getcompany  10-Q: Filed 08/28/2014  10-Q: Filed 11/26/2014  10-Q: Filed 05/28/2015  10-Q: Filed 08/27/2015
  • 12. References (cont.) 13. Dick’s Sporting Goods, Inc. Form 8-K. US Securities and Exchange Commission. Retrieved from http://www.sec.gov/Archives/edgar/data/1089063/000108906315000084/0001089063-15-000084-index.htm
  • 13. Appendix A-1: Income Statement Source: Company Filings & Analyst’s Estimates INCOMESTATEMENT Fiscal year 2010A 2011A* 2012A* 2013A 2014A TTM 2015P 2016P Fiscal year end date 1/29/2011 1/28/2012 2/2/2013 2/1/2014 1/31/2015 10/31/2015 1/31/2016 1/31/2017 Net sales 4,871,492 5,211,802 5,836,119 6,213,173 6,814,479 7,190,920 7,393,710 7,985,206 Cost of good sold, inc. occupancy and distribution costs (3,422,462) (3,616,921) (3,998,956) (4,269,223) (4,727,813) (4,988,743) (5,131,235) (5,533,748) Gross profit 1,449,030 1,594,881 1,837,163 1,943,950 2,086,666 2,202,177 2,262,475 2,451,458 Selling, general and administrative expenses (1,129,293) (1,148,268) (1,297,413) (1,386,315) (1,502,089) (1,590,424) (1,663,585) (1,812,642) Pre-opening expenses (10,488) (14,593) (16,076) (20,823) (30,518) (33,874) (36,969) (39,926) EBIT/income from operations 309,249 432,020 523,674 536,812 554,059 577,879 561,922 598,890 Interest expense (14,016) (13,868) (6,034) (2,929) (3,215) (3,535) (627) (542) Interest income 0 0 0 0 0 0 0 0 Other income 2,278 (26) 4,555 12,224 5,170 1,119 5,170 5,170 EBT/income before income taxes 297,511 418,126 522,195 546,107 556,014 575,463 566,465 603,519 Provision for income taxes (115,434) (162,651) (212,533) (208,509) (211,816) (218,528) (215,111) (229,182) Net income 182,077 255,475 309,662 337,598 344,198 356,935 351,354 374,337 Basic shares outstanding 116,236 120,232 121,629 122,878 119,244 116,101 116,045 112,068 Impact of dilutive securities 5,488 5,536 4,366 2,750 1,994 1,638 1,638 1,638 Diluted shares outstanding 121,724 125,768 125,995 125,628 121,238 117,739 117,683 113,706 Basic EPS $1.57 $2.12 $2.55 $2.75 $2.89 $3.07 $3.03 $3.34 DilutedEPS $1.50 $2.03 $2.46 $2.69 $2.84 $3.03 $2.99 $3.29
  • 14. Appendix A-2: Common-Size Income Statement Source: Company Filings & Analyst’s Estimates COMMON-SIZEINCOMESTATEMENT Fiscal year 2010A 2011A* 2012A* 2013A 2014A TTM 2015P 2016P Fiscal year end date 1/29/2011 1/28/2012 2/2/2013 2/1/2014 1/31/2015 10/31/2015 1/31/2016 1/31/2017 Net Sales 100.0% 100.0% 100.0% 100.0% 100.0% 100.0% 100.0% 100.0% Cost of good sold, inc. occupancy and distribution costs 70.3% 69.4% 68.5% 68.7% 69.4% 69.4% 69.4% 69.3% Gross profit 29.7% 30.6% 31.5% 31.3% 30.6% 30.6% 30.6% 30.7% Selling, general and administrative expenses 23.2% 22.0% 22.2% 22.3% 22.0% 22.1% 22.5% 22.7% Pre-opening expenses 0.2% 0.3% 0.3% 0.3% 0.4% 0.5% 0.5% 0.5% EBIT/income from operations 6.3% 8.3% 9.0% 8.6% 8.1% 8.0% 7.6% 7.5% Interest expense 0.3% 0.3% 0.1% 0.0% 0.0% 0.0% 0.0% 0.0% Interest income 0.0% 0.0% 0.0% 0.0% 0.0% 0.0% 0.0% 0.0% Other income 0.0% 0.0% 0.1% 0.2% 0.1% 0.0% 0.1% 0.1% EBT/income before income taxes 6.1% 8.0% 8.9% 8.8% 8.2% 8.0% 7.7% 7.6% Provision for income taxes 2.4% 3.1% 3.6% 3.4% 3.1% 3.0% 2.9% 2.9% Net income 3.7% 4.9% 5.3% 5.4% 5.1% 5.0% 4.8% 4.7%
  • 15. Appendix A-3: Balance Sheet Source: Company Filings & Analyst’s Estimates BALANCESHEET Fiscal year 2010A 2011A* 2012A* 2013A 2014A MRQ 2015P 2016P Fiscal year end date 1/29/2011 1/28/2012 2/2/2013 2/1/2014 1/31/2015 10/31/2015 1/31/2016 1/31/2017 Assets Current assets: Cash and cash equivalents 546,052 734,402 345,214 181,731 221,679 73,799 165,397 199,808 Accounts receivable, net 34,978 38,338 34,625 60,779 80,292 96,406 96,118 111,793 Income taxes receivable 9,050 4,113 15,737 7,275 14,293 8,719 14,293 14,293 Inventories, net 896,895 1,014,997 1,096,186 1,232,065 1,390,767 1,997,105 1,693,307 1,770,799 Prepaid expenses and other current assets 58,394 64,213 73,838 99,386 91,767 107,755 91,767 91,767 Deferred income taxes 18,961 12,330 30,289 38,835 51,586 47,789 51,586 51,586 Total current assets 1,564,330 1,868,393 1,595,889 1,620,071 1,850,384 2,331,573 2,112,468 2,240,047 Property and equipment, net 684,886 775,896 840,135 1,084,529 1,203,382 1,341,166 1,384,084 1,579,243 Construction in progress --- leased facilities 0 2,138 0 0 0 0 0 0 Intangible assets, net (inc. Goodwill) 251,664 251,084 299,497 298,849 310,756 310,421 309,203 307,705 Deferred income taxes 27,157 12,566 4,382 2,477 1,862 1,355 1,862 1,862 Other assets 69,499 86,375 147,904 65,561 69,814 73,912 69,814 69,814 Total assets 2,597,536 2,996,452 2,887,807 3,071,487 3,436,198 4,058,427 3,877,432 4,198,670 Liabilities andStockholder's Equity Current liabilities: Accounts payable 446,511 510,398 507,247 562,439 614,511 941,973 872,310 913,068 Accrued expenses 279,284 264,073 269,900 265,040 283,828 345,052 354,898 375,305 Deferred revenue and other liabilities 121,753 128,765 146,362 154,384 172,259 133,593 184,843 199,630 Income taxes payable 0 29,484 68,746 19,825 47,698 0 47,698 47,698 Current portion of other long-termdebt and leasing obligations 995 7,426 8,513 899 537 575 800 950 Total current liabilities 848,543 940,146 1,000,768 1,002,587 1,118,833 1,421,193 1,460,549 1,536,651 Long-termliabilities: Revolver 0 0 0 0 0 342,400 0 0 Long-termdebt and leasing obligations 139,846 151,596 7,762 6,476 5,913 5,477 5,113 4,163 Non-cash obligations for construction in progress --- leased facilities 0 2,138 0 0 0 0 0 0 Deferred income taxes 0 0 7,413 38,617 44,494 29,078 44,494 44,494 Deferred revenue and other liabilities 245,566 269,827 284,540 331,628 434,733 536,973 517,560 574,935 Total long-termliabilities 385,412 423,561 299,715 376,721 485,140 913,928 567,167 623,592 Total liabilities 1,233,955 1,363,707 1,300,483 1,379,308 1,603,973 2,335,121 2,027,715 2,160,243 Stockholder's equity: Common stock / additional paid-in capital 626,122 700,730 875,217 959,904 1,016,336 1,054,631 1,045,009 1,076,009 Class B common stock 250 250 249 249 249 249 249 249 Retained earnings 730,468 932,871 911,704 1,187,514 1,471,182 1,623,962 1,760,000 2,067,711 Other comprehensive income / (loss) 6,741 118 112 24 (73) (125) (73) (73) Treasury stock 0 (1,224) (199,958) (455,512) (655,469) (955,411) (955,469) (1,105,469) Total stockholder's equity 1,363,581 1,632,745 1,587,324 1,692,179 1,832,225 1,723,306 1,849,716 2,038,427 Total liabilities andstockholder's equity 2,597,536 2,996,452 2,887,807 3,071,487 3,436,198 4,058,427 3,877,432 4,198,670
  • 16. Appendix A-4: Common-Size Balance Sheet Source: Company Filings & Analyst’s Estimates COMMON-SIZEBALANCESHEET Fiscal year 2010A 2011A* 2012A* 2013A 2014A MRQ 2015P 2016P Fiscal year end date 1/29/2011 1/28/2012 2/2/2013 2/1/2014 1/31/2015 10/31/2015 1/31/2016 1/31/2017 Assets Current assets: Cash and cash equivalents 21.0% 24.5% 12.0% 5.9% 6.5% 1.8% 4.3% 4.8% Accounts receivable, net 1.3% 1.3% 1.2% 2.0% 2.3% 2.4% 2.5% 2.7% Income taxes receivable 0.3% 0.1% 0.5% 0.2% 0.4% 0.2% 0.4% 0.3% Inventories, net 34.5% 33.9% 38.0% 40.1% 40.5% 49.2% 43.7% 42.2% Prepaid expenses and other current assets 2.2% 2.1% 2.6% 3.2% 2.7% 2.7% 2.4% 2.2% Deferred income taxes 0.7% 0.4% 1.0% 1.3% 1.5% 1.2% 1.3% 1.2% Total current assets 60.2% 62.4% 55.3% 52.7% 53.8% 57.5% 54.5% 53.4% Property and equipment, net 26.4% 25.9% 29.1% 35.3% 35.0% 33.0% 35.7% 37.6% Construction in progress --- leased facilities 0.0% 0.1% 0.0% 0.0% 0.0% 0.0% 0.0% 0.0% Intangible assets, net (inc. Goodwill) 9.7% 8.4% 10.4% 9.7% 9.0% 7.6% 8.0% 7.3% Deferred income taxes 1.0% 0.4% 0.2% 0.1% 0.1% 0.0% 0.0% 0.0% Other assets 2.7% 2.9% 5.1% 2.1% 2.0% 1.8% 1.8% 1.7% Total assets 100.0% 100.0% 100.0% 100.0% 100.0% 100.0% 100.0% 100.0% Liabilities andStockholder's Equity Current liabilities: Accounts payable 17.2% 17.0% 17.6% 18.3% 17.9% 23.2% 22.5% 21.7% Accrued expenses 10.8% 8.8% 9.3% 8.6% 8.3% 8.5% 9.2% 8.9% Deferred revenue and other liabilities 4.7% 4.3% 5.1% 5.0% 5.0% 3.3% 4.8% 4.8% Income taxes payable 0.0% 1.0% 2.4% 0.6% 1.4% 0.0% 1.2% 1.1% Current portion of other long-termdebt and leasing obligations 0.0% 0.2% 0.3% 0.0% 0.0% 0.0% 0.0% 0.0% Total current liabilities 32.7% 31.4% 34.7% 32.6% 32.6% 35.0% 37.7% 36.6% Long-termliabilities: Revolver 0.0% 0.0% 0.0% 0.0% 0.0% 8.4% 0.0% 0.0% Long-termdebt and leasing obligations 5.4% 5.1% 0.3% 0.2% 0.2% 0.1% 0.1% 0.1% Non-cash obligations for construction in progress --- leased facilities 0.0% 0.1% 0.0% 0.0% 0.0% 0.0% 0.0% 0.0% Deferred income taxes 0.0% 0.0% 0.3% 1.3% 1.3% 0.7% 1.1% 1.1% Deferred revenue and other liabilities 9.5% 9.0% 9.9% 10.8% 12.7% 13.2% 13.3% 13.7% Total long-termliabilities 14.8% 14.1% 10.4% 12.3% 14.1% 22.5% 14.6% 14.9% Total liabilities 47.5% 45.5% 45.0% 44.9% 46.7% 57.5% 52.3% 51.5% Stockholder's equity: Common stock / additional paid-in capital 24.1% 23.4% 30.3% 31.3% 29.6% 26.0% 27.0% 25.6% Class B common stock 0.0% 0.0% 0.0% 0.0% 0.0% 0.0% 0.0% 0.0% Retained earnings 28.1% 31.1% 31.6% 38.7% 42.8% 40.0% 45.4% 49.2% Other comprehensive income / (loss) 0.3% 0.0% 0.0% 0.0% 0.0% 0.0% 0.0% 0.0% Treasury stock 0.0% 0.0% -6.9% -14.8% -19.1% -23.5% -24.6% -26.3% Total stockholder's equity 52.5% 54.5% 55.0% 55.1% 53.3% 42.5% 47.7% 48.5% Total liabilities andstockholder's equity 100.0% 100.0% 100.0% 100.0% 100.0% 100.0% 100.0% 100.0%
  • 17. Appendix A-5: Balance Sheet as a Percentage of Revenue Source: Company Filings & Analyst’s Estimates BALANCESHEET AS % OF REVENUE Fiscal year 2010A 2011A* 2012A* 2013A 2014A MRQ 2015P 2016P Fiscal year end date 1/29/2011 1/28/2012 2/2/2013 2/1/2014 1/31/2015 10/31/2015 1/31/2016 1/31/2017 Assets Current assets: Cash and cash equivalents 11.2% 14.1% 5.9% 2.9% 3.3% 1.0% 2.2% 2.5% Accounts receivable, net 0.7% 0.7% 0.6% 1.0% 1.2% 1.3% 1.3% 1.4% Income taxes receivable 0.2% 0.1% 0.3% 0.1% 0.2% 0.1% 0.2% 0.2% Inventories, net 18.4% 19.5% 18.8% 19.8% 20.4% 27.8% 22.9% 22.2% Prepaid expenses and other current assets 1.2% 1.2% 1.3% 1.6% 1.3% 1.5% 1.2% 1.1% Deferred income taxes 0.4% 0.2% 0.5% 0.6% 0.8% 0.7% 0.7% 0.6% Total current assets 32.1% 35.8% 27.3% 26.1% 27.2% 32.4% 28.6% 28.1% Property and equipment, net 14.1% 14.9% 14.4% 17.5% 17.7% 18.7% 18.7% 19.8% Construction in progress --- leased facilities 0.0% 0.0% 0.0% 0.0% 0.0% 0.0% 0.0% 0.0% Intangible assets, net (inc. Goodwill) 5.2% 4.8% 5.1% 4.8% 4.6% 4.3% 4.2% 3.9% Deferred income taxes 0.6% 0.2% 0.1% 0.0% 0.0% 0.0% 0.0% 0.0% Other assets 1.4% 1.7% 2.5% 1.1% 1.0% 1.0% 0.9% 0.9% Total assets 53.3% 57.5% 49.5% 49.4% 50.4% 56.4% 52.4% 52.6% Liabilities andStockholder's Equity Current liabilities: Accounts payable 9.2% 9.8% 8.7% 9.1% 9.0% 13.1% 11.8% 11.4% Accrued expenses 5.7% 5.1% 4.6% 4.3% 4.2% 4.8% 4.8% 4.7% Deferred revenue and other liabilities 2.5% 2.5% 2.5% 2.5% 2.5% 1.9% 2.5% 2.5% Income taxes payable 0.0% 0.6% 1.2% 0.3% 0.7% 0.0% 0.6% 0.6% Current portion of other long-termdebt and leasing obligations 0.0% 0.1% 0.1% 0.0% 0.0% 0.0% 0.0% 0.0% Total current liabilities 17.4% 18.0% 17.1% 16.1% 16.4% 19.8% 19.8% 19.2% Long-termliabilities: Revolver 0.0% 0.0% 0.0% 0.0% 0.0% 4.8% 0.0% 0.0% Long-termdebt and leasing obligations 2.9% 2.9% 0.1% 0.1% 0.1% 0.1% 0.1% 0.1% Non-cash obligations for construction in progress --- leased facilities 0.0% 0.0% 0.0% 0.0% 0.0% 0.0% 0.0% 0.0% Deferred income taxes 0.0% 0.0% 0.1% 0.6% 0.7% 0.4% 0.6% 0.6% Deferred revenue and other liabilities 5.0% 5.2% 4.9% 5.3% 6.4% 7.5% 7.0% 7.2% Total long-termliabilities 7.9% 8.1% 5.1% 6.1% 7.1% 12.7% 7.7% 7.8% Total liabilities 25.3% 26.2% 22.3% 22.2% 23.5% 32.5% 27.4% 27.1% Stockholder's equity: Common stock / additional paid-in capital 12.9% 13.4% 15.0% 15.4% 14.9% 14.7% 14.1% 13.5% Class B common stock 0.0% 0.0% 0.0% 0.0% 0.0% 0.0% 0.0% 0.0% Retained earnings 15.0% 17.9% 15.6% 19.1% 21.6% 22.6% 23.8% 25.9% Other comprehensive income / (loss) 0.1% 0.0% 0.0% 0.0% 0.0% 0.0% 0.0% 0.0% Treasury stock 0.0% 0.0% -3.4% -7.3% -9.6% -13.3% -12.9% -13.8% Total stockholder's equity 28.0% 31.3% 27.2% 27.2% 26.9% 24.0% 25.0% 25.5% Total liabilities andstockholder's equity 53.3% 57.5% 49.5% 49.4% 50.4% 56.4% 52.4% 52.6%
  • 18. Appendix A-6: Financial Ratios Source: Company Filings & Analyst’s Estimates RATIO ANALYSIS Fiscal year 2010A 2011A* 2012A* 2013A 2014A TTM 2015P 2016P Industry Avg. Fiscal year end date 1/29/2011 1/28/2012 2/2/2013 2/1/2014 1/31/2015 10/31/2015 1/31/2016 1/31/2017 Profitability Gross Profit Margin 29.7% 30.6% 31.5% 31.3% 30.6% 30.6% 30.6% 30.7% 39.7% EBIT Margin 6.3% 8.3% 9.0% 8.6% 8.1% 8.0% 7.6% 7.5% 11.1% EBITDA Margin 9.1% 11.0% 11.7% 11.6% 11.1% 10.9% 10.8% 10.7% 13.5% PretaxProfit Margin 6.1% 8.0% 8.9% 8.8% 8.2% 8.0% 7.7% 7.6% 10.8% Net Profit Margin 3.7% 4.9% 5.3% 5.4% 5.1% 5.0% 4.8% 4.7% 6.8% Return on Assets 7.0% 8.5% 10.7% 11.0% 10.0% 8.8% 9.1% 8.9% 9.9% Return on Equity 13.4% 15.6% 19.5% 20.0% 18.8% 20.7% 19.0% 18.4% 17.6% Return on Invested Capital 12.6% 14.7% 19.4% 19.5% 18.7% 17.3% 18.8% 18.2% 16.1% YOYGrowth in Revenue n/a 7.0% 12.0% 6.5% 9.7% n/a 8.5% 8.0% n/a YOYGrowth in Net Income n/a 40.3% 21.2% 9.0% 2.0% n/a 2.1% 6.5% n/a YOYGrowth in Diluted EPS n/a 35.8% 21.0% 9.3% 5.6% n/a 5.2% 10.3% n/a Asset Management Inventory Turnover 3.8 times 3.6 times 3.6 times 3.5 times 3.4 times 2.5 times 3.0 times 3.1 times 2.7 times Average Collection Period 3 days 3 days 2 days 4 days 4 days 5 days 5 days 5 days 213 days Fixed Asset Turnover 7.1 times 6.7 times 6.9 times 5.7 times 5.7 times 5.4 times 5.3 times 5.1 times 6.4 times Total Asset Turnover 1.9 times 1.7 times 2.0 times 2.0 times 2.0 times 1.8 times 1.9 times 1.9 times 1.3 times Leverage andLiquidity Times Interest Earned 22.1 times 31.2 times 86.8 times 183.3 times 172.3 times 163.5 times 896.5 times 1105.0 times 192.0 times Long-termDebt/Common Equity 10.3% 9.3% 0.5% 0.4% 0.3% 0.3% 0.3% 0.2% 14.0% Debt-to-Invested Capital 9.3% 8.5% 0.5% 0.4% 0.3% 0.3% 0.3% 0.2% 18.0% Total Debt Ratio 47.5% 45.5% 45.0% 44.9% 46.7% 57.5% 52.3% 51.5% 52.3% Equity Multiplier 1.9 times 1.8 times 1.8 times 1.8 times 1.9 times 2.4 times 2.1 times 2.1 times 2.1 times Current Ratio 1.8 times 2.0 times 1.6 times 1.6 times 1.7 times 1.6 times 1.4 times 1.5 times 3.5 times Quick Ratio 0.7 times 0.8 times 0.4 times 0.2 times 0.3 times 0.1 times 0.2 times 0.2 times 1.6 times Additional Ratios Free Cash Flow Per Share n/a (0.34) 4.36 1.47 0.50 2.48 2.14 1.14 0.28 Dividend Yield (%) 0.0% 1.2% 5.2% 1.0% 1.0% 1.1% 1.0% 0.9% 0.0% YOYGrowth in Dividends Per Share 0.0% 5000.0% 400.0% -80.0% 0.0% 10.0% 10.0% 0.0% 0.0% Weighted-Average Cost of Capital 12.6% 11.5% 10.6% 10.4% 7.9% BondRatings (list each bondissue andthe rating on the issue) n/a n/a n/a n/a n/a n/a n/a n/a n/a
  • 19. Appendix A-6: Financial Ratios (cont.) Source: Company Filings & Analyst’s Estimates DuPont Analysis Net profit margin 3.7% 4.9% 5.3% 5.4% 5.1% 5.0% 4.8% 4.7% 6.8% Total asset turnover 1.9 times 1.7 times 2.0 times 2.0 times 2.0 times 1.8 times 1.9 times 1.9 times 1.3 times Equity multiplier 1.9 times 1.8 times 1.8 times 1.8 times 1.9 times 2.4 times 2.1 times 2.1 times 2.1 times Return on equity 13.4% 15.6% 19.5% 20.0% 18.8% 20.7% 19.0% 18.4% 18.6% ExtendedDuPont Analysis EBIT Margin 6.3% 8.3% 9.0% 8.6% 8.1% 8.0% 7.6% 7.5% Total Asset Turnover 1.9 times 1.7 times 2.0 times 2.0 times 2.0 times 1.8 times 1.9 times 1.9 times Equity Multiplier 1.9 times 1.8 times 1.8 times 1.8 times 1.9 times 2.4 times 2.1 times 2.1 times Interest Burden 96.2% 96.8% 99.7% 101.7% 100.4% 99.6% 100.8% 100.8% TaxBurden 61.2% 61.1% 59.3% 61.8% 61.9% 62.0% 62.0% 62.0% Return on equity 13.4% 15.6% 19.5% 20.0% 18.8% 20.7% 19.0% 18.4% Free Cash Flow Net Income n/a 255,475 309,662 337,598 344,198 356,935 351,354 374,337 Plus: Depreciation & Amortization n/a 116,581 125,096 154,928 179,431 180,114 205,324 221,570 Less: Change in Working Capital n/a 212,460 (333,126) 22,363 114,067 89,988 (79,631) 51,476 Less: Capital Expenditures n/a 201,807 219,026 285,668 349,007 154,785 384,473 415,231 Free Cash Flow n/a (42,211) 548,858 184,495 60,555 292,276 251,836 129,201
  • 20. Appendix B-1: Multiples Justification Justified P/E Our P/E used for valuation purposes is 14.0 times. Dick’s TTM P/E is 12.78. We adjusted our P/E higher than that of the TTM for a number of reasons. First, we believe Dick’s stock is trading at a discount right now. In tandem with other retailers, Dick’s stock price has fallen considerably in the last month, further pushing their stock down, which was due to poor performance in the third quarter. Dick’s management had stated the main reason for this was an unexpected warmer climate that impacted cold weather apparel and hunting equipment sales. We believe that this is not an event that will occur with any sort of regularity. However, because it does expose Dick’s weakness to unexpected weather changes, we still believe that in the future, investors will not be willing to pay as much for DKS stock as they have in the past. Historically, their stock has been trading at 21.45 times. This accounts for years when Dick’s was growing at a much more rapid pace than they are and does not reflect their current situation. It also does not reflect what investors are willing to pay for comparable companies. Hibbett Sports’ TMM P/E is 11.48 and Cabela’s TTM P/E is 17.01, where Hibbett Sports is a closer comparison to DKS. Thus, because Dick’s is not growing as fast as they have been in the past and they are currently have some troubles along with the rest of the retail sector, we believe that investors will only be willing to pay a slight amount more for their stock in 14 months (14.0 vs. 12.78). EV/EBITDA The EV/EBITDA multiple we have used for valuation purposes is 8.0 times. In this case we decided to use a conservative estimate. Dick’s TTM EV/EVBITDA is 7.93 and Hibbett Sports’ TTM EV/EBITDA is 8.04. They are trading lower than both their three year and five year EV/EBITDA historical averages. We believe Dick’s EBIT margins have upside potential because we are convinced that their growth strategy has positioned themselves better than competitors in the future. However, there is a fair amount of risk in them being able to generate their expected profits from the new stores they have been opening. Thus, we applied a conservative estimate of 8.0 times to reflect the risk of Dick’s aggressive expansion potentially being impacted by increasing competition from companies with larger brand power and weaker consumer spending. Weighted-Average Target Price Our target price per share of $49.27 is a function of a weighted average of both valuation metrics. We weighted P/E valuation at 75% and EV/EBITDA valuation at 25%. We weighted P/E valuation much higher because we view its target price as being more realistic. With a consensus target price of $46.74 and the highest analyst target price being $55 (based on revised target prices after weak Q3), a target price of $58.82 reached with our EV/EBITDA valuation seemed much too high. P/E valuation returned a target price of $46.09, which we believe is much more reasonable. In addition, we expect that investors could be wary of investing in retail stocks given recent negative news and that our P/E valuation reflects this better than EV/EBITDA valuation.
  • 21. Appendix B-2: EPS Justification Diluted EPS Our forecasted diluted earnings per share for FY 2016 is $3.29. This is lower than consensus EPS, but is higher than average broker analyst’s estimates of EPS of $3.26 (after Nov 17). We chose to compare to both consensus EPS and broker analyst’s estimates of EPS after Nov 17 because Dick’s third quarter earnings came out the morning of Nov 17. Before earnings release, many analysts had projected EPS for FY 2016 between $3.50 and $3.60. Sharp downward revisions were made after the company downgraded its FY 2015 EPS guidance from a range of $3.13 - $3.21 to a range of $2.85 - $3.00. This made a substantial difference in our EPS estimates as well. In addition to management lowering EPS guidance for FY 2015, we believe a big driver for the lowering of many other analyst’s estimates was the anticipated pressure on profit margins. Management had stated that the fourth quarter would be a more promotional environment and in the past, promotional costs have put a damper on margins even in the presence of gains from shifting to a higher margin product mix. After earnings were released, we made adjustments to both gross and SG&A margins to reflect our takeaways from the earnings report, which made our forecasted EPS relatively close in-line with those of other analysts.
  • 22. Appendix B-3: Income Statement Assumptions Income Statement Assumptions 2015P 2016P Revenue Growth 8.5% 8.0% Gross Profit Margin 30.6% 30.7% SG&A Margin 22.5% 22.7% Pre-opening Expenses as a % of Sales 0.5% 0.5% Marginal Tax Rate 38.0% 38.0% Source: Analyst’s Calculations Revenue Growth: our forecasts shows strong revenue growth in FY 2015 and FY 2016, although at a decreasing rate. We believe revenue growth will remain strong because of how DKS has improved their brand power and online presence, giving them some protection from increased competition. However, competition is increasing and will likely have some impact, especially on new stores where Dick’s brand is less established. Thus, we have stated revenue at a declining rate. This is fairly in-line with consensus revenue estimates for FY 2016. Our model forecasts $7.985B in FY 2016 while consensus estimates are at $7.933B. Gross Profit Margin: forecasts for gross profit margins show only a marginal increase. After DKS third quarter earnings release, they had discussed a more promotional environment in the coming months to get rid of their inventory that had piled up because of unanticipated weather conditions. Although we still believe their shift in product mix to higher margin apparel and footwear is a good move, it does come with risks. In their most recent 10- K, they had cited promotional costs as being a big factor in offsetting gains from improvements in sales mix. We believe they will be more profitable over a longer horizon, but in 14 months, we expect the build-up of inventory and the promotional activity will put downward pressure on margins, especially because colder weather apparel tends to be higher margin goods and future weak consumer spending could result in more promotional activity. SG&A Margin: major expenses for Dick’s in this line item include advertising, marketing, and payroll costs. We forecasted an increase for selling, general, and administrative expenses as a percentage of sales because as they expand away from the southeast where their brand is strong, there is the risk that their stores won’t be as productive and more advertising efforts may need to be put into place to get more production out of them. Pre-opening Expenses as a % of Sales: this line item mainly includes marketing and payroll costs incurred before a store is opened. In accordance with their growth strategy, we forecasted increases in pre-opening expenses roughly similar to the increases they’ve had in the past, demonstrating steady growth in number of stores.
  • 23. Appendix B-3: Income Statement Assumptions (cont.) Marginal Tax Rate: we forecasted a tax rate of 38.0%. This is in-line with what they have paid in the trailing twelve months.
  • 24. Appendix B-4: Other Key Modeling Assumptions Treasury Stock: for our treasury stock schedule, we have forecasted $300M of stock repurchases in FY 2015 and $150M of stock repurchases in FY 2016. In March of 2013, Dick’s authorized a five year, one billion dollar share repurchase program. As of Q3 in FY 2015, Dick’s has spent $300M in stock repurchases. Because of their recent struggles, we do not foresee more buybacks in the period as $300M in one fiscal year already surpasses any of their previous amounts. The amount remaining in their five year repurchase program is $245M. In FY 2016, we forecasted that DKS would repurchase $150M in common stock as they’re share price is trading significantly lower than their high of approximately $60 in 2016. We believe they would repurchase a significant amount as they could buy back their stock at a relatively discounted price to reward shareholders, leaving approximately $100M left on their repurchase program. Revolver: in the most recent quarter, Dick’s had $342,400,000 in outstanding debt on their revolving credit facility. Our forecast shows them ending FY 2015 with a zero balance as stated by management. For the following year in FY 2016, we also forecast a zero balance for year end, staying consistent the company’s historical use of their revolver.
  • 25. Appendix B-5: Security Analyst’s Estimates Firm Analyst Date Estimated EPS Stifel David A Schick 11.19.15 $3.33 PERM DENIED Req. Entitlement 11.18.15 $3.46 PERM DENIED Req. Entitlement 11.18.15 $3.15 PERM DENIED Req. Entitlement 11.18.15 $3.15 Brean Capital LLC Eric B Tracy 11.18.15 $3.15 PERM DENIED Req. Entitlement 11.18.15 $3.15 PERM DENIED Req. Entitlement 11.18.15 $3.25 PERM DENIED Req. Entitlement 11.18.15 $3.34 PERM DENIED Req. Entitlement 11.18.15 $3.25 PERM DENIED Req. Entitlement 11.18.15 $3.34 PERM DENIED Req. Entitlement 11.18.15 $3.30 PERM DENIED Req. Entitlement 11.18.15 $3.36 PERM DENIED Req. Entitlement 11.17.15 $3.25 PERM DENIED Req. Entitlement 11.17.15 $3.27 PERM DENIED Req. Entitlement 11.17.15 $3.57 PERM DENIED Req. Entitlement 11.17.15 $3.42 PERM DENIED Req. Entitlement 11.17.15 $3.13 SunTrust Robinson Humphrey Req. Entitlement 11.17.15 $3.30 PERM DENIED Req. Entitlement 11.17.15 $3.21 PERM DENIED Req. Entitlement 11.17.15 $3.25 Raymond James Daniel R Wewer Jr 11.17.15 $3.30 PERM DENIED Req. Entitlement 11.17.15 $3.40 Oppenheimer & Co Brian W Nagel 11.17.15 $3.10 PERM DENIED Req. Entitlement 11.17.15 $3.53 PERM DENIED Req. Entitlement 11.17.15 $3.18 Susquehanna Financial Christopher Svezia 11.17.15 $3.28 Wolfe Research Aram Rubinson 11.17.15 $2.76 Source: Bloomberg Consensus EPS = $3.31 High (Date ≥ Nov.17) = $3.57 Average EPS (Date ≥ Nov.17) = $3.26 Low (Date ≥ Nov.17) = $2.76 Our Estimated EPS = $3.29
  • 26. Appendix B-6: Earnings Growth Rate Estimate Applied to Current Earnings DKS Historical EPS Data Fiscal Year EPS 1 Yr. Growth Rate 2014 $2.84 5.6% 2013 $2.69 28.1% 2012 $2.10 40.0% 2011 $1.50 30.4% 2010 $1.15 419.4% 2009 ($0.36) (127.1%) 2008 $1.33 31.68% 2007 $1.01 48.53% 2006 $0.68 6.25% 2005 $0.64 156.0% 2004 $0.25 n/a Source: Bloomberg and Analyst’s Calculations 4 Yr. EPS Growth = 26.03% EPS2016 = 2.84 (1+0.2603)14/12 = $3.72 (4 Yr. EPS growth rate applied to current EPS) Note: Only four years of historical data were included in EPS growth rate calculations. The growth rate in 2010 is skewed because of how poorly Dick’s performed after the recession. Prior to 2010, their growth rates were very sporadic. Thus, we believe that only the past four years of data have real meaning.
  • 27. Appendix B-7: Comparative Analysis of P/E Ratios P/E Multiple TTM P/E – DKS 12.78 TTM P/E – HIBB 11.48 TTM P/E – CAB 17.01 Historical Average P/E – DKS 21.45 Historical Average P/E – HIBB 20.25 Justified P/E 14.00 Source: Bloomberg & Analyst’s Calculations Note: For comparative analysis of P/E ratios, we focused on what investors are willing to pay for Dick’s Sporting Goods and their competitors most recently, and what investors are willing to pay for Dick’s and their closest competitor historically. We chose to closely look at what investors are willing to pay for DKS and comparable companies most recently because retail, in general, have been hit pretty hard by the market recently. Many major retailers have reported sour earnings and that has had an impact on Dick’s and Hibbett Sports particularly. To a lesser degree, we considered what investors are willing pay to for Dick’s and their closest competitor on a historical basis because today’s prices are trading at a discount. However, because we believe that investor expectations of retail stocks will remain fairly low, but we placed more weight on TTM P/E ratios.
  • 28. Appendix B-8: Comparative Analysis of EV/EBITDA Ratios EV/EBITDA Comparison TTM EV/EBITDA – DKS 7.93 TTM EV/EBITDA – HIBB 8.04 Historical 3 Yr. Average EV/EBITDA – DKS 8.46 Historical 3 Yr. Average EV/EBITDA – HIBB 9.67 Justified EV/EBITDA 8.00 Source: Bloomberg & Analyst’s Calculations Note: For EV/EBITDA ratios we placed most of our emphasis on comparing Dick’s Sporting Goods to Hibbett Sports. Cabela’s, although a competitor in the industry, sells a much larger proportion of outdoor equipment. Thus, aside from a few similarities, they face a different set of risks to operating profits than Dick’s and Hibbett Sports do. As a conservative estimate, we estimated closer to TTM EV/EBITDA between both DKS and HIBB because we Dick’s current performance will be closer to future performance than an average of performance from three years ago. Dick’s EBITDA margins peaked in 2012 and have declined steadily since then.
  • 29. Appendix B-9: Target Price Estimates Broker Analyst Target Price Estimates Firm Analyst Date Target Price Stifel David A Shick 11.19.15 $46 Monness, Crespi, Hardt & Co Jim Chartier 11.19.15 $45 Morgan Stanley Simeon Gutman 11.18.15 $44 Goldman Sachs Stephen Tanal 11.18.15 $49 Brean Capital LLC Eric B Tracy 11.18.15 $44 UBS Michael Lasser 11.18.15 $43 Stephens Inc Rick Nelson 11.18.15 $42 Canaccord Genuity Camilo R Lyon 11.18.15 $46 Barclays Matthew McClintock 11.18.15 $50 Tesley Advisory Group Joseph I Feldman 11.18.15 $50 BMO Capital Markets Wayne Hood 11.17.15 $48 RBC Capital Markets R Scot Ciccarelli 11.17.15 $45 Credit Suisse Seth Sigman 11.17.15 $40 SunTrust Robinson Humphrey David G Magee 11.17.15 $43 J.P Morgan Christopher Horvers 11.17.15 $41 Robert Baird Peter S Benedict 11.17.15 $42 Sterne Agee CRT Sam Poser 11.17.15 $55 Cowen John Kernan 11.17.15 $43 Susquehanna Financial Christopher Svezia 11.17.15 $53 Wolfe Research Aram Rubinson 11.17.15 $32 Argus Research Corp Christopher Graja 08.26.15 $63 Imperial Capital LLC John O’Neil 07.08.15 $62 Source: Bloomberg Note: Third quarter results were reported November 17, 2015 Consensus Target Price = $46.74 High (Date ≥ Nov 17) = $55 Average Target Price (Date ≥ Nov 17) = $45.05 Low (Date ≥ Nov 17) = $32 Our Target Price = $49.27
  • 30. Appendix B-10: Valuation Template Source: Analyst’s Calculations Valuation Date November 20, 2015 Target Date January 31, 2017 Expected Diluted EPS $3.29 Method Value Weight Product Justified P/E 14.0 P/E Multiple 46.09$ 75% 34.57 Target Price 46.09$ EV/EBITDA Multiple 58.82$ 25% 14.70 Target Price Per Share 49.27$ Expected EBITDA 851,461$ Risk-free rate 3.02% Justified EV/EBITDA 8.0 Market risk premium 6.7% Enterprise Value 6,811,689$ Beta 0.93 Required Rate of Return 9.3% Size Premium 1.01% Current portion of L-T debt - Required Return Adjusted for Size 10.3% Current portion of capital leases 950 Short termdebt - Long termdebt - Target Price 49.27$ Capital leases 4,163 Required Return 10.3% Minority interest - Number of months to discount 14 Preferred stock - Current value $43.97 Other - Less: Excess cash 118,421 Less: Investment securities - Current Stock Value $43.97 Less: Other Nonoperating assets - Current Stock Price 38.90$ Less: Equity investments - Margin of Safety 13.0% Net Debt 123,534$ Enterprise Value 6,811,689 Less: Net Debt (123,534) Equity Value 6,688,156$ Equity Value 6,688,156 Shares outstanding 113,706 Equity value / share 58.82$ Current Value Calculation Margin of Safety Calculation Calculation of Equity Value Calculation of Equity Value per Share Valuation Basedon P/E Targe Price Calculation Valuation Basedon EV/EBITDA Calculation of Enterprise Value Estimating RequiredRate of Return on Equity Calculation of ExpectedNet Debt