The document provides information about D.G. Khan Cement Company Limited (DGKC), including its vision, mission, values, board of directors, management structure, subsidiaries, production facilities, and financial performance. Key details include:
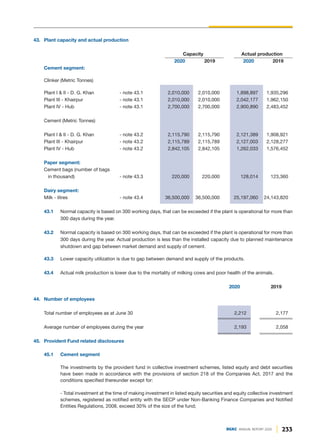
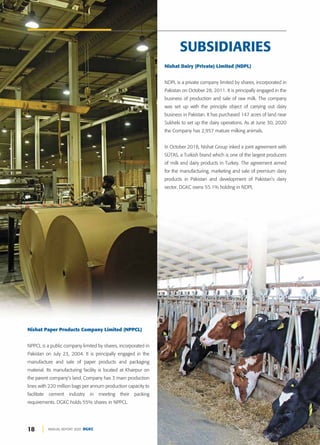
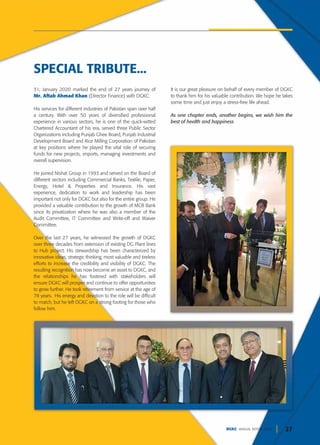
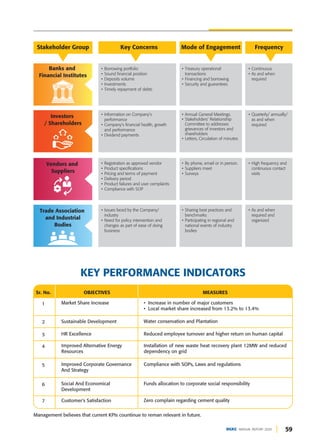
- DGKC is a cement manufacturer based in Pakistan with three production plants.
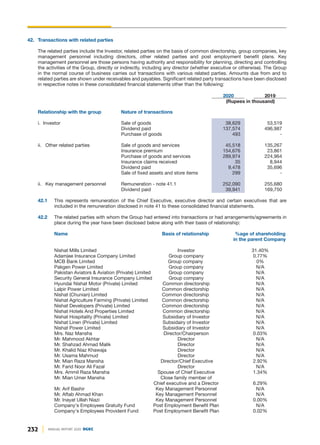
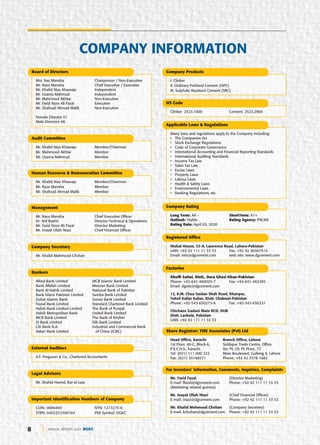
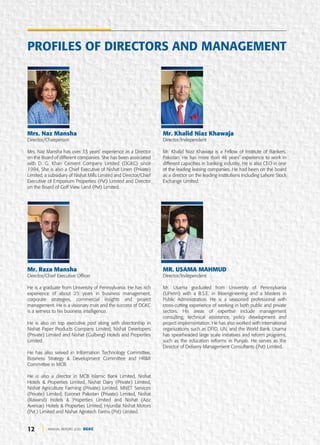
- The board of directors is led by Chairperson Mrs. Naz Mansha and CEO Mr. Raza Mansha. Other directors include Mr. Khalid Niaz Khawaja, Mr. Usama Mahmud, and Mr. Mahmood Akhtar.
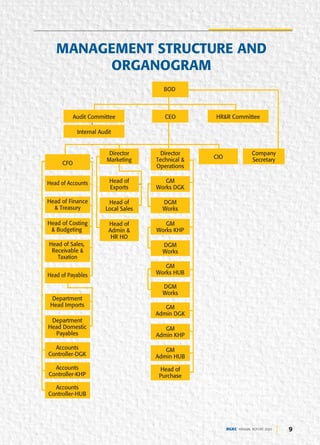
- The management structure includes the CEO, CFO, directors of marketing, technical operations, and other department heads.
-


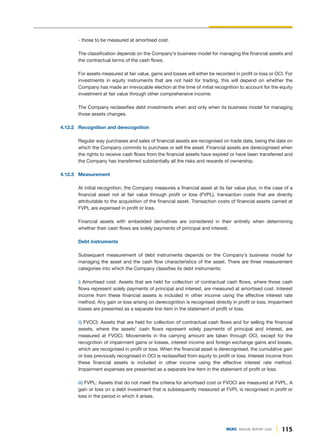
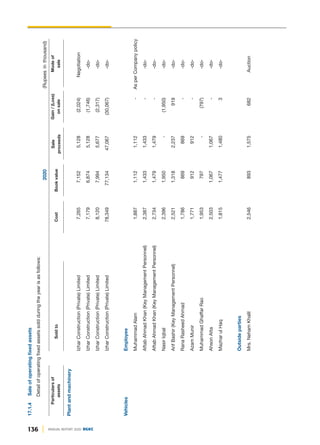
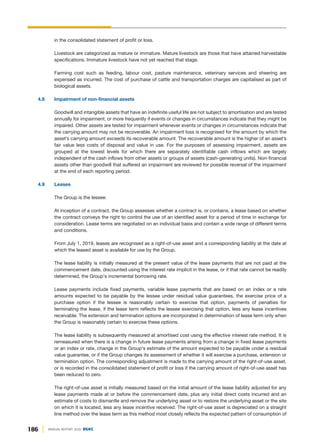
![114 ANNUAL REPORT 2020 DGKC
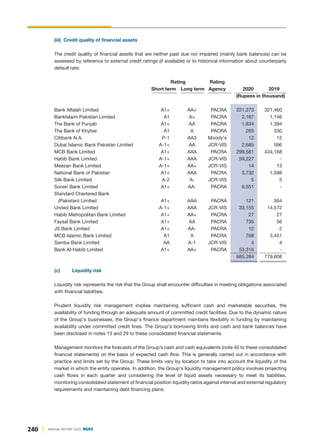
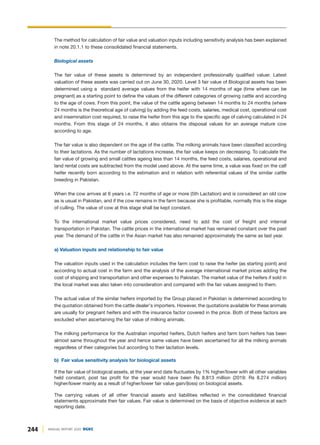
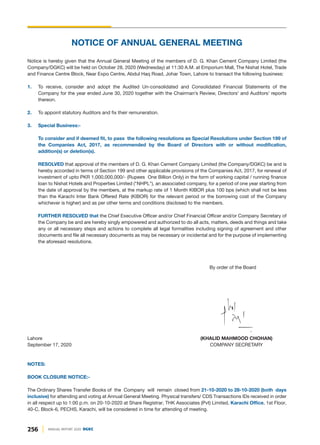
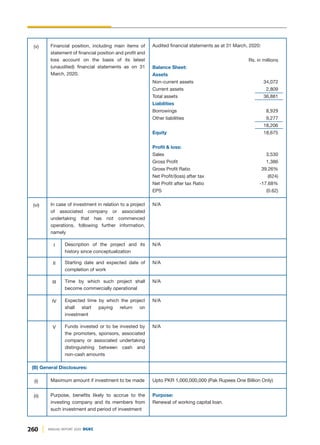
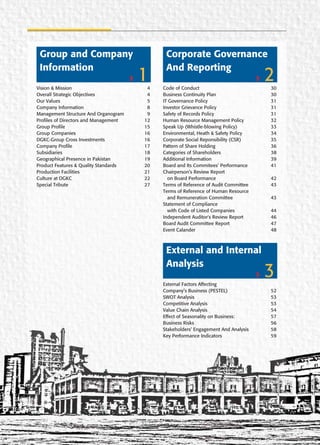
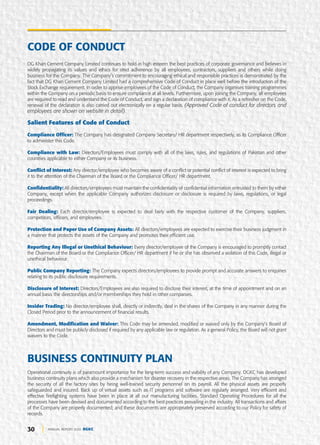
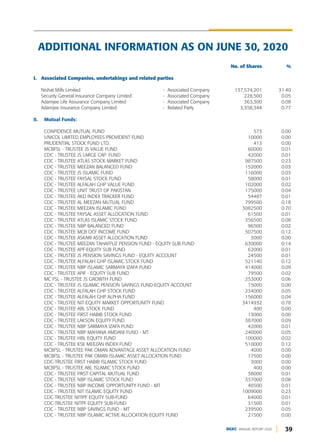
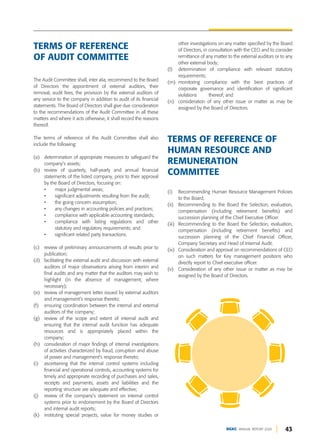
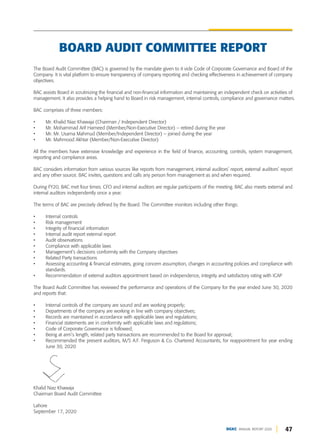
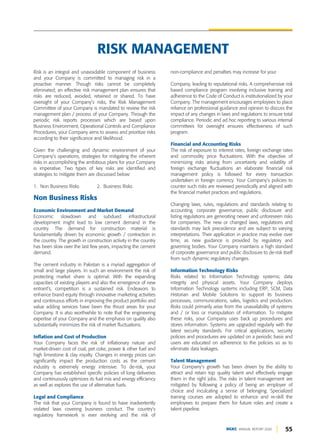
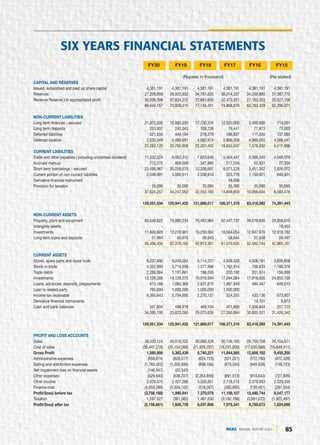
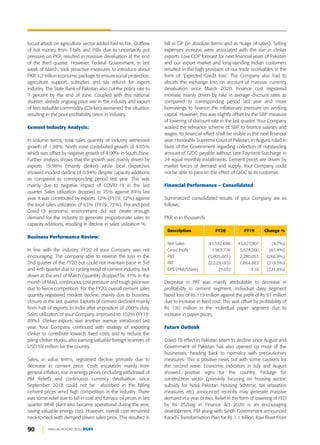
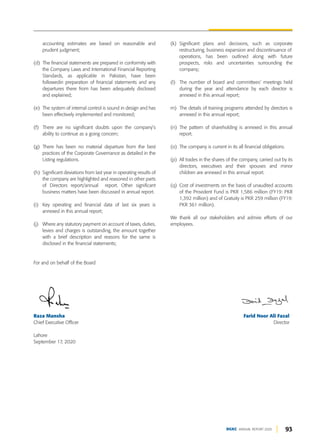
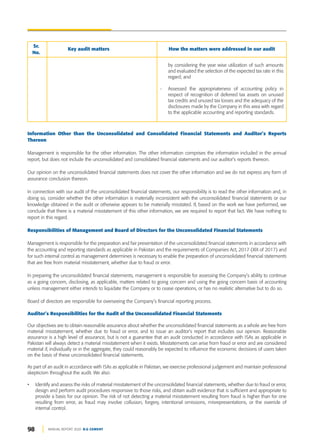
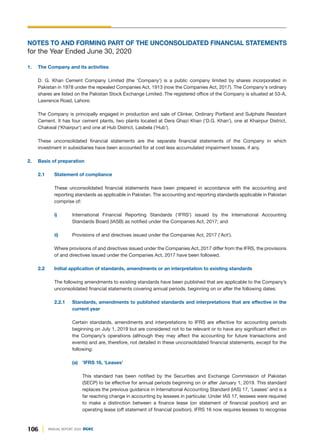
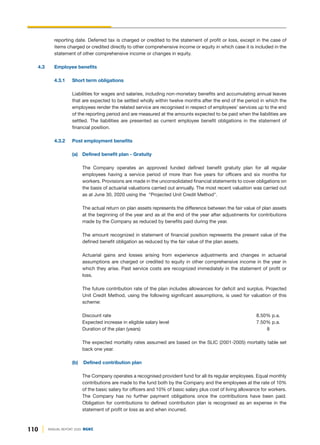
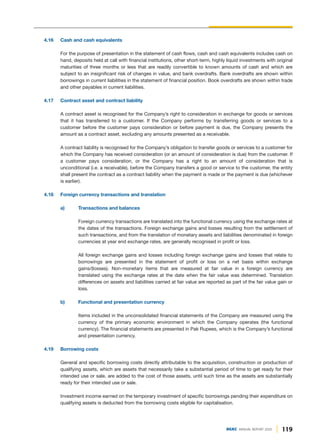
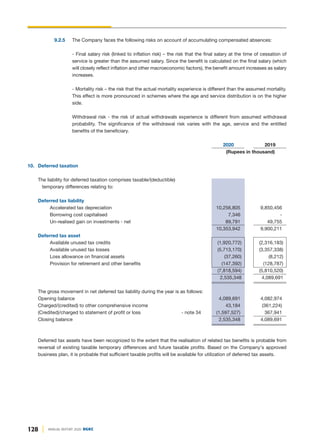
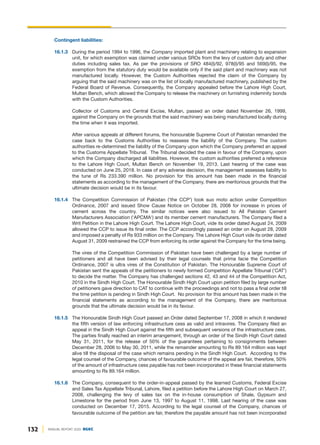
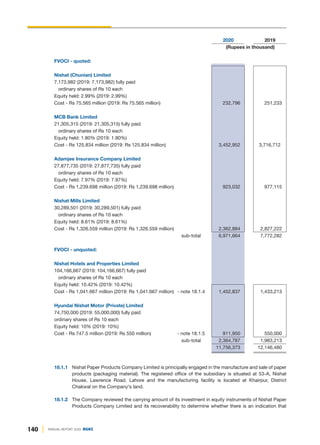
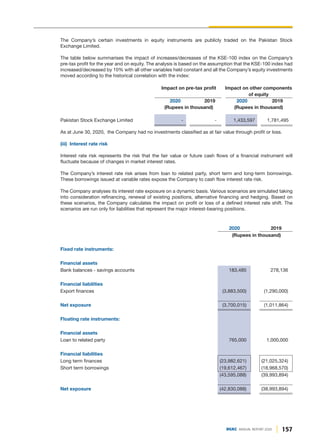
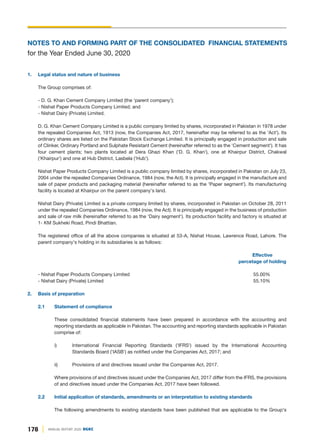
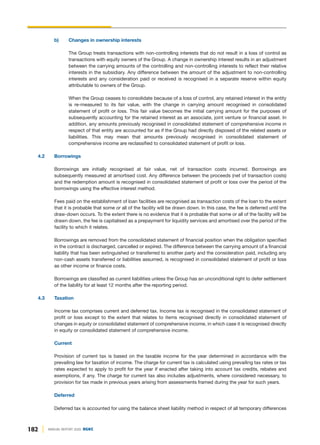
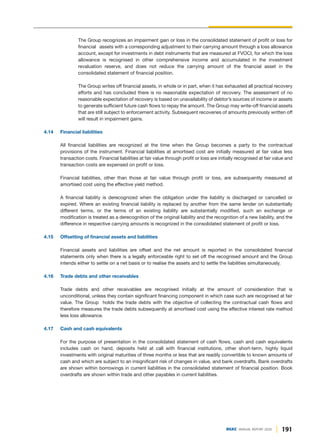
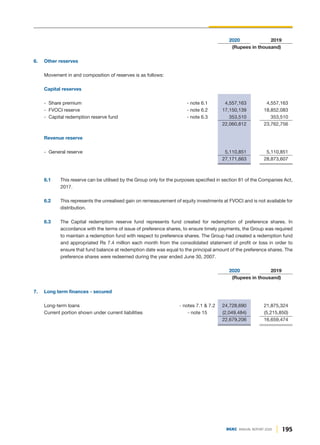
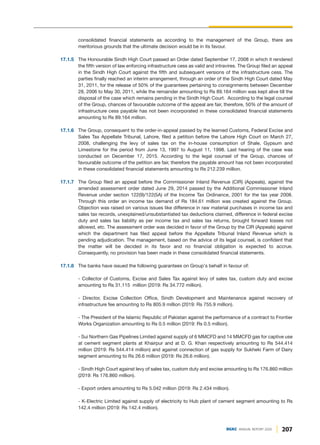
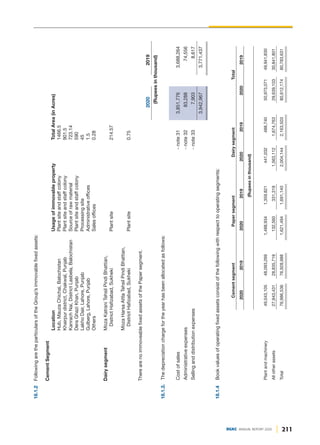
4.9.1 Investments in equity instruments of subsidiaries
Investment in equity instruments of subsidiary is measured at cost as per the requirements of IAS-27
"Separate Financial Statements". However, at subsequent reporting dates, the Company reviews the
carrying amount of the investment and its recoverability to determine whether there is an indication
that such investment has suffered an impairment loss. If any such indication exists, the carrying
amount of the investment is adjusted to the extent of impairment loss. Impairment losses are
recognised as an expense in the statement of profit or loss.
The Company assesses at the end of each reporting period whether there is any indication that a
previously recognised impairment loss may no longer exist or may have decreased. It assesses
whether there have been favourable events or changes in circumstances, since impairment loss was
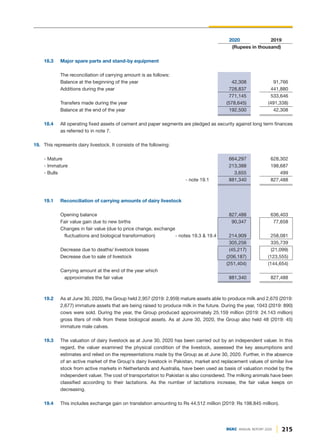
recognised. If any such indication exists, the Company estimates the recoverable amount of that
investment and reverses the impairment loss. The amount of any reversal recognised is restricted to
increasing the carrying value of investment to the carrying value that would have been recognised if
the original impairment had not occurred.
The Company is required to issue consolidated financial statements along with its separate financial
statements in accordance with the requirements of IFRS 10, 'Consolidated financial statements' and
IAS 27, 'Separate financial statements'.
4.10 Stores, spare parts and loose tools
Stores, spare parts and loose tools are valued at moving weighted average cost except for items in transit
which are stated at invoice value plus other charges paid thereon till the reporting date. For items which are
slow moving and/or identified as obsolete, adequate provision is made for any excess book value over
estimated realizable value. The Company reviews the carrying amount of stores and spares on a regular basis
and provision is made for obsolescence.
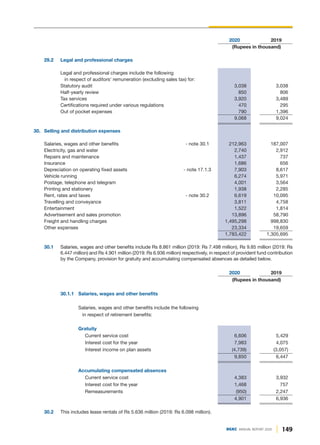
4.11 Stock-in-trade
Stock of raw materials (except for those in transit), work-in-process and finished goods are valued principally
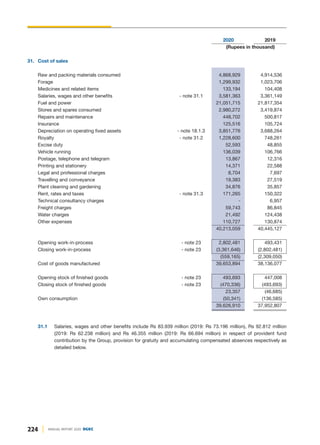
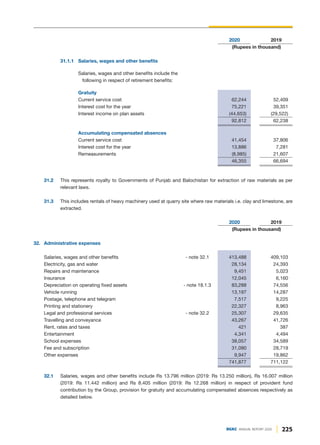
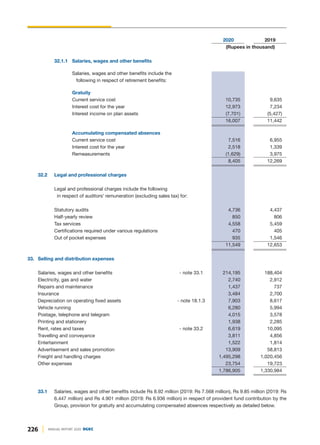
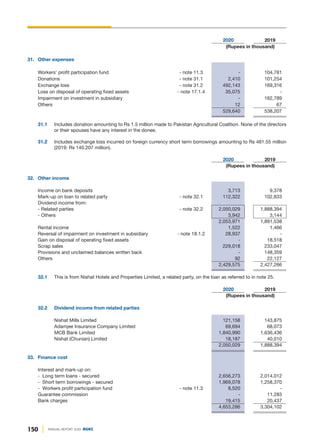
at the lower of weighted average cost and net realisable value ('NRV'). Stock of packing material is valued
principally at moving average cost. Cost of work-in-process and finished goods comprises cost of direct
materials, labour and related production overheads (based on normal operating capacity).
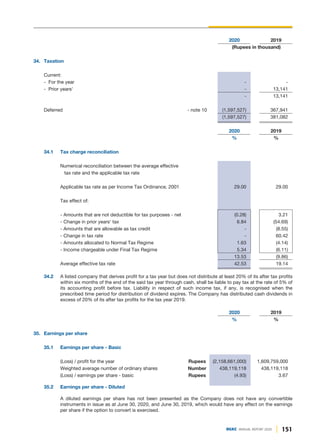
Materials in transit are stated at cost comprising invoice value plus other charges paid thereon.
Net realisable value is determined on the basis of estimated selling price of the product in the ordinary course
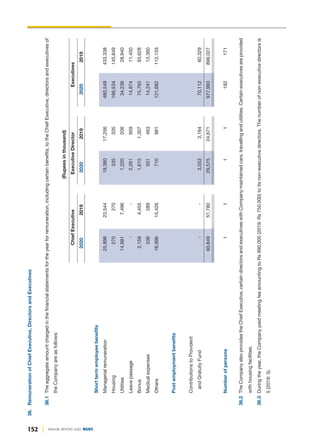
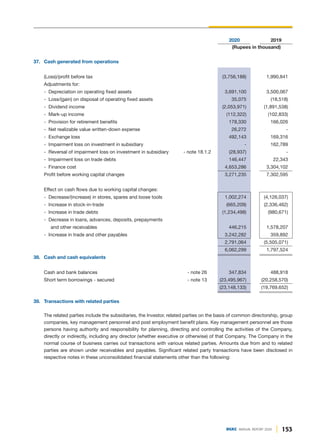
of business less estimated costs of completion and the estimated costs necessary to make the sale.
If the expected net realisable value is lower than the carrying amount, a write-down is recognised for the
amount by which the carrying amount exceeds its net realisable value. Provision is made in the
unconsolidated financial statements for obsolete and slow moving stock-in-trade based on management
estimate.
4.12 Financial assets
4.12.1 Classification
The Company classifies its financial assets other than investments in subsidiaries in the following
measurement categories:
- those to be measured subsequently at fair value [either through other comprehensive income
('OCI') or through profit or loss]; and](https://image.slidesharecdn.com/dgkhanannualreport-210129133013/85/Dg-khan-annual-report-115-320.jpg)
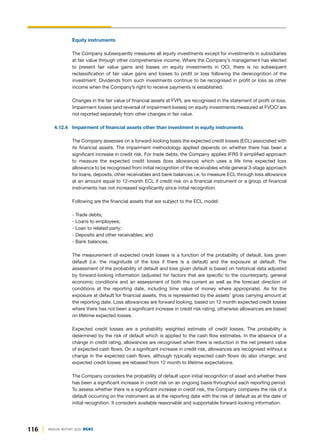

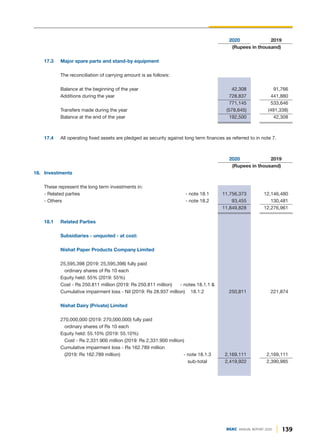
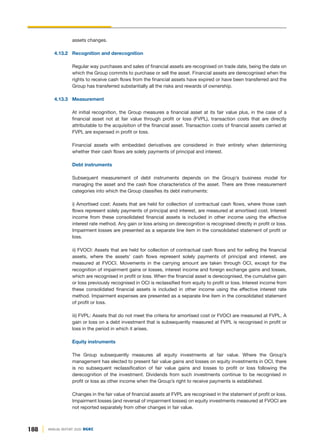
![143
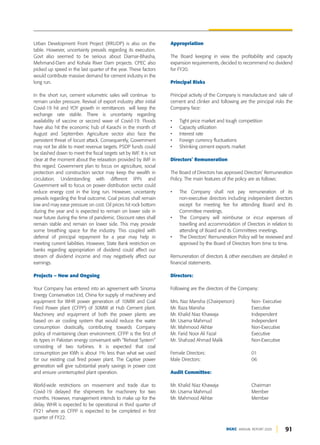
DGKC ANNUAL REPORT 2020
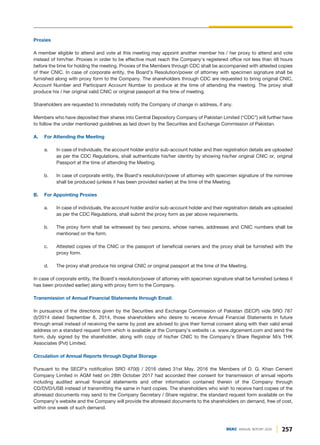
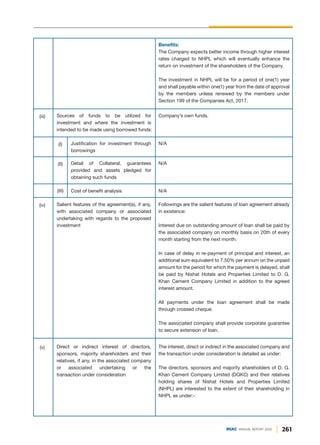
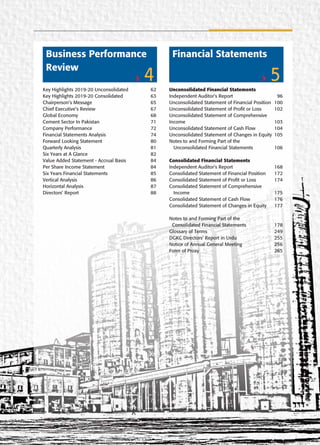
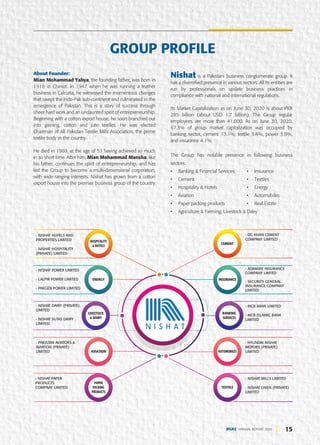
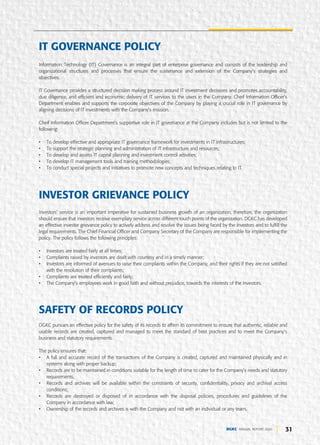
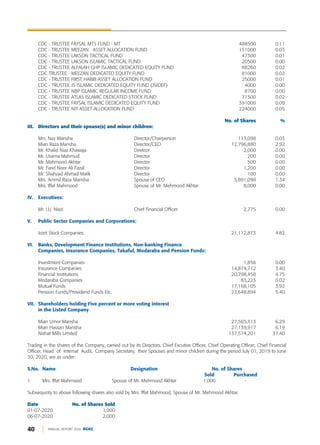
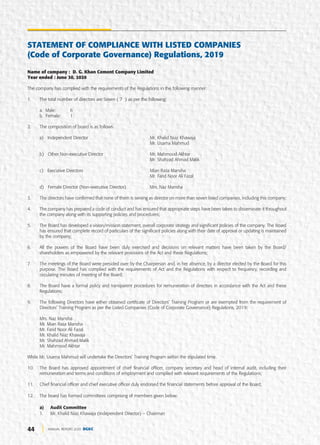
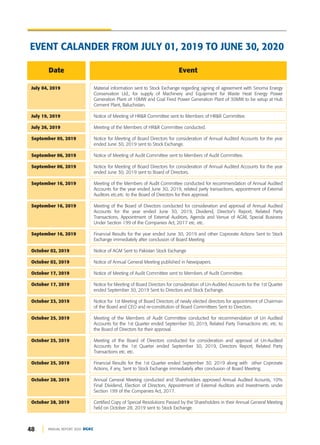
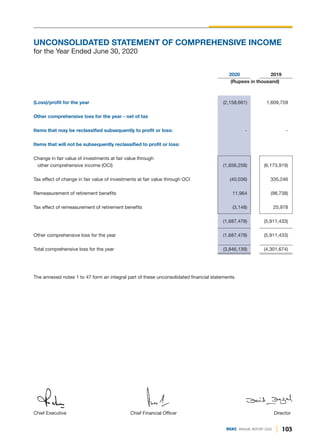
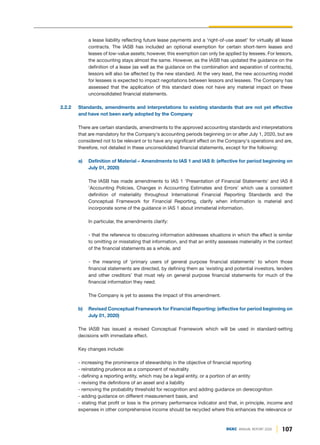
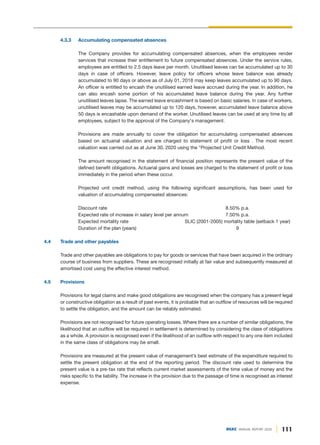
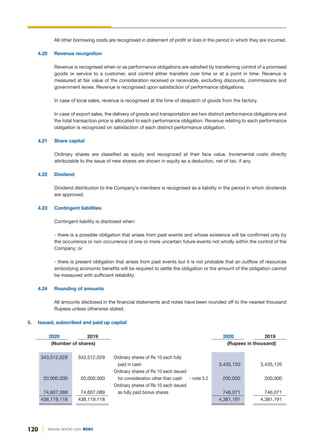
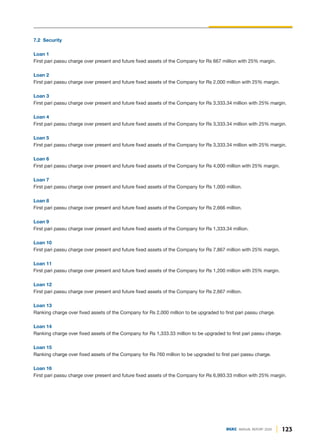
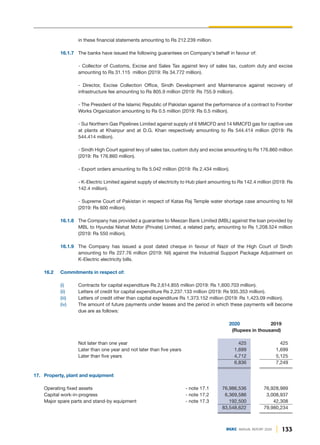
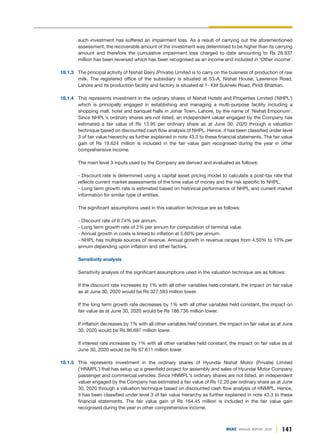
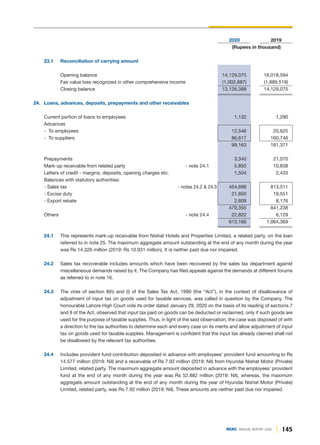
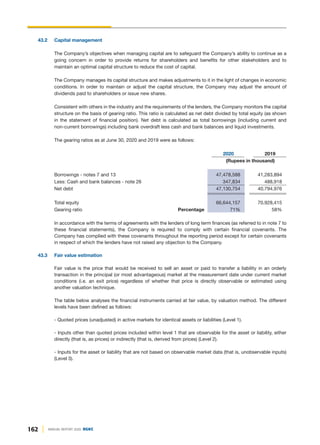
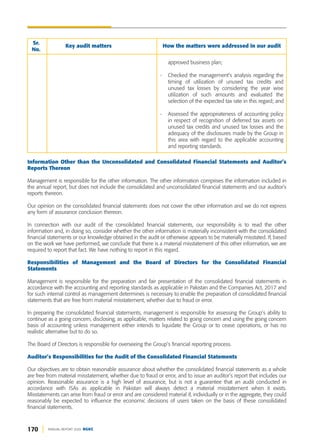
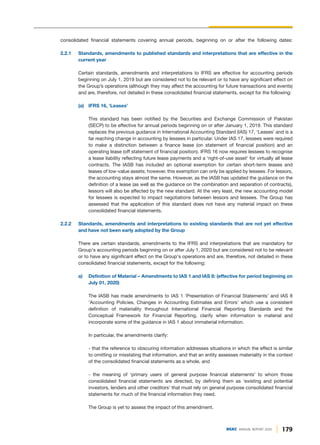
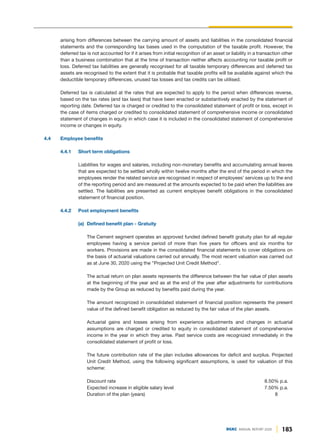
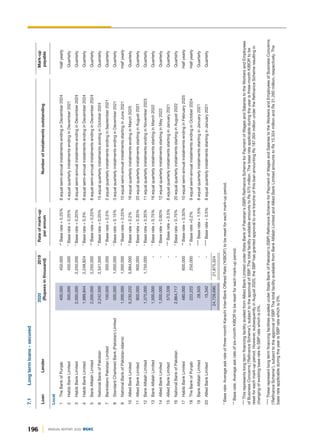
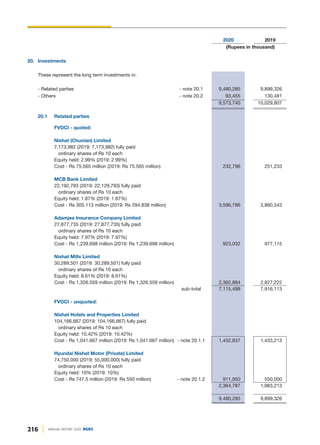
18.4 3,860,267 (2019: 3,860,267) shares of MCB Bank Limited are blocked in Central Depository Company
('CDC') account.
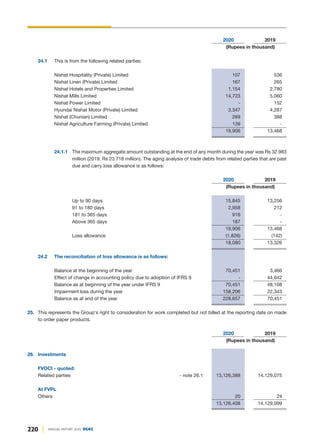
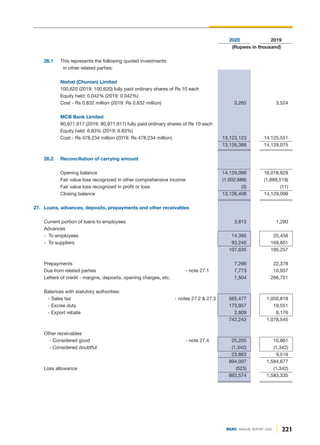
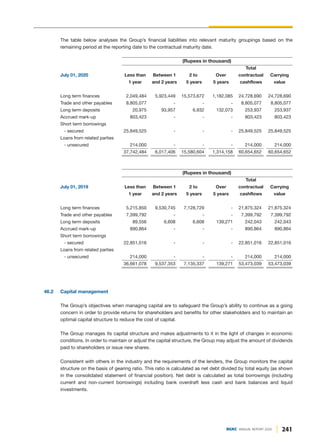
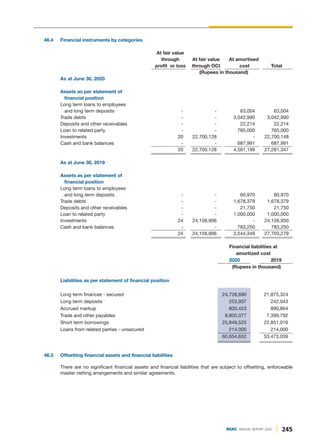
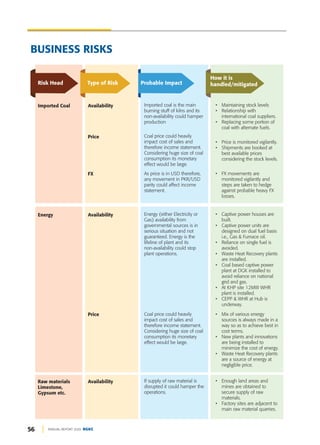
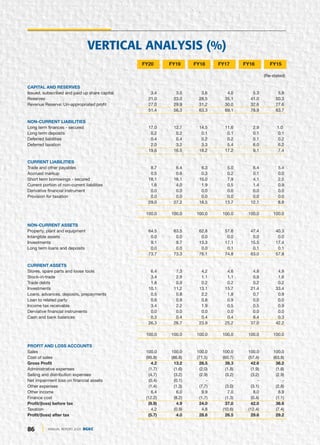
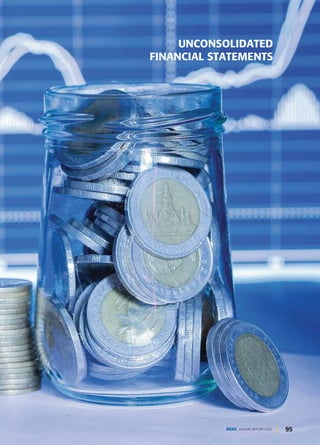
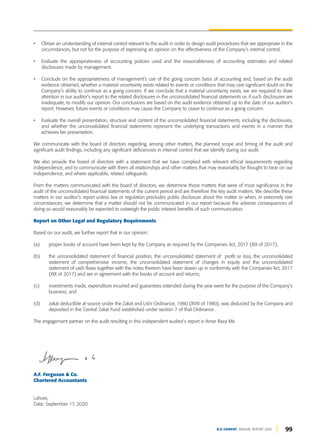
19. Long term loans to employees
These represent interest free loans given to employees for house building and purchase of motor vehicles and are
recoverable in equal monthly instalments over a period of 24 to 96 months. The loans are secured against the
employees' respective retirement benefits and are given as per Company's policy. These loans have not been carried
at amortised cost as the effect of discounting is not considered material.
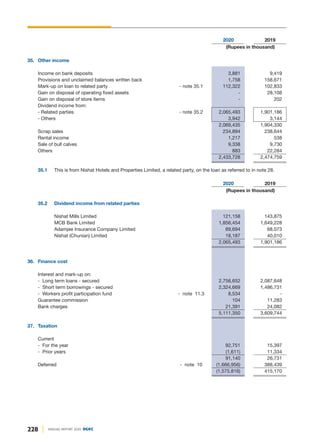
2020 2019
(Rupees in thousand)
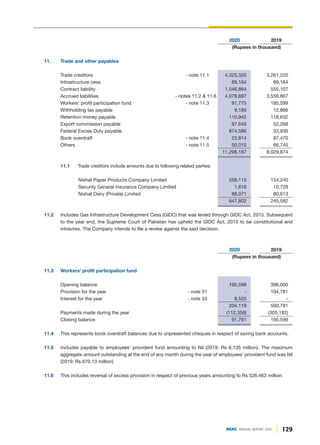
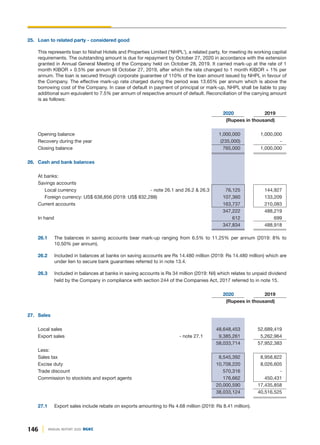
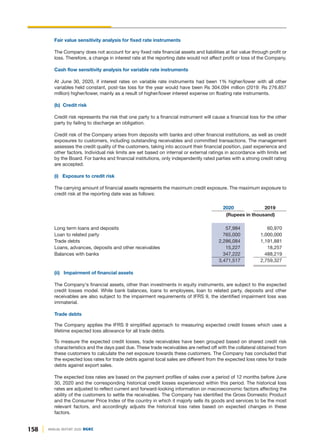
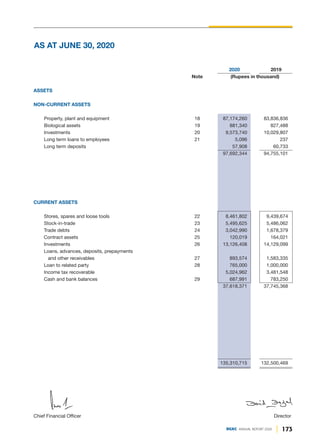
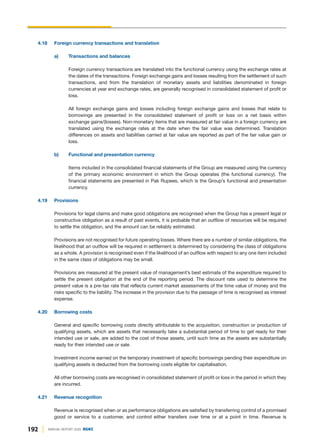
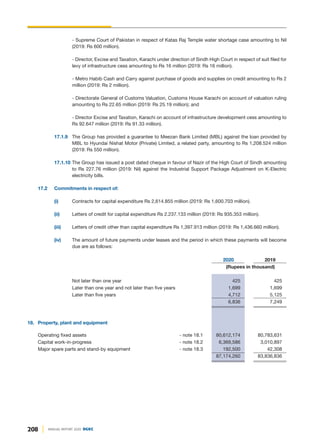
20. Stores, spare parts and loose tools
Stores [including in transit: Rs 16.973 million 2,469,974 4,565,609
(2019: Rs 5.563 million)]
Spare parts [including in transit Rs 277.493 million 5,710,691 4,628,854
(2019: Rs 188.185 million)]
Loose tools 57,325 45,801
8,237,990 9,240,264
20.1 Stores and spare parts include items which may result in fixed capital expenditure but are not distinguishable.
2020 2019
(Rupees in thousand)
21. Stock-in-trade
Raw materials 225,907 246,673
Packing material 353,699 236,287
Work-in-process - notes 21.1 & 21.2 3,361,646 2,802,481
Finished goods 411,743 428,617
4,352,995 3,714,058
21.1 Includes clinker costing Rs 263.423 million (2019: Nil) carried at its NRV amounting to Rs 237.15 million
(2019: Nil). The NRV write down expense of Rs 26.272 million (2019: Nil) has been charged to cost of sales.
21.2 Includes clinker having a carrying value of Rs 3,329.582 million (2019: Rs 2,755.69 million), some of which
may be sold in its current state but is not distinguishable.
2020 2019
(Rupees in thousand)
22. Trade debts
Secured 2,476,922 1,242,886
Unsecured - Related parties - note 22.1 20,271 13,657
2,497,193 1,256,543
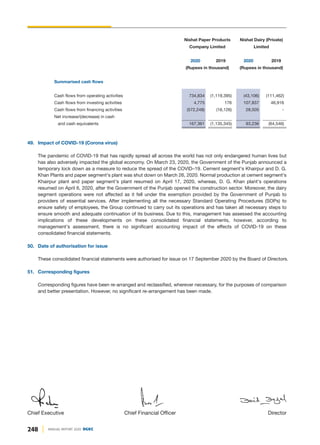
Loss allowance - note 22.2 (211,109) (64,662)
2,286,084 1,191,881](https://image.slidesharecdn.com/dgkhanannualreport-210129133013/85/Dg-khan-annual-report-144-320.jpg)

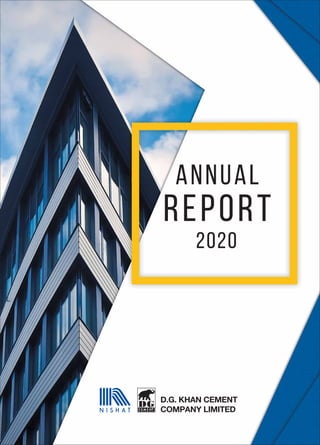
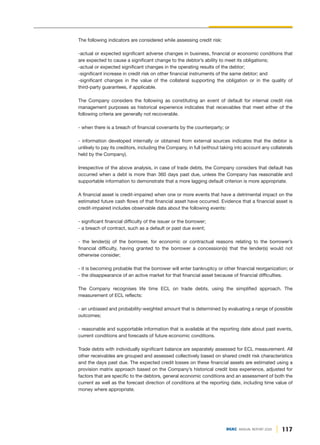
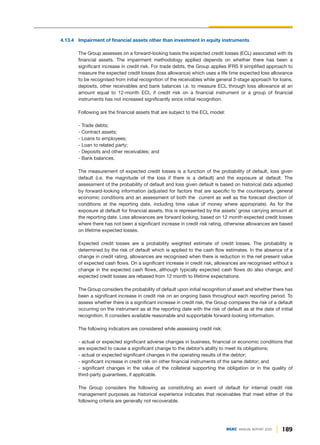
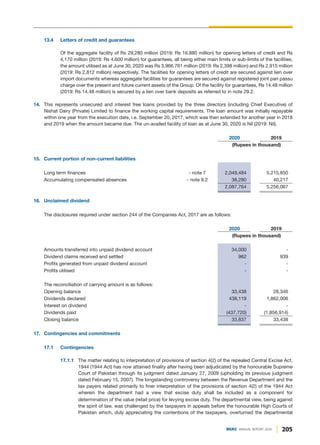
![187
DGKC ANNUAL REPORT 2020
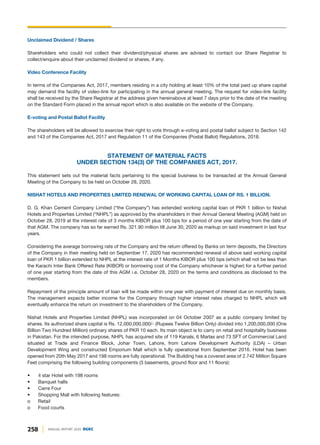
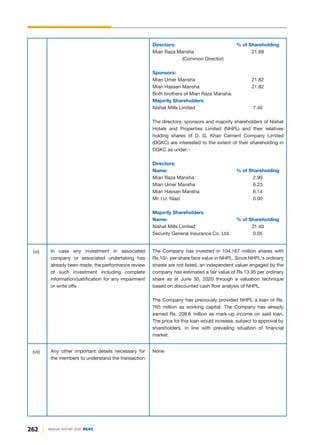
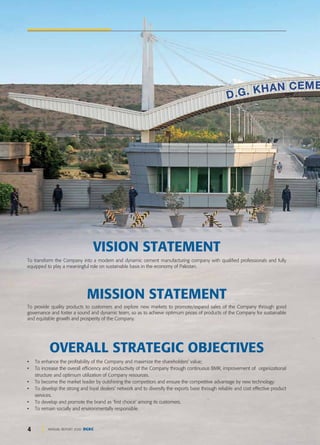
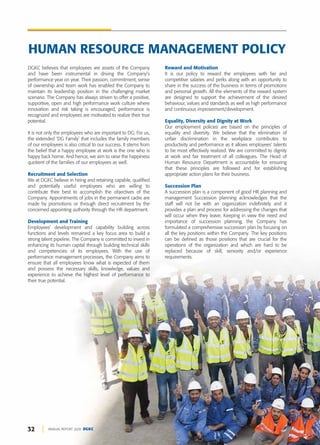
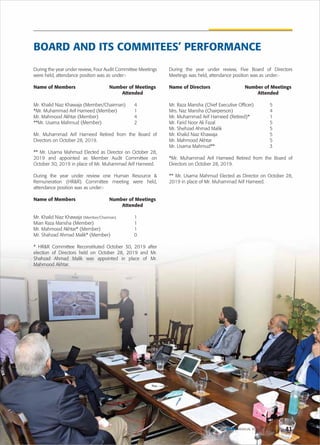
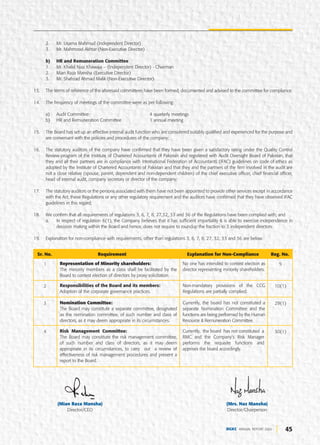
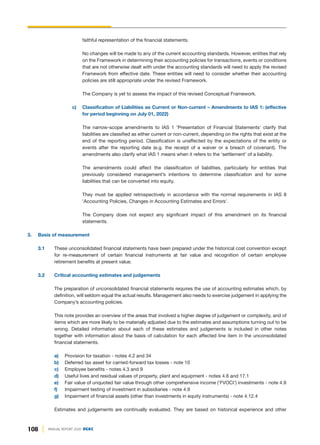
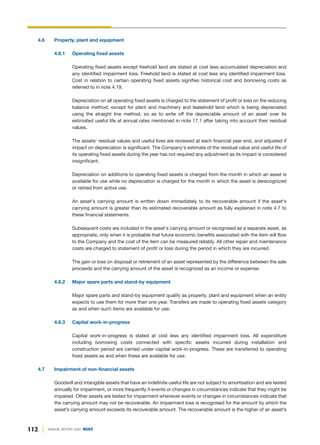
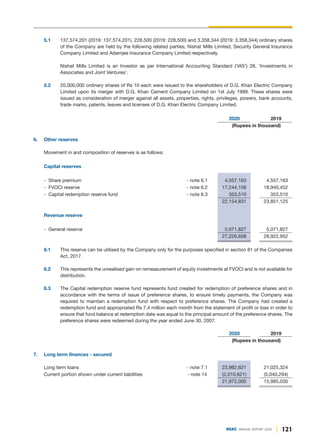
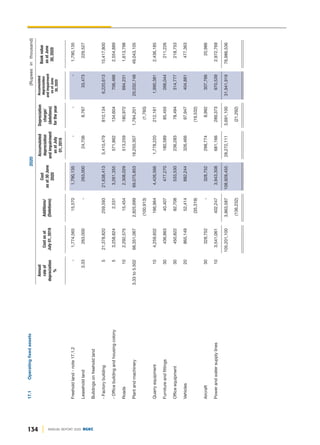
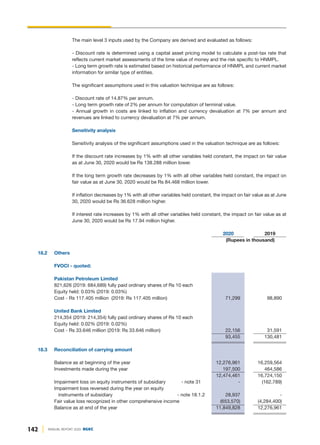
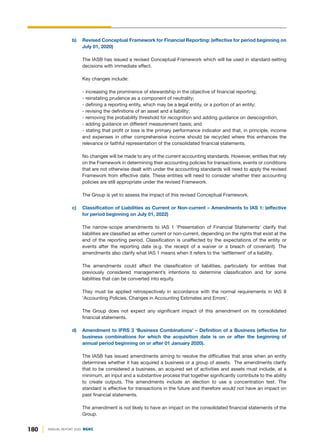
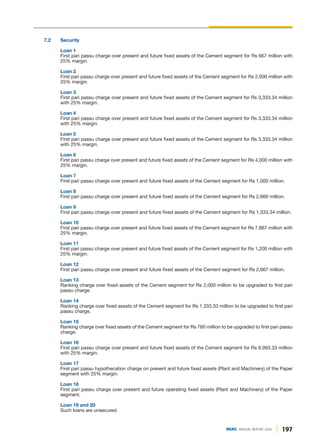
future economic benefits. The right-of-use asset is reduced by impairment losses, if any, and adjusted for
certain remeasurements of the lease liability.
Payments associated with short-term leases and all leases of low-value assets are recognised on a
straight-line basis as an expense in the consolidated statement of profit or loss. Short-term leases are leases
with a lease term of 12 months or less without a purchase option.
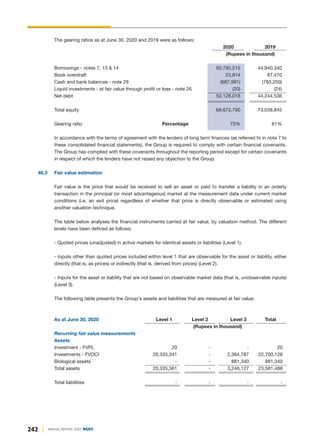
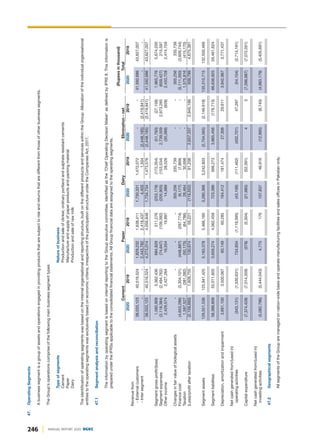
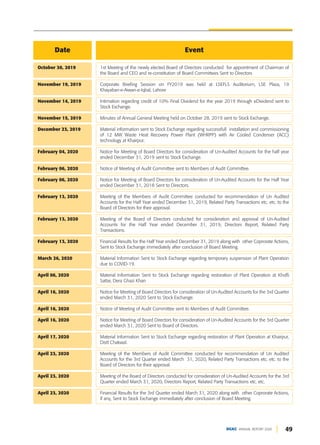
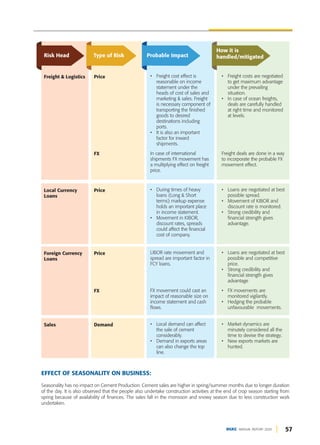
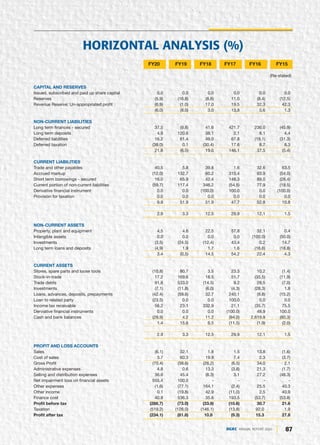
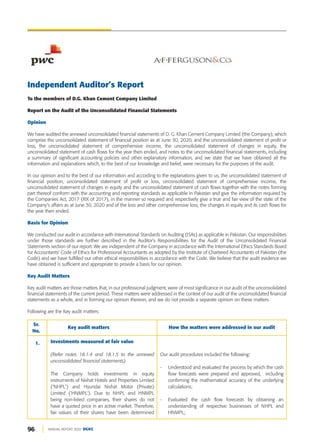
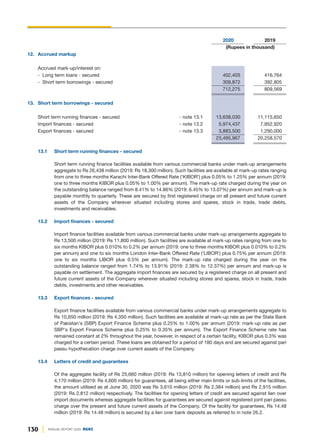
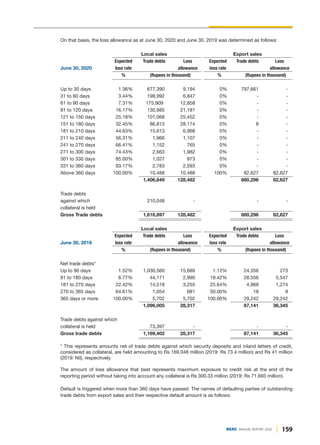
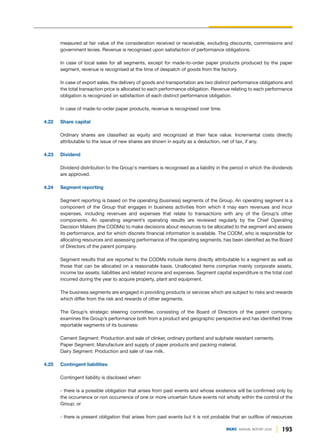
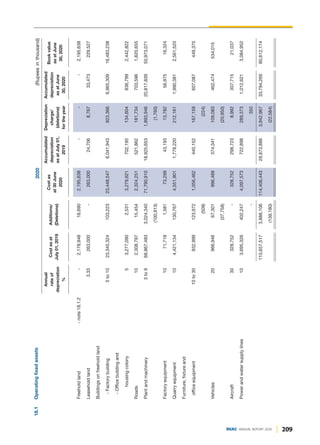
4.10 Investments
Investments intended to be held for less than twelve months from the reporting date or to be sold to raise
operating capital, are included in current assets, all other investments are classified as non-current.
Management determines the appropriate classification of its investments at the time of the purchase and
re-evaluates such designation on a regular basis.
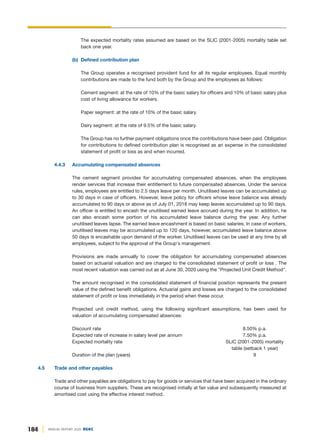
4.11 Stores, spares and loose tools
Stores, spare parts and loose tools are valued at moving weighted average cost except for items in transit
which are stated at invoice value plus other charges paid thereon till the reporting date. For items which are
slow moving and/or identified as obsolete, adequate provision is made for any excess book value over
estimated realizable value. The Group reviews the carrying amount of stores and spares on a regular basis
and provision is made for obsolescence.
4.12 Stock-in-trade
Stock of raw materials (except for those in transit), work in process and finished goods are valued principally
at the lower of weighted average cost and net realisable value ('NRV'). Stock of packing material is valued
principally at moving average cost. Cost of work-in-process and finished goods comprises cost of direct
materials, labour and related production overheads (based on normal operating capacity).
Materials in transit are stated at cost comprising invoice value plus other charges paid thereon.
Net realisable value is determined on the basis of estimated selling price of the product in the ordinary course
of business less estimated costs of completion and estimated cost necessary to make the sale.
If the expected net realisable value is lower than the carrying amount, a write-down is recognised for the
amount by which the carrying amount exceeds its net realisable value. Provision is made in the consolidated
financial statements for obsolete and slow moving stock-in-trade based on management estimate.
4.13 Financial assets
4.13.1 Classification
The Group classifies its financial assets in the following measurement categories:
- those to be measured subsequently at fair value [either through other comprehensive income
('OCI') or through profit or loss]; and
- those to be measured at amortised cost.
The classification depends on the Group’s business model for managing the financial assets and the
contractual terms of the cash flows.
For assets measured at fair value, gains and losses will either be recorded in profit or loss or OCI. For
investments in equity instruments that are not held for trading, this will depend on whether the Group
has made an irrevocable election at the time of initial recognition to account for the equity investment
at fair value through other comprehensive income.
The Group reclassifies debt investments when and only when its business model for managing those](https://image.slidesharecdn.com/dgkhanannualreport-210129133013/85/Dg-khan-annual-report-188-320.jpg)
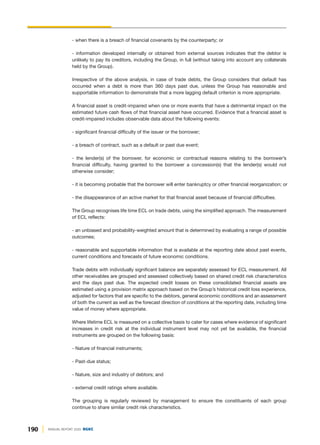
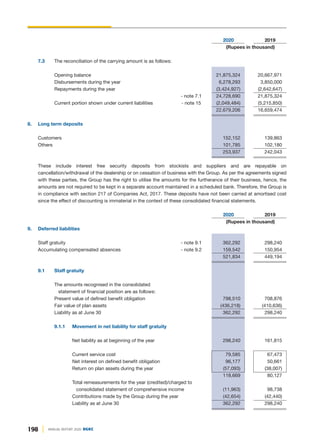
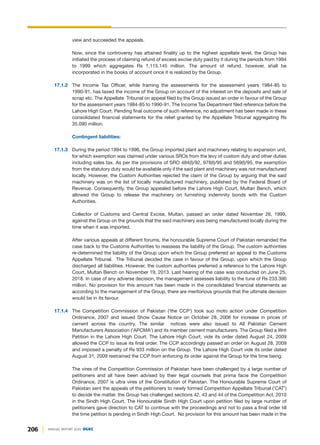
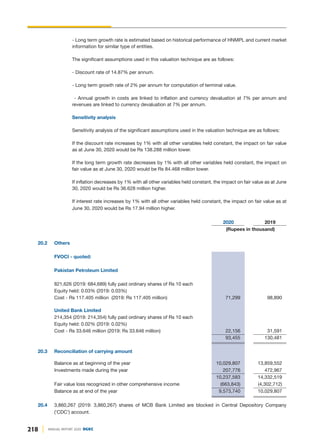
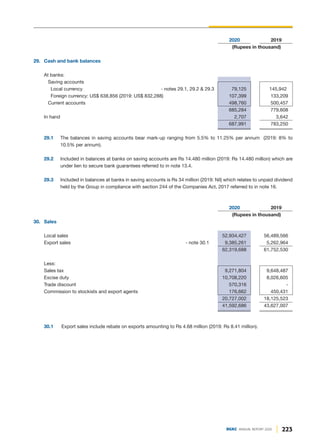
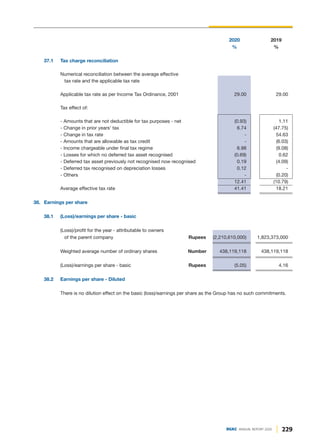
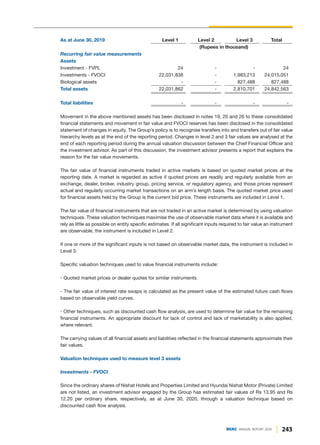
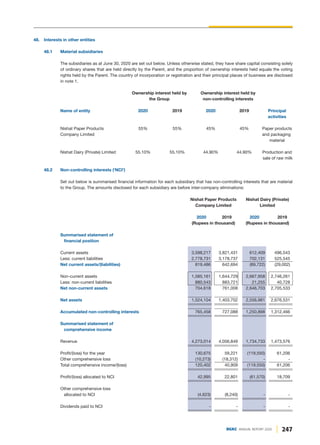
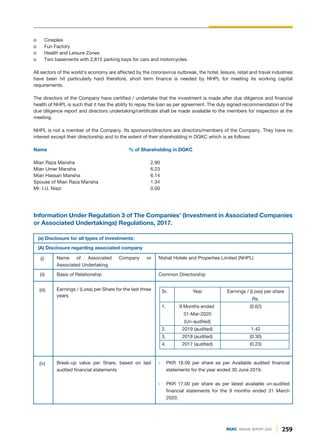
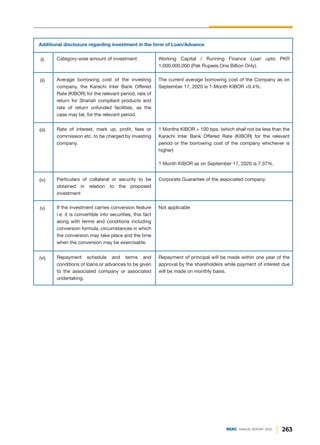
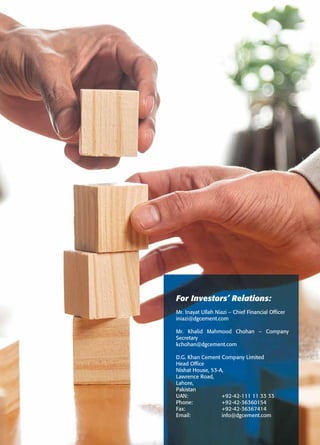
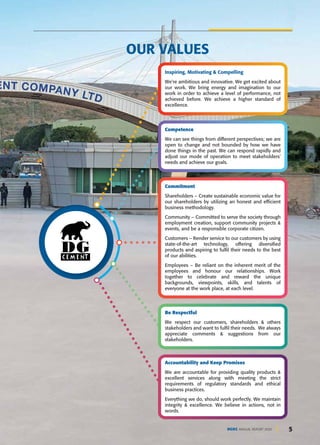
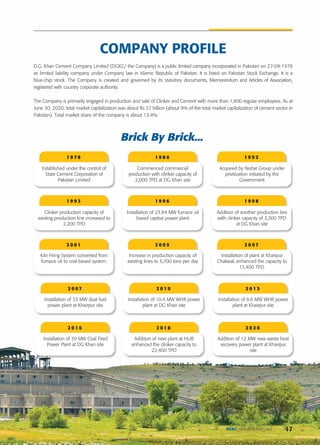
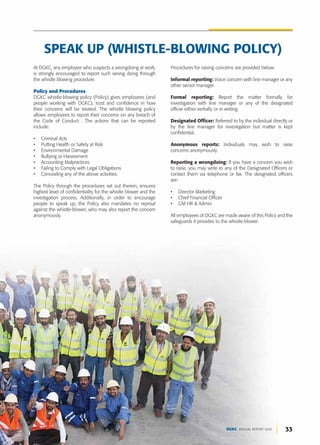
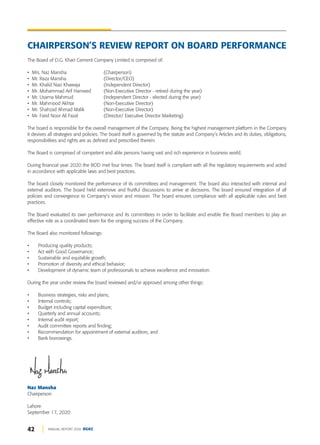
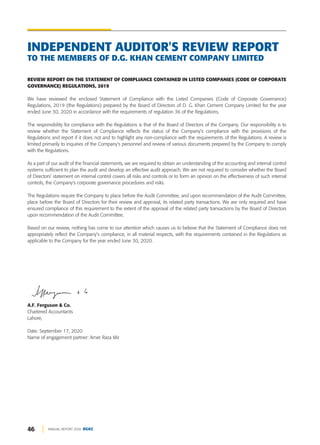
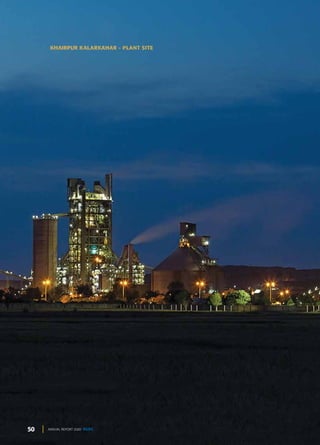
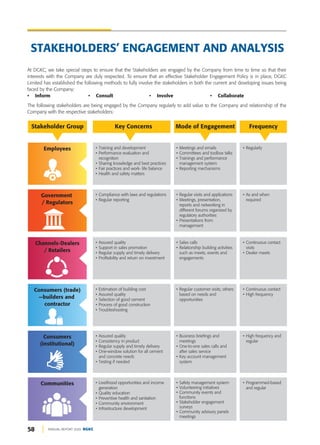
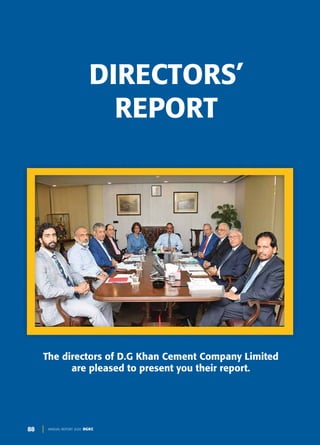
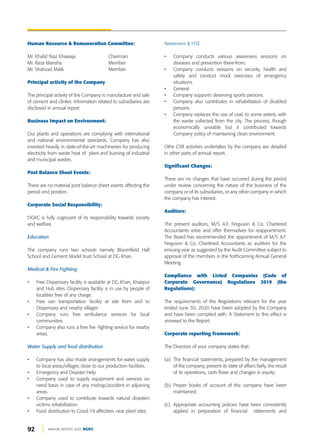
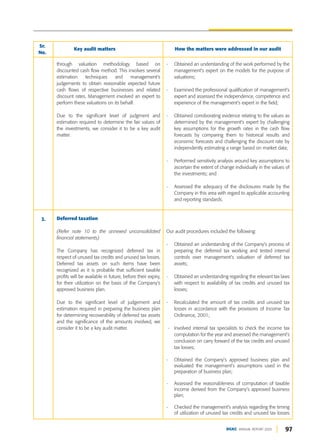
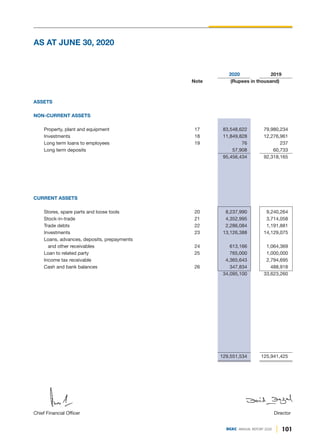
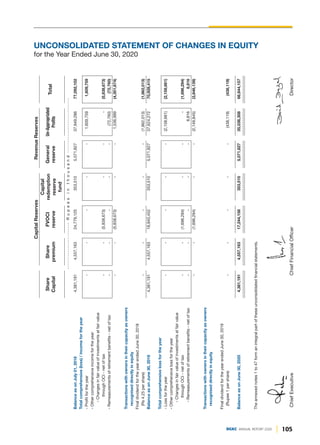
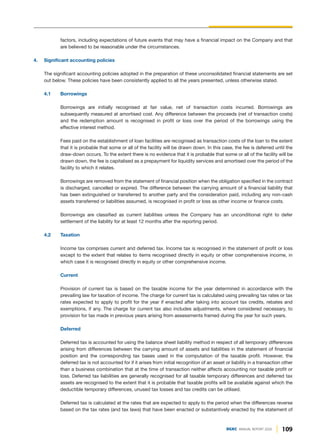
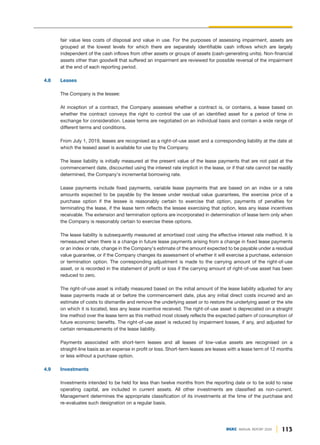
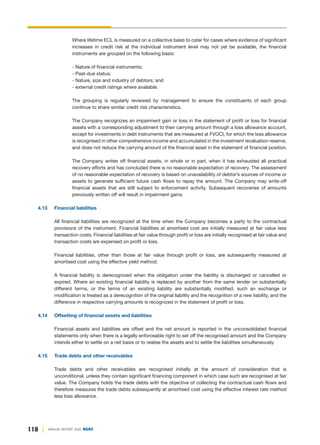
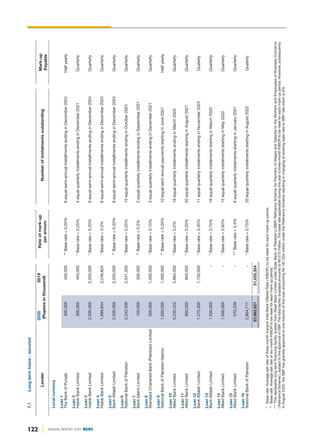
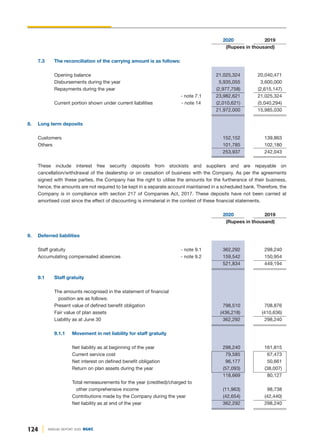
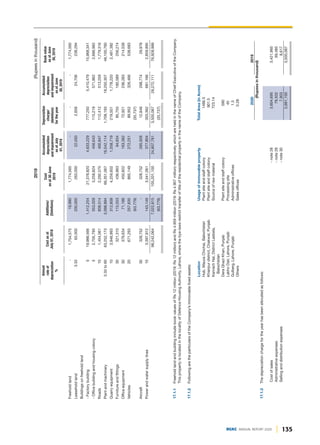
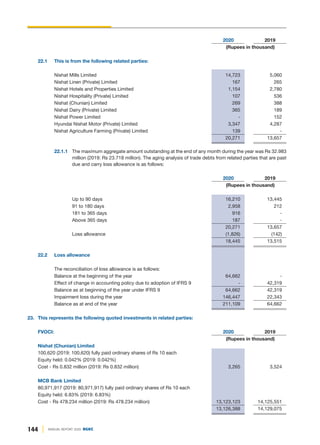
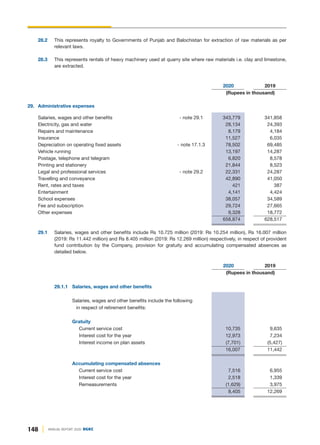
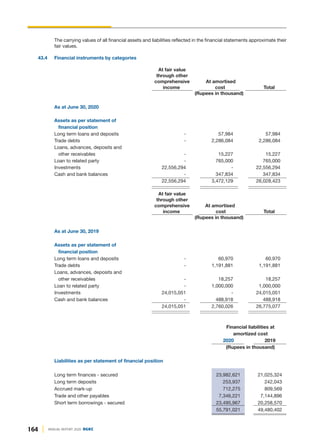
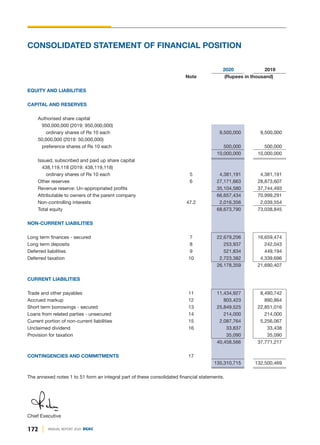
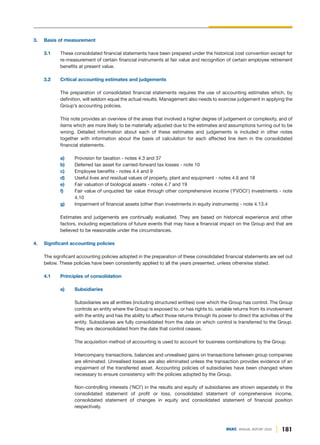
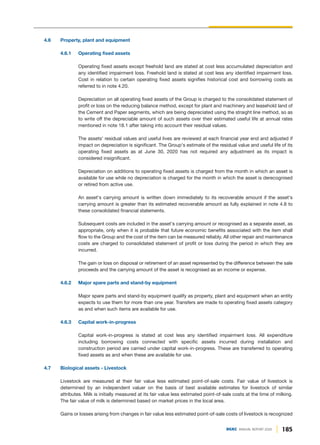
![21. Long term loans to employees
These represent interest free loans given to employees for house building and purchase of motor vehicles and are
recoverable in equal monthly instalments over a period of 24 to 96 months. The loans are secured against the
employees' respective retirement benefits and are given as per Group's policy. These loans have not been carried at
amortised cost as the effect of discounting is not considered material.
2020 2019
(Rupees in thousand)
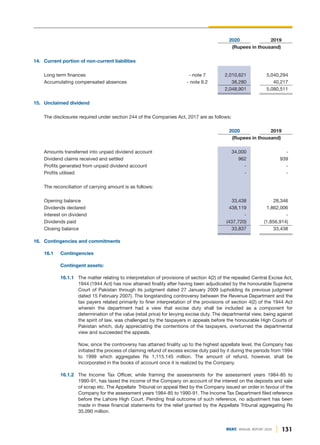
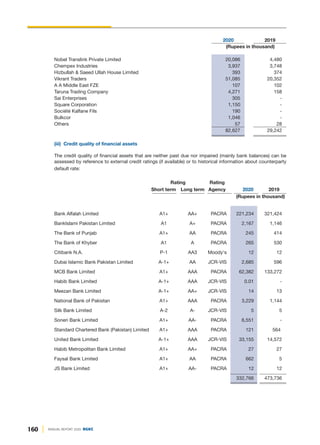
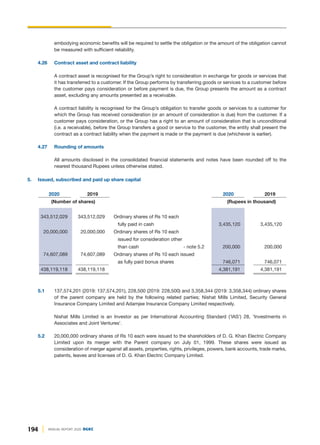
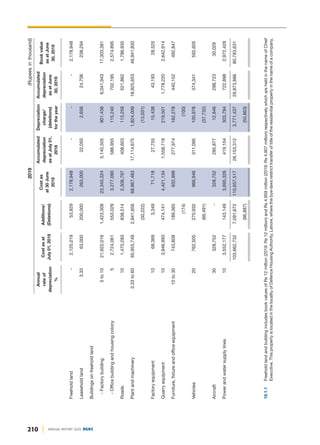
22. Stores, spares and loose tools
Stores [including in transit Rs 16.973 million
(2019: Rs 5.563 million)] 2,512,277 4,603,721
Spare parts [including in transit Rs 281.543 million
(2019: Rs 197.485 million)] 5,890,759 4,788,738
Loose tools 58,766 47,215
8,461,802 9,439,674
22.1 Stores and spares include items which may result in fixed capital expenditure but are not distinguishable.
2020 2019
(Rupees in thousand)
23. Stock-in-trade
Raw materials [including in transit Rs 225.540 million
(2019: Rs 469.870 million)] 933,730 1,677,549
Packing material 355,339 226,316
Animal forage 374,574 286,023
Work-in-process - notes 23.1 & 23.2 3,361,646 2,802,481
Finished goods 470,336 493,693
5,495,625 5,486,062
23.1 Includes clinker costing Rs 263.423 million (2019: Nil) carried at its NRV amounting to Rs 237.15 million
(2019: Nil). The NRV write down expense of Rs 26.272 million (2019: Nil) has been charged to cost of sales.
23.2 Includes clinker having a carrying value of Rs 3,329.582 million (2019: Rs 2,755.69 million), some of which
may be sold in its current state but is not distinguishable.
2020 2019
(Rupees in thousand)
24. Trade debts
Considered good
Secured 2,507,730 1,705,088
Unsecured
- Related parties - note 24.1 19,906 13,468
- Others 744,011 30,274
3,271,647 1,748,830
Loss allowance - note 24.2 (228,657) (70,451)
3,042,990 1,678,379
219
DGKC ANNUAL REPORT 2020](https://image.slidesharecdn.com/dgkhanannualreport-210129133013/85/Dg-khan-annual-report-220-320.jpg)