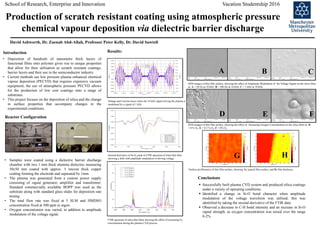
1. SEM images of thin film surface, showing the effect of Increasing Oxygen Concentration on the silica films at: D
= 0 % O2; E = 0.5 % O2; F = 0% O2
SEM images of thin film surface, showing the effect of Amplitude Modulation of the Voltage Signal on the silica films
at: A = 50 Hz at 10 kHz; B = 500 Hz at 10 kHz; C = 1 kHz at 10 kHz
School of Research, Enterprise and Innovation Vacation Studentship 2016
Production of scratch resistant coating using atmospheric pressure
chemical vapour deposition via dielectric barrier discharge
By David Ashworth (Mchem)
• Deposition of hundreds of nanometre thick layers of
functional films onto polymer gives rise to unique properties
that allow for their utilisation as scratch resistant coatings,
barrier layers and their use in the semiconductor industry.
• Current methods use low pressure plasma enhanced chemical
vapour deposition (PECVD) that requires expensive vacuum
equipment, the use of atmospheric pressure PECVD allows
for the production of low cost coatings onto a range of
substrates.
• This project focuses on the deposition of silica and the change
in surface properties that accompany changes in the
experimental conditions.
• Samples were coated using a dielectric barrier discharge
chamber with two 1 mm thick alumina dielectric measuring
50x50 mm coated with approx. 5 micron thick copper
coating forming the electrode and separated by 1mm.
• The plasma was generated from a custom power supply
consisting of signal generator, amplifier and transformer.
Standard commercially available BOPP was used as the
substrate along with standard glass slides for deposition rate
testing.
• The total flow rate was fixed at 5 SLM and HMDSO
concentration fixed at 500 ppm in argon.
• Oxygen concentration was varied, in addition to amplitude
modulation of the voltage signal.
Successfully built plasma CVD system and produced silica coatings
under a variety of operating conditions.
Identified a change in Si-O bond character when amplitude
modulation of the voltage waveform was utilised, this was
identified by taking the second derivative of the FTIR data.
Observed a decrease in C-H bond intensity and an increase in Si-O
signal strength, as oxygen concentration was raised over the range
0-2%.
Conclusions
Reactor Configuration
Introduction Results:
A B C
D E F
Voltage and Current traces when the 10 kHz signal driving the plasma is
modulated by a signal of 1 kHz
Second derivative of Si-O2 peak in FTIR spectrum of silica thin film.
showing a shift with amplitude modulation of driving voltage.
FTIR spectrum of silica thin films showing the effect of increasing O2
concentration during the plasma CVD process
David Ashworth, Dr. Zaenab Abd-Allah, Professor Peter Kelly, Dr. David Sawtell
Surface profilometry of thin film surface, showing: G, typical film surface, and H, film thickness.
G H