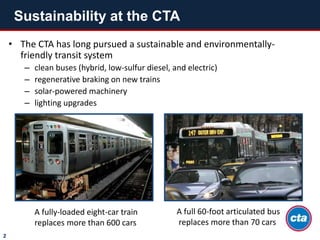
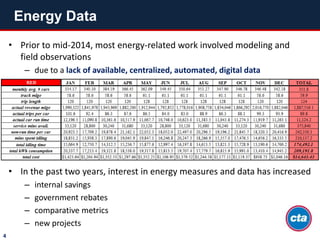
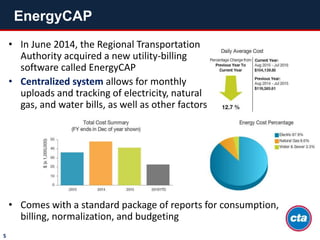
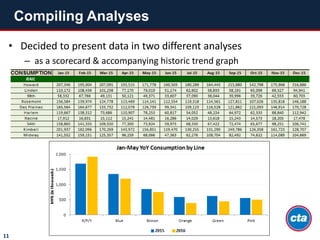
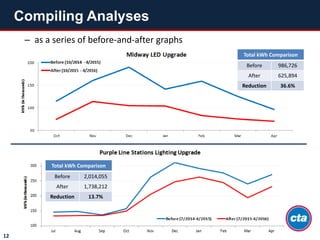
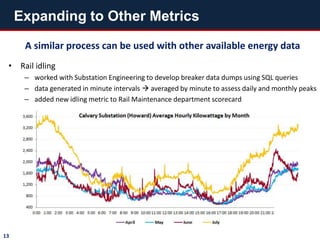
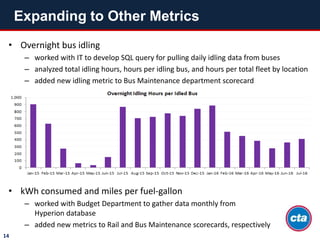
Chicago Transit Authority
DEVELOPING ENERGY
METRICS AT THE
CHICAGO TRANSIT
AUTHORITY
Starting from Scratch:
Navigating and Analyzing
New Energy Data
• The CTA has long pursued a sustainable and environmentally-
friendly transit system
– clean buses (hybrid, low-sulfur diesel, and electric)
– regenerative braking on new trains
– solar-powered machinery
– lighting upgrades
Sustainability at the CTA
2
A fully-loaded eight-car train
replaces more than 600 cars
A full 60-foot articulated bus
replaces more than 70 cars
• In 2015, 6.5% ($94.5M) of the CTA’s $1.4B operating budget went
towards fuel, power, and utility payments
2015 Estimated Energy Consumption
• Energy Consumption by Volume
• If “Energy” were a department at the CTA, it would be the
sixth largest by budget
Diesel
Fuel,
$50M
Electricity
(Traction),
$30M
Electricity
(Non-
Traction),
$10M
Natural
Gas, $5M
Water,
$1M
Energy Budget
3
Commodity Volume
Diesel Gas
(Millions of Gallons)
16.5
Electricity – “L” Trains/
Traction (GWh)
421
Electricity – Other Non-
Traction (Bus, Rail, Admin,
Maintenance) (GWh)
135
Natural Gas (Dekatherms) 640,000
• Utility Costs by Type
• Prior to mid-2014, most energy-related work involved modeling and
field observations
– due to a lack of available, centralized, automated, digital data
• In the past two years, interest in energy measures and data has increased
– internal savings
– government rebates
– comparative metrics
– new projects
Energy Data
4
• In June 2014, the Regional Transportation
Authority acquired a new utility-billing
software called EnergyCAP
• Centralized system allows for monthly
uploads and tracking of electricity, natural
gas, and water bills, as well as other factors
• Comes with a standard package of reports for consumption,
billing, normalization, and budgeting
EnergyCAP
5
• EnergyCAP allows for benchmarking, historical trending, and bill
analysis by location, commodity, and other filters
• Provides monthly data on cost and consumption of each utility at
each location
– includes all facilities, shops, stations, and substations
EnergyCAP
6
Electricity Consumption: Howard Shop
• Backfilling data
– all data prior to EnergyCAP launch had to be uploaded or manually entered in bulk
– created room for data errors , affecting future trending and comparisons
• CTA billed differently for each utility
– electricity: digital, natural gas: paper
– billing schedules and periods vary, making consistent MoM analyses difficult
• Auditing is a slow, collaborative process
– interdepartmental five-person team
dedicated to auditing data for missing
bills, errors, and outliers
– requires continuous back-and-forth
with utility companies
• Too much data!
– 349 reports available…and that’s not
counting all the filter combinations
– bills are granular and difficult to parse
when fixing errors or studying trends
Problems Encountered
7
To develop new metrics, take systematic approach and start small
• Find a “test client”: we used Facilities Maintenance
– department had already been working on energy-savings projects
(e.g. lighting upgrades)
– it had also been gathering its own consumption data
• Pick one or two key problems to solve
– wanted to quantify savings in cost and consumption
– wanted to conduct before-and-after and ROI analyses
• Understand data availability and capabilities
– what data can we confidently provide and study?
– how can we manipulate vast amounts of data to extract
what we need?
From Data to Metrics
8
• Facilities Maintenance wanted to see how completed lighting
upgrades had affected electricity consumption
– this affected their budget estimates and ability to get additional
project funding
– June 2015 - June 2016: the department changed lighting fixtures at 27
stations, 6 shops, and 5 garages – a total of over 10,000 light bulbs
– for the 2017 budget, the department proposed 22 energy-efficiency
projects, at a total operating and capital cost of ~$11.3M
• We decided to calculate total post-project savings to
assess the feasibility of the budget proposal
Picking a Problem
9
before
after
• EnergyCAP provided historical data on electricity consumption
– first, we crosswalked ComEd account information with EnergyCAP
meter names
– next, we pulled monthly data for each meter associated with a location
at which a lighting upgrade had been completed
– then, we had to audit the data by confirming the kilowattage with
original invoices; missing or wrong data had to be fixed in the system
– finally, we associated the data output with the project timeline
in order to assess savings
Gathering Data
10
• Decided to present data in two different analyses
– as a scorecard & accompanying historic trend graph
Compiling Analyses
11
– as a series of before-and-after graphs
Compiling Analyses
12
Total kWh Comparison
Before 2,014,055
After 1,738,212
Reduction 13.7%
Total kWh Comparison
Before 986,726
After 625,894
Reduction 36.6%
A similar process can be used with other available energy data
• Rail idling
– worked with Substation Engineering to develop breaker data dumps using SQL queries
– data generated in minute intervals  averaged by minute to assess daily and monthly peaks
– added new idling metric to Rail Maintenance department scorecard
Expanding to Other Metrics
13
• Overnight bus idling
– worked with IT to develop SQL query for pulling daily idling data from buses
– analyzed total idling hours, hours per idling bus, and hours per total fleet by location
– added new idling metric to Bus Maintenance department scorecard
• kWh consumed and miles per fuel-gallon
– worked with Budget Department to gather data monthly from
Hyperion database
– added new metrics to Rail and Bus Maintenance scorecards, respectively
Expanding to Other Metrics
14
So, why do all this?
• Scorecards, graphs, and analyses allow for trending and YoY analyses
– study seasonal patterns
– determine effects of weather and employee behavior
• Data and metrics can be used for multiple purposes
• Savings!
– 3.6% reduction in cost (> $70k) between Jan.-May 2015 and
Jan.-May 2016 – just for Facilities Maintenance
Summary of Benefits
15
─ internal
 department accountability and
procedural change
 ROI analyses
 budgeting for new energy-
efficiency projects
─ external
 rebate/grant applications
 inter-agency comparison and data
sharing
 APTA Sustainability
Agreement
Next Steps
16
• Continue auditing and analyzing EnergyCAP data
– conduct more year-over-year trending and benchmarking
– develop additional location-specific metrics for other departments
– expand to other utilities
– develop better communication with utility companies to assist in validating data
– delve into greenhouse gas and carbon footprint data
– create better methodology for parsing data and pulling reports
• Continue working with other departments to gather energy-related data
– write new queries for existing databases to harness full power of available data
– add new scorecard metrics for internal use and analysis
– discuss possible energy-efficiency projects and budget impacts
QUESTIONS?
17
CTA’s Sustainability Work
www.transitchicago.com/goinggreen
Sonya Dekhtyar
sdekhtyar@transitchicago.com

Developing Energy Metrics at the Chicago Transit Authority (CTA)

  • 1.
    Chicago Transit Authority DEVELOPINGENERGY METRICS AT THE CHICAGO TRANSIT AUTHORITY Starting from Scratch: Navigating and Analyzing New Energy Data
  • 2.
    • The CTAhas long pursued a sustainable and environmentally- friendly transit system – clean buses (hybrid, low-sulfur diesel, and electric) – regenerative braking on new trains – solar-powered machinery – lighting upgrades Sustainability at the CTA 2 A fully-loaded eight-car train replaces more than 600 cars A full 60-foot articulated bus replaces more than 70 cars
  • 3.
    • In 2015,6.5% ($94.5M) of the CTA’s $1.4B operating budget went towards fuel, power, and utility payments 2015 Estimated Energy Consumption • Energy Consumption by Volume • If “Energy” were a department at the CTA, it would be the sixth largest by budget Diesel Fuel, $50M Electricity (Traction), $30M Electricity (Non- Traction), $10M Natural Gas, $5M Water, $1M Energy Budget 3 Commodity Volume Diesel Gas (Millions of Gallons) 16.5 Electricity – “L” Trains/ Traction (GWh) 421 Electricity – Other Non- Traction (Bus, Rail, Admin, Maintenance) (GWh) 135 Natural Gas (Dekatherms) 640,000 • Utility Costs by Type
  • 4.
    • Prior tomid-2014, most energy-related work involved modeling and field observations – due to a lack of available, centralized, automated, digital data • In the past two years, interest in energy measures and data has increased – internal savings – government rebates – comparative metrics – new projects Energy Data 4
  • 5.
    • In June2014, the Regional Transportation Authority acquired a new utility-billing software called EnergyCAP • Centralized system allows for monthly uploads and tracking of electricity, natural gas, and water bills, as well as other factors • Comes with a standard package of reports for consumption, billing, normalization, and budgeting EnergyCAP 5
  • 6.
    • EnergyCAP allowsfor benchmarking, historical trending, and bill analysis by location, commodity, and other filters • Provides monthly data on cost and consumption of each utility at each location – includes all facilities, shops, stations, and substations EnergyCAP 6 Electricity Consumption: Howard Shop
  • 7.
    • Backfilling data –all data prior to EnergyCAP launch had to be uploaded or manually entered in bulk – created room for data errors , affecting future trending and comparisons • CTA billed differently for each utility – electricity: digital, natural gas: paper – billing schedules and periods vary, making consistent MoM analyses difficult • Auditing is a slow, collaborative process – interdepartmental five-person team dedicated to auditing data for missing bills, errors, and outliers – requires continuous back-and-forth with utility companies • Too much data! – 349 reports available…and that’s not counting all the filter combinations – bills are granular and difficult to parse when fixing errors or studying trends Problems Encountered 7
  • 8.
    To develop newmetrics, take systematic approach and start small • Find a “test client”: we used Facilities Maintenance – department had already been working on energy-savings projects (e.g. lighting upgrades) – it had also been gathering its own consumption data • Pick one or two key problems to solve – wanted to quantify savings in cost and consumption – wanted to conduct before-and-after and ROI analyses • Understand data availability and capabilities – what data can we confidently provide and study? – how can we manipulate vast amounts of data to extract what we need? From Data to Metrics 8
  • 9.
    • Facilities Maintenancewanted to see how completed lighting upgrades had affected electricity consumption – this affected their budget estimates and ability to get additional project funding – June 2015 - June 2016: the department changed lighting fixtures at 27 stations, 6 shops, and 5 garages – a total of over 10,000 light bulbs – for the 2017 budget, the department proposed 22 energy-efficiency projects, at a total operating and capital cost of ~$11.3M • We decided to calculate total post-project savings to assess the feasibility of the budget proposal Picking a Problem 9 before after
  • 10.
    • EnergyCAP providedhistorical data on electricity consumption – first, we crosswalked ComEd account information with EnergyCAP meter names – next, we pulled monthly data for each meter associated with a location at which a lighting upgrade had been completed – then, we had to audit the data by confirming the kilowattage with original invoices; missing or wrong data had to be fixed in the system – finally, we associated the data output with the project timeline in order to assess savings Gathering Data 10
  • 11.
    • Decided topresent data in two different analyses – as a scorecard & accompanying historic trend graph Compiling Analyses 11
  • 12.
    – as aseries of before-and-after graphs Compiling Analyses 12 Total kWh Comparison Before 2,014,055 After 1,738,212 Reduction 13.7% Total kWh Comparison Before 986,726 After 625,894 Reduction 36.6%
  • 13.
    A similar processcan be used with other available energy data • Rail idling – worked with Substation Engineering to develop breaker data dumps using SQL queries – data generated in minute intervals  averaged by minute to assess daily and monthly peaks – added new idling metric to Rail Maintenance department scorecard Expanding to Other Metrics 13
  • 14.
    • Overnight busidling – worked with IT to develop SQL query for pulling daily idling data from buses – analyzed total idling hours, hours per idling bus, and hours per total fleet by location – added new idling metric to Bus Maintenance department scorecard • kWh consumed and miles per fuel-gallon – worked with Budget Department to gather data monthly from Hyperion database – added new metrics to Rail and Bus Maintenance scorecards, respectively Expanding to Other Metrics 14
  • 15.
    So, why doall this? • Scorecards, graphs, and analyses allow for trending and YoY analyses – study seasonal patterns – determine effects of weather and employee behavior • Data and metrics can be used for multiple purposes • Savings! – 3.6% reduction in cost (> $70k) between Jan.-May 2015 and Jan.-May 2016 – just for Facilities Maintenance Summary of Benefits 15 ─ internal  department accountability and procedural change  ROI analyses  budgeting for new energy- efficiency projects ─ external  rebate/grant applications  inter-agency comparison and data sharing  APTA Sustainability Agreement
  • 16.
    Next Steps 16 • Continueauditing and analyzing EnergyCAP data – conduct more year-over-year trending and benchmarking – develop additional location-specific metrics for other departments – expand to other utilities – develop better communication with utility companies to assist in validating data – delve into greenhouse gas and carbon footprint data – create better methodology for parsing data and pulling reports • Continue working with other departments to gather energy-related data – write new queries for existing databases to harness full power of available data – add new scorecard metrics for internal use and analysis – discuss possible energy-efficiency projects and budget impacts
  • 17.