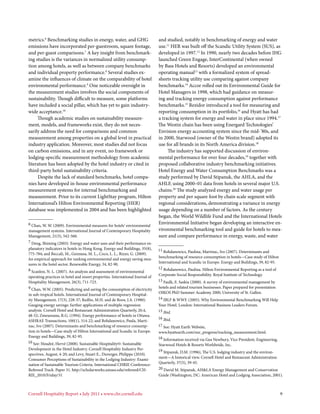
Developing a Sustainability Measurement
              Framework for Hotels:
             Toward an Industry-wide Reporting Structure


Cornell Hospitality Report
Vol. 11, No. 13, July 2011


by Eric Ricaurte


                                                www.chr.cornell.edu
Advisory Board


Niklas Andréen, Group Vice President Global Hospitality & Partner
  Marketing, Travelport GDS
Ra’anan Ben-Zur, Chief Executive Officer, French Quarter
  Holdings, Inc.
Scott Berman, Principal, Real Estate Business Advisory Services,
  Industry Leader, Hospitality & Leisure, PricewaterhouseCoopers
Raymond Bickson, Managing Director and Chief Executive Officer,
  Taj Group of Hotels, Resorts, and Palaces
Stephen C. Brandman, Co-Owner, Thompson Hotels, Inc.
Raj Chandnani, Vice President, Director of Strategy, WATG
Benjamin J. “Patrick” Denihan, Chief Executive Officer,
  Denihan Hospitality Group
Brian Ferguson, Vice President, Supply Strategy and Analysis,
  Expedia North America
Chuck Floyd, Chief Operating Officer–North America, Hyatt
Gregg Gilman, Partner, Co-Chair, Employment Practices,
  Davis & Gilbert LLP
Tim Gordon, Senior Vice President, Hotels, priceline.com
                                                                     The Robert A. and Jan M. Beck Center at Cornell University
Susan Helstab, EVP Corporate Marketing,
                                                                       Back cover photo by permission of The Cornellian and Jeff Wang.
  Four Seasons Hotels and Resorts
Jeffrey A. Horwitz, Chair, Lodging + Gaming, and Co-Head,
  Mergers + Acquisitions, Proskauer
Kevin J. Jacobs, Senior Vice President, Corporate Strategy &
  Treasurer, Hilton Worldwide
Kenneth Kahn, President/Owner, LRP Publications
Kirk Kinsell, President of Europe, Middle East, and Africa,
  InterContinental Hotels Group
                                                                      Cornell Hospitality Reports,
Radhika Kulkarni, Ph.D., VP of Advanced Analytics R&D,
  SAS Institute                                                       Vol. 11, No. 13 (July 2011)
Gerald Lawless, Executive Chairman, Jumeirah Group
Mark V. Lomanno, CEO, Smith Travel Research                           © 2011 Cornell University. This report may
                                                                      not be reproduced or distributed without
Betsy MacDonald, Managing Director, HVS Global Hospitality
  Services                                                            the express permission of the publisher.
David Meltzer, Senior Vice President, Global Business
  Development, Sabre Hospitality Solutions                            Cornell Hospitality Report is produced for
William F. Minnock III, Senior Vice President, Global Operations      the benefit of the hospitality industry by
  Deployment and Program Management,                                  The Center for Hospitality Research at
  Marriott International, Inc.                                        Cornell University
Mike Montanari, VP, Strategic Accounts, Sales - Sales
  Management, Schneider Electric North America
                                                                      Rohit Verma, Executive Director
Shane O’Flaherty, President and CEO, Forbes Travel Guide              Jennifer Macera, Associate Director
Thomas Parham, Senior Vice President and General Manager,             Glenn Withiam, Director of Publications
  Philips Hospitality Americas
Chris Proulx, CEO, eCornell & Executive Education
                                                                      Center for Hospitality Research
Carolyn D. Richmond, Partner, Hospitality Practice, Fox Rothschild    Cornell University
  LLP
                                                                      School of Hotel Administration
Steve Russell, Chief People Officer, Senior VP, Human Resources,
  McDonald’s USA                                                      489 Statler Hall
Michele Sarkisian, Senior Vice President, Maritz                      Ithaca, NY 14853
Janice L. Schnabel, Managing Director and Gaming Practice
  Leader, Marsh’s Hospitality and Gaming Practice                     Phone: 607-255-9780
Trip Schneck, President and Co-Founder, TIG Global LLC                Fax: 607-254-2922
K. Vijayaraghavan (Vijay), Chief Executive, Sathguru                  www.chr.cornell.edu
  Management Consultants (P) Ltd.
Adam Weissenberg, Vice Chairman, and U.S. Tourism, Hospitality
  & Leisure Leader, Deloitte & Touche USA LLP
Thank you to our generous Corporate Members
    ASAE Foundation
    Carlson Hotels
    Hilton Worldwide
    McDonald’s USA
    Philips Hospitality
    SAS
    STR
    Taj Hotels Resorts and Palaces
    TIG Global
    Partners
    Davis & Gilbert LLP
    Deloitte & Touche USA LLP
    Denihan Hospitality Group
    eCornell & Executive Education
    Expedia, Inc.
    Forbes Travel Guide
    Four Seasons Hotels and Resorts
    Fox Rothschild LLP
    French Quarter Holdings, Inc.
    HVS
    Hyatt
    InterContinental Hotels Group
    Jumeirah Group
    LRP Publications
    Marriott International, Inc.
    Marsh’s Hospitality Practice
    Maritz
    priceline.com
    PricewaterhouseCoopers
    Proskauer
    Sathguru Management Consultants (P) Ltd.
    Sabre Hospitality Solutions
    Schneider Electric
    Thayer Lodging Group
    Thompson Hotels
    Travelport

Friends
Berkshire Healthcare • Center for Advanced Retail Technology • Cruise Industry News • DK Shifflet & Associates
• ehotelier.com • EyeforTravel • 4Hoteliers.com • Gerencia de Hoteles & Restaurantes • Global Hospitality
Resources • Hospitality Financial and Technological Professionals • hospitalityInside.com • hospitalitynet.org •
Hospitality Technology Magazine • Hotel Asia Pacific • Hotel China • HotelExecutive.com • International CHRIE
• International Hotel Conference • International Society of Hospitality Consultants • iPerceptions • JDA Software
Group, Inc. • J.D. Power and Associates • The Lodging Conference • Lodging Hospitality • Lodging Magazine
• LRA Worldwide, Inc. • Milestone Internet Marketing • MindFolio • Mindshare Technologies • PhoCusWright
Inc. • PKF Hospitality Research • Resort and Recreation Magazine • The Resort Trades • RestaurantEdge.com •
Shibata Publishing Co. • Synovate • The TravelCom Network • Travel + Hospitality Group • UniFocus • USA Today
• WageWatch, Inc. • The Wall Street Journal • WIWIH.COM • Wyndham Worldwide
Developing a
Sustainability
Measurement
Framework for Hotels:
     Toward an Industry-wide Reporting Structure
                                                                                                           by Eric Ricaurte


About the Author


Eric Ricaurte works to advance sustainability by helping the world’s leading global hospitality companies measure and report on key issues
of corporate responsibility and sustainability (eer3@cornell.edu). He adds this to his 10 years of experience in operations and consulting for
                               hotels, hospitality vendors, tourism operators, attractions, and tourism boards in Latin America. Eric is actively
                               involved as a speaker, roundtable organizer, and writer in the topic of sustainability within the hotel industry.
                               His work includes the first hotel property GRI sustainability report and the first hotel report following the
                               Global Sustainable Tourism Criteria. Eric’s research focuses on standardizing sustainability measurement within
                               hospitality and tourism, beginning as a finalist in the Hotel School’s student research competition in 2001 for
                               his paper titled, “Carbon sequestration, offsetting, and trading, and their relation to travel and tourism.” Eric
                               holds a Bachelor of Science from the Cornell School of Hotel Administration and is a candidate for a Master of
                               Science degree in Tourism Management from New York University.


4	                                                                                   The Center for Hospitality Research • Cornell University
Executive Summary


W                    hat is the carbon footprint of my hotel stay? Surprisingly, each global lodging
                     company currently provides the answer to this question in a different format,
                     inhibiting aggregate corporate or event travel carbon footprinting and comparison.
                     Third parties have attempted to help answer this question uniformly but their
proposals have not gained traction, and no single method for calculation has been widely adopted.
  The need for uniform carbon footprint calculation of a hotel stay is paramount, yet it is not the only sustainability
performance metric. Other issues such as energy, water, and waste are also at the forefront of stakeholder requests
and manifested through sustainability reporting and certifications.
  The emergence of such questions, combined with the global trends of sustainable development and corporate
responsibility, point toward a broader need for addressing non-financial performance data collectively and
uniformly within the hotel industry. In response to requests from guests, investors, and other stakeholders
regarding sustainability, most hotel companies have developed platforms to address these needs. Despite this
promising development, the individual chains’ reports, assumptions, and measures are not always communicated
uniformly—although it’s clear that stakeholders seek to use the data to make comparisons.
  Taking a historical context for sustainability measurement within the industry and globally, this report presents
a conceptual framework for developing sustainability performance indicators to address present stakeholder
requests, as well as others that may arise. The framework developed and tested in this report is designed to
provide an avenue for industry collaboration and discussion toward a uniform set of metrics that are highly
practical in application. The framework is tested using actual 2010 data from 20 hotels operated by InterContinental
Hotels Group, Marriott International, or Wyndham Worldwide, all of which assisted with data collection. The
study applied the framework seeking to evaluate the boundaries, quantification methods, and metrics for
performance indicators of carbon, energy, water, and waste derived from hotel stays, which currently are the
most common requests from external stakeholders. In addition, the practicality of data collection was considered
as currently practiced.
  Based on the study’s methods and results as an example, standard metrics are certainly feasible, yet several
issues required for collaborative industry agreement remain. Hotels will need to agree on boundary specifications
such as addressing differences in laundry wash handling, the quantification of values such as which emission
factors to use and how to allocate rooms versus function space footprints, and the metrics utilized such as per
occupied room or per available room.
  Further issues to enable comparability are discussed. No one catch-all industry benchmark will adequately
represent the environmental footprint of hotel stays. Normalization based on amenities or outlets, climate zones,
and chain scale segment can help various stakeholders understand the complexity of hotel footprinting, provided
that industry collaboration coincides with the proprietary sustainability systems lodging companies are
developing internally.


Cornell Hospitality Report • July 2011 • www.chr.cornell.edu  	                                                      5
COrnell Hospitality Report


Developing a Sustainability
Measurement Framework for
Hotels:
                                          Toward an Industry-wide Reporting Structure
                                                                                                                   by Eric Ricaurte

       “The race to shape sustainability standards will transform the competitive landscape and the social and environmental practices
        of companies in every industry.”*

Foreword
In 2009, Professor David Sherwyn, former academic director of the Center for Hospitality Research, responded to a stated hospitalty industry need to
address sustainability issues. Working with Eric Ricaurte and other industry participants, Professor Sherwyn organized the first CHR Sustainability
Roundtable. We received a extremely positive feedback from the roundtable participants along with the recommendation that CHR should regularly
organize sustainability roundtables and undertake research projects to explore different aspects of this complex topic. CHR has also issued a
sustainability white paper.

During the Cornell Hospitality Research Summit (October 2010) and the second Sustainability Roundtable (November 2010) a diverse group of
industry leaders expressed the need for consistent reporting standards for sustainability. Consequently, CHR commissioned a study for which Eric
Ricaurte took the lead, with the guidance and assistance of David Jerome, senior vice president of corporate responsibility for InterContinental Hotels
Group, Faith Taylor, vice president of sustainability and innovation for Wyndham Worldwide, and Paul Hildreth, director, engineering & facilities
management, Marriott International. This study is part of a continuing research effort by CHR on topics related to sustainability, which includes a
study supported by Philips Hospitality a CHR Senior Partner, another study supported by PKF Consulting, a CHR Friend, and an ongoing study
supported by Schneider Electric, a CHR Partner.

We look forward to your continued support and feedback as we continue follow-up research projects on sustainability and other topics of interest
and relevance to the industry.

Sincerely,

Rohit Verma, Ph.D., Professor, Service Operations Management
Executive Director, Center for Hospitality Research
School of Hotel Administration, Cornell University


  *Gregory Unruh and Richard Ettenson, “Winning in the Green Frenzy,” Harvard Business Review, November 2010,  pp. 110-116.


6	                                                                                      The Center for Hospitality Research • Cornell University
T              he genesis of this paper is the clear need for an industry-wide framework that allows for
              uniform measurement of the sustainability performance between individual hotel
               properties and among their parent chains. Hotel companies are well aware of their
               stakeholders’ interest in the carbon footprint and other aspects of a hotel’s operation,
whether that interest stems from their own environmental footprinting, plans to use the hotel’s services,
or interest in investing in the property. To that end, most hotel companies have developed their own
framework for measuring and communicating environmental footprints and reporting on sustainability.
However, as I explain in this paper, the industry lacks a common ground that allows for comparison
across hotels and chains. This paper seeks to provide the catalyst for cooperative discourse across the
industry to provide a comprehensive measurement scheme that will be at once comprehensive, practical,
and intuitive. In outlining and demonstrating the boundaries for such a common comparison
framework, I emphasize the need for industry-wide cooperation in establishing a sustainability measure.


     Nearly every contemporary examination or discussion           companies have integral and complex relationships with
of sustainability involves some form of performance mea-           the stakeholders who define their existence has gained
surement and metrics. At the global level, the concept of          much ground over the past 30 years since such models
ecosystem services is taking hold and framing the context of       arose.2 Stakeholder groups are diverse, but sustainability
GHG emissions mitigation as one component of Payments for          performance requests from clients and investors in particu-
Ecosystem Services (PES). Within business, seminal works           lar are driving the need for uniform measurement.
such as “The Economics of Ecosystems and Biodiversity”1 are             As with other industries, hotels are being asked by
being used to explore measurable relationships between hu-         casual guests and corporate clients alike to quantify the
mans and the natural environment. Stock exchanges can trade        environmental impact of their stay, often in terms of the
sustainability indexes, and investment rating systems now          carbon footprint of a room-night and the related consump-
include “intangible value” and environmental, social, and gov-     tion of energy, water, and waste. Similarly, investors request
ernance (ESG) disclosures. The top global companies provide        the same information from hotel companies. Consequently,
annual sustainability reports using a number of non-financial      hotels are among the many companies that produce
performance indicators around a framework resembling the           sustainability reports that include ESG disclosure. In so
triple bottom line, and some companies provide sustainability      doing, however, hotels typically provide the information in
reports to international bodies to quantify and measure risks      diverse formats making it difficult for the client or stake-
associated with the driving causes of sustainability’s call. Ad-   holder to roll up the data or compare different operations
ditionally, investors and clients are asking for precise mea-      in any meaningful way. Second, different stakeholders’
sures of a company’s sustainability performance, often right       sustainability requests encompass a multitude of issues, im-
down to the product level, to provide an understanding of the      pacts, and measurements which can only escalate as more
environmental footprint of goods and services. Similarly, sup-     stakeholders ask more frequent and more diverse questions.
ply chain initiatives and indexes have companies asking each       For these and other reasons, any standardization of the
other for measurable performance data, and consortiums and         calculation of the environmental footprint of a hotel stay
working groups are collaborating to define how the envi-           needs to fit a framework that will satisfy not only today’s
ronmental impacts of goods and services may be quantified,         questions, but the questions of tomorrow as well.
measured, and communicated in labeling and procurement.                 The hotel industry has no commonly accepted guide-
These are the so-called “scope 3” impacts that extend beyond       line for disclosing standardized sustainability information
immediate operational data.                                        to allow for comparison among properties and companies.
     Parallel to the emergence of environmental footprinting
is the attention paid to engaging stakeholders. The theory that    2 See: Donaldson, Thomas and Lee E. Preston. “The Stakeholder Theory
                                                                   of the Corporation: Concepts, Evidence, and Implications.” Academy of
1 See: www.teebweb.org/.                                           Management Review 20.1 (1995): 65-91


Cornell Hospitality Report • July 2011 • www.chr.cornell.edu  	                                                                        7
That vacuum may well be filled by measurement standards                   ing to the percentage of an item or specification found at the
and guidelines developed by third parties with a focus that is            property.
not hotel-specific, and which did not engage hotel compa-                      Consumption (usage). The familiar metrics of utility
nies themselves as stakeholders in defining the methods.                  use, consumption of goods and supplies, and generation of
This study aims to serve the hotel industry’s need for a                  waste or discarded materials can be measured directly, or
practical conceptual framework for measuring the material                 indirectly according to the percentage of the different types
aspects of sustainability within hotel operations. In doing               of consumption.
so this study attempts to advance the body of knowledge in                     Impacts. A typical impact measure is carbon footprint
sustainability by developing transparent and clear methods                (typically, greenhouse gas emissions), and this category
of measuring the most material impacts from hotel opera-                  includes other impacts on people or the Earth and its ecosys-
tions. Hotels, hotel companies, and industry associations                 tem services. Impacts are measurable through characteriza-
will be able to immediately use this framework to build data              tion and normalization, and derived from consumption.
sets and discuss common acceptance in the immediate areas                      Although I specify five measurement categories, I must
of requests. Furthermore, the framework may be expanded                   note that the policies, processes, and specifications are often
to include other performance indicators and more in-depth                 measured, but they are usually introduced with the intention
parameters for the ones currently examined by using its                   of reducing consumption and impacts. So a property may
points of discussion.                                                     have a policy containing showerhead flow rate specifica-
                                                                          tions or lighting wattage which are measured as criteria for
Where the Industry Stands
                                                                          reducing energy and water consumption (and in turn carbon
Before discussing the measurement framework, I exam-                      emissions as an impact). Similarly, specification of the per-
ine the present state of hotel sustainability measurement                 centage of FF&E, materials, and supplies with VOCs, toxic,
as found in the academic literature; industry initiatives;                or non-biodegradable ingredients serves to reduce impacts
sustainability certifications, criteria, and guidelines; hotel            on environmental health and safety.
sustainability reporting; and available third-party resources.
     My review of existing material identified the following              Measurement in Historical Context
five general categories of sustainability measurement relating            Hotels have long been monitoring and measuring items
to hotel operations: policies, processes, specifications, con-            now associated with sustainability, and it would be highly
sumption (usage), and impacts.3                                           inaccurate to insinuate that sustainability performance mea-
     Policies. Whether a hotel has written policies address-              surement in the hotel industry is a new concept. The hotel
ing specific issues is often measured in a yes-or-no checklist            industry has been measuring, benchmarking, and improving
format, for example, the presence or absence of a policy                  performance in areas such as energy, waste, water, indoor
regarding sustainable purchasing. The policy may stipulate                air quality, noise, and contaminants for nearly 100 years that
specific weighting of factors in decision making, provi-                  we know of.4 Hoteliers did not need environmental groups
sions for meeting and updating the criteria, and evaluating               or climate change to work on improving energy efficiency.
vendors.                                                                  As just one example, ROI analysis of fluorescent light bulb
     Processes. The performance of managerial or behavior-                change-out is decades old, and original studies had to take
al processes is often measured, for example by recording that             into consideration the cost of changing the ballast to accom-
the green team met at least once a month over a calendar                  modate a fluorescent.
year. Staff training statistics could be tallied, and records                  Academic studies to measure sustainability in hospitali-
kept for practices such as toilet and faucet revision, lighting           ty have addressed energy, water, waste, air quality,5 and more
procedures, or waste separation.                                          recently GHG emissions. Evaluations of hotel performance
      Specifications. Also termed technical as a component                also have used the ISO 14001 standard to examine energy,
of measurement, these criteria are most commonly found                    waste, and water consumption, applying per-occupied-room
as specifications of FF&E or building design. Wide-ranging
specifications might include faucet flow rates, efficiency of
lighting, and chemical composition of materials. Specifica-
                                                                          4 D.M. Stipanuk, “The U.S. Lodging Industry and the Environment—A
tions are rated according to a yes-or-no checklist, or accord-
                                                                          Historical View, Cornell Hotel and Restaurant Administration Quarterly,
                                                                          Vol. 37, No. 5 (1996), pp. 39-45.
                                                                          5 Bohdanowicz, Paulina, and Martinac, Ivo (2007). Determinants and
3 Some components adapted from: Eric Ricaurte, “A Guide to Measur-        benchmarking of resource consumption in hotels—Case study of Hilton
ing Sustainability,” Hotel Sustainable Development: Principles and Best   International and Scandic in Europe. Energy and Buildings, 39, 82-95;
Practices, ed. A.J. Singh and Hervé Houdré (Washington, DC: AHLA          and L.A. Jackson, (2010). Toward a framework for the components of
Educational Institute, 2011).                                             green lodging. Journal of Retail and Leisure Property, 9(3), 211-230.


8	                                                                                  The Center for Hospitality Research • Cornell University
metrics.6 Benchmarking studies in energy, water, and GHG                       and studied, notably in benchmarking of energy and water
emissions have incorporated per-guestroom, square footage,                     use.11 HER was built off the Scandic Utility System (SUS), as
and per-guest comparisons.7 A key insight from benchmark-                      developed in 1997.12 In 1990, nearly two decades before IHG
ing studies is the variances in normalized utility consump-                    launched Green Engage, InterContinental (when owned
tion among hotels, as well as between company benchmarks                       by Bass Hotels and Resorts) developed an environmental
and individual property performance.8 Several studies ex-                      operating manual13 with a formalized system of spread-
amine the influences of climate on the comparability of hotel                  sheets tracking utility use comparing against company
environmental performance.9 One noticeable oversight in                        benchmarks.14 Accor rolled out its Environmental Guide for
the measurement studies involves the social components of                      Hotel Managers in 1998, which had guidance on measur-
sustainability. Though difficult to measure, some platforms                    ing and tracking energy consumption against performance
have included a social pillar, which has yet to gain industry-                 benchmarks.15 Rezidor introduced a tool for measuring and
wide acceptance.10                                                             reporting consumption in its portfolio,16 and Hyatt has had
     Though academic studies on sustainability measure-                        a tracking system for energy and water in place since 1994.17
ment, models, and frameworks exist, they do not neces-                         The Westin chain has been using Energard Technologies’
sarily address the need for comparisons and common                             Envision energy accounting system since the mid-’80s, and
measurement among properties on a global level in practical                    in 2000, Starwood (owner of the Westin brand) adopted its
industry application. Moreover, most studies did not focus                     use for all brands in its North America division.18
on carbon emissions, and in any event, no framework or                              The industry has supported discussion of environ-
lodging-specific measurement methodology from academic                         mental performance for over four decades,19 together with
literature has been adopted by the hotel industry or cited in                  proposed collaborative industry benchmarking initiatives.
third-party hotel sustainability criteria.                                     Hotel Energy and Water Consumption Benchmarks was a
     Despite the lack of standard benchmarks, hotel compa-                     study performed by David Stipanuk, the AHLA, and the
nies have developed in-house environmental performance                         AHLF, using 2000–01 data from hotels in several major U.S.
measurement systems for internal benchmarking and                              chains.20 The study analyzed energy and water usage per
measurement. Prior to its current LightStay program, Hilton                    property and per square foot by chain scale segment with
International’s Hilton Environmental Reporting (HER)                           regional considerations, demonstrating a variance in energy
database was implemented in 2004 and has been highlighted                      usage depending on a number of factors. As the century
                                                                               began, the World Wildlife Fund and the International Hotels
6 Chan, W. W. (2009). Environmental measures for hotels’ environmental         Environmental Initiative began developing an interactive en-
management systems. International Journal of Contemporary Hospitality          vironmental benchmarking tool and guide for hotels to mea-
Management, 21(5), 542-560.                                                    sure and compare performance in energy, waste, and water
7 Deng, Shiming (2003). Energy and water uses and their performance ex-
planatory indicators in hotels in Hong Kong. Energy and Buildings, 35(8),      11 Bohdanowicz, Paulina, Martinac, Ivo (2007). Determinants and
775-784; and Beccali, M., Gennusa, M. L., Coco, L. L., Rizzo, G. (2009).
                                                                               benchmarking of resource consumption in hotels—Case study of Hilton
An empirical approach for ranking environmental and energy saving mea-
                                                                               International and Scandic in Europe. Energy and Buildings, 39, 82-95.
sures in the hotel sector. Renewable Energy, 34, 82-90.
                                                                               12 Bohdanowicz, Paulina. Hilton Environmental Reporting as a tool of
8 Scanlon, N. L. (2007). An analysis and assessment of environmental
                                                                               Corporate Social Responsibility. Royal Institute of Technology.
operating practices in hotel and resort properties. International Journal of
Hospitality Management, 26(3), 711-723.                                        13 Faulk, E. Saskia (2000). A survey of environmental management by
9 Chan, W.W. (2005). Predicting and saving the consumption of electricity      hotels and related tourism businesses. Paper prepared for presentation
                                                                               OIKOS PhD Summer Academy 2000, University of St. Gallen.
in sub-tropical hotels. International Journal of Contemporary Hospital-
ity Management, 17(3), 228-37; Redlin, M.H. and de Roos, J.A. (1980).          14 IBLF & WWF. (2005). Why Environmental Benchmarking Will Help
Gauging energy savings: further applications of multiple-regression            Your Hotel. London: International Business Leaders Forum.
analysis. Cornell Hotel and Restaurant Administration Quarterly, 20.4,         15 Ibid.
48-52; Zmeureanu, R.G. (1994). Energy performance of hotels in Ottawa.
                                                                               16 Ibid.
ASHRAE Transactions, 100(1), 314-22; and Bohdanowicz, Paula, Marti-
nac, Ivo (2007). Determinants and benchmarking of resource consump-            17 See: Hyatt Earth Website,
tion in hotels—Case study of Hilton International and Scandic in Europe.       www.hyattearth.com/our_progress/tracking_measurement.html.
Energy and Buildings, 39, 82-95.                                               18 Information received via Gus Newbury, Vice President, Engineering,
10 See: Houdré, Hervé (2008). Sustainable Hospitality©: Sustainable
                                                                               Starwood Hotels & Resorts Worldwide, Inc.
Development in the Hotel Industry. Cornell Hospitality Industry Per-           19 Stipanuk, D.M. (1996), The U.S. lodging industry and the environ-
spectives, August, 4-20; and Levy, Stuart E., Duverger, Philippe (2010).
                                                                               ment—A historical view. Cornell Hotel and Restaurant Administration
Consumer Perceptions of Sustainability in the Lodging Industry: Exami-
                                                                               Quarterly, 37(5), 39-45.
nation of Sustainable Tourism Criteria. International CHRIE Conference-
Refereed Track. Paper 31. http://scholarworks.umass.edu/refereed/CH-           20 David M. Stipanuk, AH&LA Energy Management and Conservation
RIE_2010/Friday/31                                                             Guide (Washington, DC: American Hotel and Lodging Association, 2001).


Cornell Hospitality Report • July 2011 • www.chr.cornell.edu  	                                                                                         9
Exhibit 1

 Common performance indicators in lodging firms’ Global Reporting Initiative

                                                                  • Programs related to training and professional development (LA11)
 All 9 reports disclosed qualitative information on:
                                                                  • Initiatives to reduce GHG emissions (EN18)
                                                                  • Energy consumption (EN3 or EN4)
                                                                  • (Some form of) initiatives to reduce energy consumption and the reductions
                                                                  achieved (EN5 or EN6)
 8 of 9 reports disclosed performance on:
                                                                  • Water usage or withdrawal (EN8)
                                                                  • Composition of the organization’s governance bodies and breakdown of
                                                                  labor force by indicators of diversity (LA13)
                                                                  • Scope 1 and 2 GHG emissions (EN16)
 7 of 9 reports disclosed performance on :                        • The size of their workforce by type (LA1)
                                                                  • Percentages of workforce receiving performance reviews (LA12)


consumption,21 as well as GHG emissions.22 The WWF also                   industry agreement. Within this dialogue, diverse responses
highlighted other potential environmental performance                     to stakeholder requests exist. The two most commonly dis-
indicators for tourism vacation footprinting such as average              cussed approaches, certification and sustainability reporting,
earthshare and consumption of meat.23 Neither the tool nor                were developed outside of the industry and serve some but
the footprinting methods gained traction, however, and the                not all stakeholder requests for sustainability performance.
hotel benchmarking initiative has not been active lately.                 Measures of non-financial performance in hotels have moved
     One substantive change of recent years is that the                   well beyond internal portfolio comparisons and ROI calcula-
terminology for discussing the topics has coalesced. Prior                tions. One primary evolution of measurement has been the
to the 1960s, hotel environmental issues were addressed by                inclusion of carbon emissions as a key performance indicator.
their own individual categories.24 More recently, individual              Like its 1980s’ predecessor, ozone depletion, the global dis-
factors are grouped under the rubric of sustainability, which             cussion on GHG emissions and climate change has urgently
embraces a broad scope of metrics.                                        spotlighted non-financial performance indicators on a global
                                                                          scale, to the point where the entire world now has a collective
Shifting Drivers of Measurement
                                                                          performance target of 350 parts per million of CO2 in the
The chief difference in today’s dialogue and measurement                  atmosphere.25
frameworks stems from increased stakeholder requests,
including investors, shareholders, governments at all levels,             Corporate Responsibility and Sustainability
and corporate clients and other organizations. Questions                  Reporting
relating to measurements of environmental and social                      In response to stakeholder requests, in 2008 and 2009 all of
aspects have proliferated in RFPs to hotels at both property              the top 100 U.S. companies by revenue, and 80 percent of
and corporate levels.                                                     the Global Fortune 250 companies produced sustainability
     These concerns underscore the hotel industry’s need                  reports disclosing ESG performance, based on the Global
to adopt a uniform approach to measuring and quantify-                    Reporting Initiative (GRI).26 This GRI content is developed
ing the various aspects of sustainability, and communicate                based on stakeholders’ requests.
them to stakeholders. In some cases the measurement                            Specific to the topic of climate change and GHG emis-
methodology is dictated, but others require collaborative                 sions, the Carbon Disclosure Project (CDP) surveyed 3,000
                                                                          organizations worldwide,27 and added questions regarding
21 Dodds, Rachel. Why Environmental Benchmarking will help your
hotel. London, UK: The Prince of Wales International Business Leaders
Forum (IBLF), 2005.                                                       25 For more information see www.350.org.
22 See: www.benchmarkhotel.com, which is no longer in use by the          26 Brown-Smatlan, A. & Sparks A. (2010, May 12). The Evolution of
organizations mentioned.                                                  Greenhouse Gas Reporting by Business: Addressing Product and Supply
23 WWF-UK Business and Consumption Unit (2002). Holiday Foot-             Chain Emissions. Presentation through KPMG & WBCSD. Los Angeles &
printing: A Practical Tool for Responsible Tourism. WWF-UK.               Geneva.
24 Ibid.                                                                  27 Carbon Disclosure Project. (2011). CDP: What we do. Retrieved April
                                                                          14, 2011, from https://www.cdproject.net/en-US/WhatWeDo/Pages/over-
                                                                          view.aspx.

10	                                                                                  The Center for Hospitality Research • Cornell University
Exhibit 2

 Presence of measurement criteria in hotel certifications and guidelines

                                                                 Waste                                   Toxicity /
                                                               Generation                Food and     Biodegradability
                     GHG            Energy         Water          and        Materials   Beverage       of Cleaning         Guest
    Criteria       Emissions        Usage          Usage        Disposal    Purchasing     items          Supplies       Satisfaction
     GSTC                                                                                                                
  Green Key                                                                                             
 Green Seal                                                                
  (GS-33)
  LEED (EB):                                                                           
    O&M
    AHLA                                                          
                                              = Directly stated;  = Implied or precursor
water use in 2010, similar to carbon reporting. As of 2009              its own methodology, and the criteria for these schemes are
approximately nine global hotel companies produced GRI                  generally transparent and publicly available.
reports and six had responded to a CDP questionnaire. As                     One outcome of the industry’s interest in certification
shown in the evaluation in Exhibit 1 (previous page), these             is apparent in the establishment of the Global Sustainable
nine hotel GRI reports typically involved the following per-            Tourism Criteria (GSTC) and its initial objectives of helping
formance indicators:28 energy consumption and reduction,                to harmonize tourism sustainability certification platforms.
water use, and diversity indicators. In addition, although              The GSTC stipulates that tourism businesses should measure
only five reports disclosed performance on total waste                  their guest satisfaction, purchases of disposable and con-
(EN22), all reports contained sections on waste minimiza-               sumable goods, energy consumption, water consumption,
tion with some form of localized or per-unit waste data.                and GHG emissions, as well as non-diverted waste. While
Most noteworthy in my evaluation of GRI reports is the lack             the GSTC takes into account the broad range of tourism
of standardization in reporting. For example, intensity of us-          businesses, it does not, however, specify instructions on
age, when disclosed, can be found in values per square meter,           how the boundaries of measurement or the metrics will be
per guest night, per occupied room, per room-night, and                 delineated in each sector. Although the GSTC aims to be a
per hotel, without specific definitions of what exactly the de-         framework for use by many stakeholders including certifica-
nominators represent. Furthermore, specific documentation               tion bodies, it does not delve into technical specifications
is lacking on what resources have been used in calculating              which are needed for standardization of measurement. Nor
GHG emissions, or the emissions factors used in perform-                do the predominant hotel certifications found in the U.S.
ing the calculation. Therefore although two companies may               completely adhere to the GSTC.
declare the same metric, the boundaries of the denominator                   In North America, the three most prevalent certifica-
may differ. For a list of reporting companies and a full break-         tion frameworks in hotels are Green Key, Green Seal, and
down of metrics found in GRI reports, see Appendix A.                   the USGBC’s LEED, modified for use by hotels. In another
                                                                        approach, the American Hotel and Lodging Association de-
Certifications
                                                                        veloped its Green Guidelines as criteria applicable for hotel
Sustainability certifications of various types have proliferated        operations. These most closely resemble the criteria found
in the past two decades. For hotels, the advantage of certifi-          in the dozens of state-level certifications. An analysis finds
cation lies in the certification’s ability to validate the hotel’s      that the certifications and guidelines consistently call for
sustainability efforts and serve as a response to stakeholders’         measurement of consumption or impacts in energy, waste,
sustainability concerns, using one label with which the stake-          water, and GHG emissions, as shown in Exhibit 2. Only four
holder is already familiar. Each certification scheme carries           additional criteria are mentioned as specifically necessitating
28 Evaluation includes Marriott, IHG, Accor, NH, Jumeirah, Sol Meliá,   measurement, albeit not consistently. In addition, internal
Rezidor, Taj, and Hong Kong & Shanghai Hotels. Accor reported ac-       performance measurement as a component of a broad-based
cording to French disclosure requirements and not GRI Framework, but    management platform is also common. Much like the GSTC,
provided a linkage document for its report to the GRI guidelines.       however, specific technical protocols or guidelines for quan-


Cornell Hospitality Report • July 2011 • www.chr.cornell.edu  	                                                                     11
corporate responsibility guidelines. In addition, 35 sector-
 Exhibit 3
                                                                    specific initiatives are listed and cross-evaluated. Travel
 ISO 26000 subjects and practices                                   and tourism is listed as a sector, with only two initiatives
                                                                    mentioned: the ECPAT Code of Conduct and the GSTC. Of
 Core Subjects
                                                                    the 15 core subjects and practices available per ISO 26000,
 Organizational governance                                          ECPAT addresses only three, and GSTC touches on five.
 Human rights                                                            Sustainability certification and sustainability reports
 Labor practices                                                    notwithstanding, the current gap in making an appropri-
                                                                    ate response to stakeholders’ sustainability requests lies in
 The environment
                                                                    providing specific hotel performance data that provides a
 Fair operating practices                                           product-level quantification of an environmental footprint.
 Consumer Issues                                                    Since corporate travel is a driver of GHG emissions and
 Community involvement and development                              other environmental impacts, companies tracking their own
                                                                    environmental footprints are asking hotels for data relating
 Practices                                                          to their hotel stays; meetings and events clients also wish
 Recognizing social responsibility                                  to know the environmental footprint of the rooms and the
 Stakeholder identification and engagement                          event they are booking; and even some transient guests want
                                                                    to know the carbon footprint of their hotel stay.
 The relationship of an organization’s characteristics to social
 responsibility                                                     Performance Measurement
 Understanding the social responsibility of an organization         Although the complexity of variables among hotels can
 Integrating social responsibility throughout an organization       constrain the usefulness of wide-scale benchmarking,29 the
                                                                    industry still needs a uniform measurement scale. This could
 Communication on social responsibility
                                                                    begin with the type of effort that created the GRI, which
 Enhancing credibility regarding social responsibility              provides the opportunity and forum for different industrial
 Reviewing and improving an organization’s actions and practices    sectors to develop sector-specific supplements through col-
 related to social responsibility                                   laborative, transparent, multistakeholder efforts. Fifteen such
 Note: Adapted from ISO 26000                                       supplements have been developed or are in development
                                                                    at present.30 None addresses hotels, and additional sector
                                                                    supplements will not be developed in the near future.
tification are lacking. The only exception is LEED certifica-            The Greenhouse Gas Protocol Corporate Accounting
tion, which specifies measurements by square footage but            and Reporting Standard is the most widely accepted and ref-
not room-nights.                                                    erenced guide for quantifying and reporting GHG emissions,
      Certification criteria do not always match stakeholder        and the corresponding ISO 14064 standard also provides
concerns. First, the multitude of certifications worldwide          guidance on quantification. Both resources are, however,
inhibits the uniformity in criteria that stakeholders seek.         targeted at the organizational level, and a draft of the GHG
Second, certifications do not generally stipulate disclosure        protocol does not specifically spell out how a hotel property
of performance as part of their criteria and thus do not offer      would quantify the carbon footprint of a hotel stay. The
standardized guidance on measurement methods. Finally,              Climate Registry General Reporting Protocol comes much
not all certifications call for measurement of the same per-        closer by providing guidance, quantification methods, and
formance indicators. My examination of certifications found         emissions factors for facility-level reporting. It even gives
them to be relatively narrow within the overall umbrella of         an example of how a hotel chain might quantify the carbon
corporate responsibility and sustainability.                        footprint of the organization,31 but the example is cursory
      By contrast, the comprehensiveness of sustainability          and does not provide comparative metrics at the product
topics can be seen in ISO 26000, which offers guidance on
the subjects and practices for integrating social responsibility,   29 Bohdanowicz, Paulina, and Martinac, Ivo (2007). Determinants and
as shown in Exhibit 3. ISO 26000, however, explicitly states        benchmarking of resource consumption in hotels—Case study of Hilton
that it is a guidance document and not a standard to be used        International and Scandic in Europe. Energy and Buildings, 39, 82-95.
                                                                    30 Global Reporting Initiative. (2011). Sector Supplements. Retrieved
for certification purposes, and nowhere does it mention
hotels. This standard examines 40 separate cross-sectoral           April 14, 2011, from http://www.globalreporting.org/ReportingFrame-
                                                                    work/SectorSupplements/.
initiatives including reporting frameworks and certification
                                                                    31 Climate Registry. (2008). General Reporting Protocol, v 1.1. Los
schemes, evaluating the content of each with regard to its
                                                                    Angeles.


12	                                                                            The Center for Hospitality Research • Cornell University
level. To date, no global chain-affiliated hotel property has           widely available. Portfolio Manager’s national-level focus
reported to the Climate Registry.                                       also makes quantification problematic at global levels. Just
     Because of the cost of energy, businesses of all types             as regional EnergyStar data are adjusted for region in the
have monitored energy use for decades, and consequently                 U.S., comparisons among several nations would require
energy use measurement has seen the best attempts at                    application of some sort of coefficient of adjustment or other
standardization. Most relevant for hotels is the EPA Energy             normalization factors.
Star Portfolio Manager, which may well be the only envi-                      One can use Portfolio Manager to track operational
ronmental performance measurement tool that is relatively               water consumption, but GHG emissions can be calculated
available and used within the hotel sector. Offering a tool to          only by inference. Energy site-source calculations are taken
track and measure energy and water use, Portfolio Man-                  at national averages, but carbon emissions from purchased
ager also calculates GHG emissions for buildings and offers             electricity are taken using emission factors from regional
uniform boundaries and metrics which enable comparisons.                grid characteristics. Even though water is tracked, no
In addition to being utilized as a component of LEED EB                 mention of a similar site-source consideration for a water
certification, Energy Star itself also serves as another type           footprint is mentioned.
of certification available for hotels. Well known in the U.S.                 While we can expect to see more interest in water sus-
in a number of contexts, Energy Star is used by many state              tainability quantification, there is no single standard to date.
and local governments as a platform for disclosing energy               The World Business Council for Sustainable Development
performance of buildings.32                                             (WBCSD) offers a Global Water Tool which enables analysis
     Portfolio Manager provides insight as to some key ele-             of water usage at an organizational level. This tool offers
ments necessary for achieving success as a standard for mea-            metrics developed based on country-specific resources, and
surement. First, it offers a publicly available quantification          it distinguishes among types of water, but it is not product
method which is derived from public data. Second, it offers             specific. The most comprehensive examination of water in a
uniform boundaries and metrics which enable comparisons,                sustainability measurement context is the Water Footprint
with extensive guidance on how the boundaries and metrics               Assessment Manual, which provides a range of guidance and
are set. Both the boundaries and guidance are tailored for              quantification for water footprints at various levels, at all life
different types of facilities, including hotels. Third, it offers a     cycle stages, and for different types of water resources (e.g.,
common, freely available software platform. Finally, it repre-          green water, blue water, and grey water).34
sents an important advancement toward a type of rating or                     Current performance measurement within hospitality is
index for hotel sustainability.                                         widely used for other types of performance indicators, with
     Portfolio Manager also has several distinct limitations            the work of Smith Travel Research as a signal example. The
for application in global hotel sustainability measurement. It          hotel industry is effectively addicted to measuring, track-
was not designed for hotels, it was not designed for global             ing, benchmarking, and utilizing performance indicators of
use, and it was designed only to address energy use. As an              ADR, occupancy, and RevPAR. Each metric comes with a
example of these issues, Portfolio Manager’s metrics are                well-defined and agreed-upon set of boundaries and quan-
rendered per square foot, which can be helpful for building             tification rules that enable comparability. Industry capacity,
operators, but not for would-be guests attempting to account            capability, and willingness to collaborate on performance
for the impact of a room-night. Its calculation methods,                measurement clearly exist, and drawing upon their currently
moreover, did not test occupancy as one of the 32 indepen-              accepted metrics for performance comparison can ease the
dent variables. Though it has robust data in aggregate, its             adoption of sustainability indicators.
rating model was developed using 2003 CBECS data from                        This review of various sustainability rubrics delineates
142 U.S. properties, and was tested with 64 properties.33               the breadth of topics that must be considered for an inte-
     One would not expect that the U.S. EPA would cre-                  grated sustainability measurement. For the lodging industry,
ate an international application, but the fact is that for the          the current lack of standard does not mean that standardiza-
purpose of benchmarking, international hotel data are not               tion attempts do not exist, or that industry discussion and
                                                                        collaboration are not taking place. At a global level industry
32 See: www.energystar.gov/ia/business/government/State_Local_Govts_
Leveraging_ES.pdf.                                                      34 Hoekstra, A. Y., Chapagain, A. K., Aldaya, M. M., Mekonnen, M. M.
33 Environmental Protection Agency (2009, February). Energy Star Per-   (2011). The Water Footprint Assessment Manual: Setting the Global
formance Ratings Technical Methodology for Hotel.                       Standard. Washington, DC: Earthscan.


Cornell Hospitality Report • July 2011 • www.chr.cornell.edu  	                                                                                13
Exhibit 4

 Sustainability measurement framework


roundtables are discussing the topic,35 and working groups                requires a second data entry or interface, which would repre-
for developing standard sustainability performance metrics                sent an extra step for hotel companies.
are currently underway. In addition, third parties have de-                    Despite all the research and development in both aca-
veloped their own quantification methods or benchmarks to                 deme and the industry, no transparent third-party, academic,
provide uniform solutions for carbon footprinting of hotel                or industry method for uniformly measuring and communi-
stays. One goal of such solutions is to provide a calculation             cating the sustainability performance of hotel stays has so far
of the corresponding carbon offsets. Some travel agents, tour             been both clearly defined and widely adopted. At the same
operators, and back-of-house travel services providers also               time, the convergence of increased stakeholder inclusiveness,
provide carbon footprint calculations for travel that includes            technological advances, and global issues relating to sustain-
hotel stays. Sustainability reporting firms also have made                able development and the future well-being of society points
attempts to define methods and produce relevant metrics in                clearly to the need for uniformly measuring and communi-
property-level sustainability reports.36 Finally, opportunistic           cating the most salient performance indicators. Such efforts
carbon firms have attempted to fill the gap in uniformity by              can serve as a roadmap toward standardization of sustain-
offering proprietary quantification methods and indexes.                  ability performance measurement. For example, should a
     Hotel companies have so far been reluctant to adopt                  GRI Hotel Sector Supplement be convened in two years,
third-party solutions due to the lack of transparent and                  the same methods and discussion can be carried forward
industry-engaged boundary and quantification or rating                    to facilitate discussion in a larger context and with a more
methods, the limited scope of sustainability metrics, the                 inclusive approach.
risk of extravagant fees resulting for large chains, and the
                                                                          The Measurement Framework
implausibility of handing over invaluable occupancy data—
and also because they have already invested substantial time              To address the lack of an overall sustainability measurement
and effort into developing their own sustainability software              rubric, I offer the framework presented in Exhibit 4 as a
platforms. Third-party calculation of performance metrics                 means of identifying, refining, and standardizing perfor-
                                                                          mance sustainability indicators both now and in the future.37
35 Sherwyn, David ed. (2010). The Hotel Industry Seeks Elusive “Green
Bullet.” Cornell Hospitality Roundtable Proceedings, 2(1).
36 See: Willard InterContinental Washington, DC, 2007 and 2008 sustain-   37 See: United Nations World Commission on Environment and Develop-
ability reports.                                                          ment. (1987). Our Common Future. Oxford: Oxford University Press.


14	                                                                                The Center for Hospitality Research • Cornell University
Dimensions and Aspects                                                      buildings within the context of the human experience.44 The
Two overarching considerations were used to structure the                   integration of quality of life indicators within hospitality and
framework: specific guidance from existing guidelines relat-                tourism performance measurement is advantageous given
ing to sustainable development, and general guidance from                   the travel industry’s contribution to one’s quality of life—
considerations about quality of life. The framework proposes                usually with less resource consumption than purchasing
to include the full range of potential performance indicators               goods for quality of life purposes.
relating to sustainable development. Non-financial perfor-                  Boundaries
mance indicators for sustainability reporting based on the                  Once a particular aspect has been defined, its boundary and
GRI guidelines and ISO 26000 encompass aspects relating to                  its measurement need to be set. For example, environment is
organizational governance, society and communities, prod-                   a general aspect that encompasses dozens of specific topics
uct responsibility, labor practices, human rights, and the                  (including most of those described as ecosystem services),
environment.38 Aspects already stipulated within the GRI                    yet it is a necessary categorization for framing the issues.
are provided with robust protocols, specific methodology                    Within environment, the specific topics can be chosen as
references, and relevance to sustainable development. Such                  areas of focus.
indicators are more readily transferrable to a hotel platform.                   The boundary also refers to the lines drawn along the
      To ensure practical future application, the framework                 chain of operations and life cycle of the service. Sustainabil-
also includes measurements related to quality of life, and                  ity implies a holistic approach to understanding the inter-
the resulting performance indicators. Though less specific                  related impacts of human activities. It is necessary to define
or directly transferrable, measurement relating to quality                  specific boundaries for performance measurement as they
of life should be included if sustainability is to be achieved.             are not as clear as those of financial accounting. The matter
Non-financial measurements of life satisfaction, well-being,                of boundary issues is comprehensively discussed in the
and happiness are seen as performance indicators that when                  GHG protocol and GRI guidelines.
harnessed can help society make transitions toward sustain-
able living.39 Such non-financial measurements have been                    Quantification Methods
put forth in several instances, including the Happy Planet                  The second step for developing sustainability performance
Index,40 Bhutan’s Gross National Happiness,41 and the Qual-                 indicators is to define the quantification methods, which
ity of Life Index,42 as well as academic and other institu-                 present definitional issues similar to boundaries in that
tions studying this type of performance measurement.43                      some quantification methods are widely accepted and
More closely related, the USGBC has begun to study green                    others are disputed. Emission factors, coefficients, and the
                                                                            terms of quantification should be transparently defined and
                                                                            communicated. Timeliness is key here as emission factors
                                                                            will change and evolve over time and are not always agreed
38 For a complete list of disclosures and performance indicators, see the
                                                                            upon. As examples, the GWP of methane and nitrous oxide
GRI guidelines at www.globalreporting.org.
                                                                            changed over the course of IPCC annual reports, and the
39 World Business Council for Sustainable Development (2010). Vision
                                                                            GHG emissions from air travel vary in how they are quanti-
2050: The New Agenda for Business. Washington, DC.
                                                                            fied (in a range from 1.9 to 2.7) based on the application of
40 Abdallah, S., Thompson, S., Michaelson, J., Marks, N. and Steuer, N.
                                                                            radiative forcing.45 This type of quantification assumption
(2009). The (un)Happy Planet Index 2.0: Why Good Lives Don’t Have to
Cost the Earth. London: New Economics Foundation.                           should be defined and communicated in any measurement
41 Braun, A. A. (2009). Gross National Happiness in Bhutan: A Living        protocol.
Example of an Alternative Approach to Progress. Wharton International       Metrics
Research Experience. Retrieved from Wharton University of Pennsylva-
nia: http://repository.upenn.edu/cgi/viewcontent.cgi?article=1077&conte     Finally, the metrics used to monitor, track, and commu-
xt=wharton_research_scholars; and Revkin, A. (2005, October 4). A new       nicate performance require clear definition. In hotels, the
measure of well-being from a happy little kingdom. The New York Times.      framework’s metrics begin as a function of the hotel facility
Retrieved from http://www.nytimes.com/2005/10/04/science/04happ.
html?_r=2&pagewanted=all.
42 Economist Intelligence Unit. (2005). The Economist Intelligence Unit’s   44 Pyke, C., McMahon, S., Dietsche, T. (2010). Green Building and
quality-of-life index. The Economist: The World in 2005. Retrieved from     Human Experience: Testing Green Building Strategies with Volunteered
http://www.economist.com/media/pdf/quality_of_life.pdf                      Geographic Information. Washington, DC: U.S. Green Building Council.
43 Inter-American Development Bank. (2008). Beyond Facts: Under-            45 For more information see Penner, J.E. et al. (eds.) (1999), Aviation and
standing Quality of Life (Executive Summary). Cambridge: Harvard            the Global Atmosphere. A Special Report of IPCC Working Groups I and
University Press; and Joseph Stiglitz, Amartya Sen, Jean-Paul Fitoussi      III in collaboration with the Scientific Assessment Panel to the Montreal
(2009). The Commission on the Measurement of Economic Performance           Protocol on Substances that Deplete the Ozone Layer. Cambridge (UK):
and Social Progress.                                                        Cambridge University Press.


Cornell Hospitality Report • July 2011 • www.chr.cornell.edu  	                                                                                      15
as the basic unit of measurement. All data exist primarily per    practicality of data collection and quantification methods for
hotel, with subsequent calculations based on a rational ru-       arriving at the performance indicators.
bric, including square feet or square meters, rooms, or guests.        To test the practicality and usefulness of the defined
As appropriate, hotel units may be aggregated to measure          performance indicators, the study examined 2010 data from
overall performance and footprint. Metrics chosen are di-         20 hotel properties affiliated with InterContinental Hotels
rectly correlated to the nature of the stakeholder request.       Group, Marriott International, or Wyndham Worldwide.
                                                                  The data comprised a variety of segments and global regions.
Framework Application
                                                                  Participating properties completed a 65-item questionnaire,
The framework is carried out by first identifying the perfor-     asking which data were available, how data points were
mance measurement components and then defining filters            measured (including the existence of sub-metering and sub-
of boundaries, quantification methods, and metrics. The           category specificity), and the actual values. Data were then
following two key considerations are necessary for the re-        analyzed to produce and compare the performance indica-
sulting performance indicators to reach any type of industry      tors among the properties, with feedback from the three
agreement: collaboration and practicality. Collaboration          firms on the study method and results.
in the hotel industry has existed for decades on numerous
issues, and it seems clear that the industry is further willing   Dimensions and Aspects
to collaborate on sustainability and corporate responsibility     The environment aspect of sustainable development
measures. Let me underline the concept of collaboration. It       included the commonly cited indicators, GHG emissions,
seems that the previous attempts at standardizing sustain-        energy, water, and waste. These were limited entirely to con-
ability metrics by third parties failed specifically because      sumption and impact areas of sustainability measurement,
they developed a method and then attempted to impose              because measurement is more straightforward and more
it upon the industry. As I pointed out, most major hotel          easily agreed on than such matters as policies, processes, and
companies have already developed internal methods for             specifications, which were not included. The wide range of
performance measurement. But the lack of collaboration in         criteria falling under those latter categories would delay the
platform development has brought the industry to where            process of collaborative effort and industry standardization
it is today, unable to uniformly communicate sustainability       for the purposes of this study.
performance to external stakeholders and thus pressured to             To obtain data for these areas to develop performance
accept a third-party solution.                                    indicators the following data points were collected (in addi-
      Any solution needs a high degree of practicality. It        tion to data on property profile and qualitative information
should take into account the availability of property data        on facilities and outlets):
and the scientific and technical data or resources available      1.	 Energy usage,
for quantification and calculation, and it should address the     	    1.1	 Fuels burned on-site (separated by fuel type),
issue of specific, granular data collection versus benchmark
                                                                  	    1.2	 Electricity,
values based on materiality thresholds. Just because obtain-
ing data or scientific information about certain issues is cur-   	    1.3	 Municipal Steam,
rently impractical does not mean that such indicators should      	    1.4	 Renewable Energy Certificates (RECs) purchased,
be abandoned. As a precursor to indicator development,            2.	 Water usage,
however, collaboration with peers, stakeholders, and the          	    2.1	 Municipal water,
supply chain should be sought to help advance the practical-      	    2.2	 Municipal chilled water,
ity of data collection.
                                                                  	    2.3	 Well water,
Framework Application and Study Design                            3. 	 Waste tonnage,
Based on the conceptual framework, I conducted a study to         	    3.1	 Diverted (separated by category as available),
develop aspects, boundaries, quantification methods, and          	    3.2	 Non-Diverted,
metrics for comparable indicators for the most commonly
                                                                  4.	 Refrigerant usage for refilling of cooling equipment
cited hotel sustainability performance factors. Three major
                                                                       (separate by refrigerant type),
industry organizations participated and helped evaluate the
                                                                  5.	 Carbon Offsets purchased.


16	                                                                        The Center for Hospitality Research • Cornell University
Boundary Specification                                             instances of data collection, while a calendar year data set
                                                                   only requires one data point.
Property Operations                                                     Recognizing that utility billing is not uniform in month-
Specifications for the boundary of GHG emissions and the           ly cut-off dates and shifts depending on when meters are
like were driven by the purpose of the study, which was to         read or on which dates days of the week fall, the study used
determine the measurement units resulting from property            one of two methods:
operations. Therefore the consumption data and resulting           1.	 Using the 12-period data set closest to January–Decem-
environmental impacts in GHG emissions were considered                 ber, usage was to be divided by the number of days in
from the operation of the building, and not its life cycle or          the 12 periods, and then the resulting value was multi-
its supply chain. As a consequence, the following were not             plied by 365 to arrive at an annual figure proximate to
included:                                                              the calendar year; or
•	   Consumption and resulting GHG emissions from the
                                                                   2.	 Using each period on the beginning and final ends of
     construction and remodeling of the building;
                                                                       the calendar year, each instance was to be divided by
•	   Consumption by the guest when outside the property                the usage by the number of days within the period, and
     (e.g., air or ground travel to the hotel);                        then the value multiplied by the number of days occur-
                                                                       ring within the calendar year of the billing period. As an
•	   Consumption by corporate offices or regional staff that           example, usage billed from December 10, 2009, through
     operates outside the building, though they are necessar-          January 9, 2010, would be divided by 31 and then multi-
     ily involved in the overall functioning of the hotel; or          plied by 9 to arrive at the January value.
•	   Consumption from operations of vendors or suppliers.               The boundary of utility consumption and environ-
                                                                   mental impacts followed the Greenhouse Gas Protocol’s
Data as Boundary                                                   definition of scope, using scope 1 (direct emissions) and 2
For the purpose of this study, the utility data submitted were     (indirect emissions) only, and not considering scope 3 emis-
the same data analyzed. No consideration was made as to            sions (those of third parties), as specified in the quantifica-
the operational or financial control of any outlets, facilities,   tion section below. Rationale for limiting the study to scope
amenities, or other public spaces that may be included in          1 and 2 was drawn from the following considerations:
the utility data but are technically outside the hotel man-        1.	   Scope 3 emissions from hotel operations is invariably
agement’s operations. Inclusion of outlets and facilities was            complex, given the inputs of materials, labor, and guests,
analyzed qualitatively in the study to determine which are               and would require extensive data gathering;
generally included and which, if any, are sub-metered.
      Likewise, if a property resold any energy to a third party   2.	 The same invariability would inhibit uniform quantifica-
or its original provider and that had not been adjusted in the         tion and measurement by hotels to stakeholders in the
data provided, then it was not reflected in the analysis. Con-         short- and mid-term, undermining the current basic
versely, if a property outsourced operations such as laundry,          needs and requests of the same stakeholders;
then utility consumption from those outsourced services            3.	 The difficulty in scope 3 emissions standardization in
were not included because they were not represented in the             hotel environmental footprinting is compounded by
utility bills presented. No validation of the data were sought,        the issues of uncertainty and lack of a widely accepted
so the actual data were analyzed, regardless of whether they           standard regarding quantification of GHG emissions a
included minute instances of fuel burning such as from                 (PAS 2050:2008 exists in the UK for product footprint-
shuttle services, landscaping, or small heating stations.              ing, but ISO 14067 and the GHG Protocol Corporate
      Data were collected on an annual basis, for the previous         Value Chain and Product Accounting and Reporting
calendar year of operations. Collecting and analyzing data             Standards are not finalized to date); and
on an annual basis by calendar year allowed for uniform
comparison and smoothed fluctuations based on weather              4.	 Once scope 1 and 2 data are available for all vendors
and demand seasonality. In the case of a new property or               and life cycles of products, they can be readily aggre-
a property that underwent a significant renovation, data               gated to determine their overall materiality.
were collected for the prior 12-month period rather than                 Consumption of energy and water and waste generation
the calendar year. In addition to consistency of seasonal          all followed the same considerations for scope. As a result,
fluctuations, a calendar year is preferable in this case to a      operational GHG emissions, utility consumption, and waste
rolling 12-month period because the latter would require 12        generation were not included in the study’s boundary as
                                                                   associated with:


Cornell Hospitality Report • July 2011 • www.chr.cornell.edu  	                                                                  17
1.	  Treatment of wastewater effluent,                                  electricity (Scope 2),
2.	  Water purification of purchased potable water,               3.	 Emissions resulting from purchased heat and steam,
3.	  Offsite IT servers,                                              and chilled water (Scope 2), and
4.	  Employee commutes,                                           4.	 Fugitive emissions (Scope 1).
5.	  Travel of property employees,                                    The following stipulations were used in quantifying
6.	  Corporate, regional, and satellite facilities,               GHG emissions:
7.	  Guest travel,                                                1.	   Site energy was used (as opposed to source energy) for
                                                                        fuel and electricity consumption;
8.	  Guest consumption off-site,
9.	  Vendors and suppliers,                                       2.	 GHG emissions are expressed in carbon dioxide equiva-
                                                                      lent (CO2e);
10.	 Outsourced laundry wash,
                                                                  3.	 Fuel emission factors were converted at high heating
11.	 Life cycles of materials and supplies used in ongoing
                                                                      values (HHV);
     operations, and
12.	 Life cycles of durable materials and supplies (i.e. FF&E).   4.	 Emission factors were prioritized as follows:
                                                                  	     1. Global (universal),
Quantification
                                                                  	     2. National, and
The predominant resource for GHG emissions quantifica-
tion and inventorying is provided by the World Resources          	     3. Regional, provincial, or state factors;
Institute (WRI) and its Greenhouse Gas Protocol. These cite       5. 	 WRI emission factors were used as the primary source
the Intergovernmental Panel on Climate Change (IPCC) on                when available; and
certain methods and data, but the IPCC does not provide           6.	 Country-sourced emission factors were used when WRI
the tools or guidelines for national, corporate, or facility          emission factors are not available.
inventory calculation. While many countries will use their
own greenhouse gas inventories to arrive at default emis-         1. Burning Fossil Fuels
sions factors, others use the WRI’s guidelines for GHG            The following six fuel types generally consumed in hotel
inventories. This includes national or regional bodies (such      operations were included in GHG emissions calculation:
as the Climate Registry in North America).                        natural gas, gasoline, diesel, propane, fuel oil (including six
Greenhouse Gases                                                  subtypes), and liquefied petroleum gas (LPG) and some of
                                                                  its subtype mixes of propane, liquid propane, and butane.
In accordance with the Greenhouse Gas Protocol, the fol-
                                                                  GHG emissions from fuel burning were calculated by mul-
lowing gases were considered greenhouse gases in emissions
                                                                  tiplying the consumption of each fuel type by its emission
inventories:
                                                                  factor.
•	 Carbon Dioxide (CO2),                                                For the quantification of GHG emissions from fuel
•	 Methane (CH4),                                                 burning, the standard unit of measurement used was metric
•	 Nitrous Oxide (N20),                                           tons of carbon dioxide equivalent (Mt CO2e) for aggregate
•	 Hydrofluorocarbons (HFCs),                                     values, and later normalized as kilograms of carbon dioxide
•	 Perfluorocarbons (PFCs), and                                   equivalent (kg CO2e) when the value was less than one met-
•	 Sulfur Hexafluoride (SF6).                                     ric ton. Although data regarding each fuel source were gath-
     Because hotel operations do not generally emit per-          ered in distinct units of measurement, the most convenient
fluorocarbons or sulfur hexafluoride those two gases were         approach was to convert all fuel consumption to a single
not included in this study. Although water vapor has been         unit (i.e., MBtu or kWh) for GHG emissions quantification
characterized as a greenhouse gas and many hotels emit            and then convert that result to kg upon final calculation. As
water vapor as part of waste heat from cooling towers, the        fuels are often provided in different forms from the utility
waste heat is considered surface-level and not atmospheric,       provider, conversion factors were applied, although conver-
and therefore this vapor was not quantified.                      sion values vary per source of conversion data.46
     For the previously delineated boundary and scope, the        Emissions Factors from Fuel Burning
following sources of GHG emissions in a hotel’s operation
                                                                  The WRI’s Stationary Combustion Tool Version 4.0, using
were included in the quantification of a carbon footprint:
                                                                  emission factors from the IPCC Guidelines for National
1.	 Emissions resulting from the burning of fossil fuels
    (Scope 1),
                                                                  46 U.S. Department of the Interior BTUs Conversion Table. http://www.
2.	 Emissions resulting from the generation of purchased          doi.gov/pam/eneratt2.html.


18	                                                                         The Center for Hospitality Research • Cornell University
Exhibit 5

 GHG emissions (commercial and institutional sector) using high heating values of fuel

 Fuel Type                                              Mt CO2/MBtu                   Mt CH4/MBtu               Mt N2O/MBtu                 kg CO2e/MBtu
 Natural Gas                                             0.053272                     0.0000047480              0.0000000950                  53.4011432
 Motor Gasoline                                         0.0694625                     0.0000100235              0.0000006014                   69.8594371
 Liquefied Petroleum Gases (LPG)                        0.0599191                     0.0000047480              0.0000000950                   60.0482732
 Residual Fuel Oil (Fuel Oil No. 5)                     0.0775815                     0.0000100235              0.0000006014                   77.9784316
Source: World Resources Institute (2008). GHG Protocol tool for stationary combustion. Version 4.0.


  Exhibit 6

  Direct greenhouse gas emission factors, using high heating values of fuel

 Fuel Type                          kg CO2/MBtu                        kg CH4/Mbtu                      kg N2O/MBtu                       kg CO2e/MBtu
 Propane                            63.0667                            0.0105419                        0.0006325                         63.484124
 Liquid Propane                     63.1620                            0.0105419                        0.0006325                         63.579457
 Fuel Oil No.1                      73.1500                            0.0105419                        0.0006325                        73.567457
 Fuel Oil No.2                      73.1500                            0.0105419                        0.0006325                        73.567457
 Fuel Oil No.4                      73.1500                            0.0105419                        0.0006325                        73.567457
 Diesel                             73.1500                            0.0105419                        0.0006325                        73.567457
Source: U.S. Environmental Protection Agency, Climate Leaders Program, Direct Emissions from Stationary Combustion Sources, Appendix B (May 2008) in U.S. Environmental
Protection Agency, Greenhouse Gas Inventory and Tracking in Portfolio Manager (August 31, 2009).


Greenhouse Gas Inventories, identifies the GHG emission                                  the process of generating and distributing electricity at the
factors in common fuel types, as found in Exhibit 5. In the                              source, not from its consumption onsite. Electricity con-
United States, the EPA provides the emission factors shown                               sumed on property that was generated onsite through com-
in Exhibit 6.                                                                            bined heat and power (cogeneration) was not considered
     As a result, GHG emissions from fuel burning were                                   here because it would have been accounted for in connec-
quantified by multiplying the amount of fuel consumed in                                 tion with fuel burning.
MBTU by its corresponding emission factor (WRI when                                           Electricity consumption was provided in kWh, which is
available, U.S. EPA otherwise), and then converting the ag-                              directly convertible to GHG emissions by multiplying con-
gregate units to arrive at a value of GHG emissions in 	                                 sumption in kWh by the corresponding country emission
Mt CO2 units, as outlined in the following equation:                                     factor, which is driven by the wide range of fuel mixes used
                        EF kg CO2e      1 kg                                             to generate the electricity and power plant efficiency. France
 FT MtCO2e = nMBTU ×                ×                                                    for example has countrywide emission factor of .085 kg of
                          1 MBTU      1000 Mt
                                                                                         CO2 per kWh of electricity produced, while China’s emission
Where:
FT = GHG emissions from fuel type                                                        factor is .788 kg of CO2 per kWh.47 Country emission factors
n = volume of fuel consumption                                                           (CO2 only) from electricity generation as available from the
EF = Emission Factor                                                                     WRI GHG Protocol Tool for Stationary Combustion are in
                                                                                         Appendix B for reference. GHG emissions from purchased
2. Purchased Electricity
                                                                                         electricity in the U.S. were quantified by multiplying the
GHG emissions from purchased electricity are indirect                                    amount of kWh consumed by .000593718.
emissions (scope 2) because using the electricity drives its
production, but the greenhouse gases are emitted during                                  47 Calculated using the GHG Protocol tool for stationary combustion,
                                                                                         World Resources Institute (2009), Version 4.0.


Cornell Hospitality Report • July 2011 • www.chr.cornell.edu  	                                                                                                           19
To convert the emission factors to Mt CO2/kWh:                   identified by the Energy Information Administration are as
                                                                       follows:
EC MtCO2e =                                                            •	 Absorption chiller: 0.0665 MtCO2e/MBTU, and
         1 kWh    EF lb CO2e               1 kg            1 Mt
nkWh ×          × 1 MWh ×                             ×                •	 Engine-driven chiller: 0.04433 MtCO2e/MBTU.
       1000 MWh                            2.2 lb         1000 kg           For electric-driven chillers, the emission factor again
                                                                       depends on the fuel mix used to generate electricity, which
Where:
                                                                       is multiplied by .238095 in the U.S. Following the same
EC = GHG emissions from electricity
                                                                       arguments as outlined above in quantifying emissions from
n = amount of electricity consumption
EF = Country Emission Factor                                           purchased electricity, GHG emissions from purchased elec-
                                                                       tric-driven chilled water in the U.S. were to be quantified by
3. Purchased Steam and Hot or Chilled Water                            multiplying the amount of MBTU consumed by 0.04155978.
As is the case with electricity, energy required to generate                For emission factors by country, the Energy Informa-
steam, hot water, and chilled water which is purchased by              tion Administration offered guidance on determining
the hotel is included as a Scope 2 emission. Also similar to           emission factors in foreign countries by multiplying their
electricity, emission factors for purchased steam or water             electricity emission factors (expressed in MT CO2/MWh,
vary by country and region. The WRI provides guidance on               kg CH4/ton-hour, and kg N2O/ton-hour of cooling pur-
how such inventories and emission factors may be calcu-                chased) by 0.921, using its foreign electricity emission fac-
lated, but does not provide country data or emission factors.          tors. Those factors, however, are dated 1999–2002; therefore
The U.S. Energy Information Administration provided ge-                the WRI country electricity emission factors can be substi-
neric emission factors for steam and chilled water based on            tuted for more accurate data.
national averages under its Voluntary Reporting of Green-              4. Fugitive Emissions
house Gases initiative. Steam or hot water emission factors
were provided without country-specific distinction.                    Emissions from substances with significant global warming
                                                                       potential (GWP), such as those found in refrigeration equip-
Steam and Hot Water
                                                                       ment, were included in the quantification of a hotel’s carbon
Emission factors for steam and hot water are dependent on              footprint. This includes chillers, decentralized air condition-
how the water was heated and distributed. According to                 ing units, and F&B temperature-regulated storage. Common
the U.S. Energy Information Administration, the national               refrigerants are HFC-22 (R-22), HFC-123, HFC-134a, R-
emission factor used in inventory accounting for purchased             410a, and R-404a. Though the operational use of these gases
steam and hot water in the U.S. is 96.952 kgCO2e /MMB-                 themselves does not generate GHG emissions, their leakage
TU.48 To normalize the unit of measure:                                into the atmosphere constitutes fugitive emissions, a Scope 1
                                   1 kg      EF kg CO2e                source of GHG emissions according to the Greenhouse Gas
	         SE MtCO2e = nMMBTU×             × 1 MMBTU                    Protocol.49
                                 1000 Mt
                                                                             In hotel operations the data from fugitive emissions
Where:                                                                 were gathered not necessarily when the leakage occurs, but
SE = GHG emissions from steam                                          when the equipment’s refrigerant was refilled through cor-
n = amount of steam consumption                                        rective maintenance on property. If refrigerant was recycled
EF = Country Emission Factor                                           by the vendor without actual leakage, then it was not count-
                                                                       ed, since offsite use of the gas is not within the specified
     As a result, GHG emissions from purchased steam                   scope. Likewise, this amount does not refer to the amount of
in the U.S. were quantified by multiplying the amount of               refrigerant circulating in the cooling equipment.
MBTU consumed by 0.096952 to arrive at a value of GHG                        Emission factors for refrigerants are specified by
emissions in Mt CO2e units.                                            engineering and scientific organizations. Emission factors
Chilled Water                                                          used for quantification in this study represent the GWP over
Considerations for chilled water are similar to those of               a 100-year lifespan of the gases in the atmosphere. A full
purchased steam or electricity. Because natural gas may be             list of refrigerants and their GWP is found in Appendix C.
either absorption or engine-driven, the U.S. benchmark                 GHG emissions from fugitive refrigerant were quantified by
domestic chilled water emission factors for natural gas as             multiplying the amount (in Mt) of each refrigerant replaced
48 Instructions for Form EIA-1605, Voluntary Reporting of Greenhouse
Gases, Energy Information Administration, Department of Energy. Oc-    49 World Resource Institute & World Business Council for Sustainable
tober 15, 2007. Appendix N; Emissions Benchmarks for Purchased Steam   Development (2004). The Greenhouse Gas Protocol: A Corporate Ac-
and Chilled/Hot Water.                                                 counting and Reporting Standard. Geneva: Earthprint Limited.


20	                                                                              The Center for Hospitality Research • Cornell University
(because of leakage) by its GWP, then summing the GHG             into the GHG emissions quantification. The energy gener-
emissions from each, to arrive at a value of GHG emissions        ated on-site from renewable sources was to be quantified
in Mt CO2 units.                                                  in the same unit of measurement as the other fuels burned.
                                                                  Second, energy consumed by chilled water or fuel would
GHG Emissions Reductions
                                                                  need conversion to units of energy (but not GHG emissions)
For the purposes of this study, emission reductions repre-        in the case that it were provided in volume.
sent purchases of Renewable Energy Certificates (RECs)                 For energy usage, the three units of measurement for
only within the data set period and not reductions achieved       providing energy data were MBTU, kWh, and J. Given the
from one period against another. Data for RECs purchased          prevalence of electricity use in hotels, kWh was used as the
through a utility provider were collected in kWh of RECs          unit of measurement.
purchased for inclusion in the final carbon footprint calcula-         To measure energy usage in the data set, the following
tions. If a property generated renewable energy on-site, then     calculations were performed:
the energy usage was later accounted for in the subsequent
energy quantification section.
                                                                     A.		   ∑ FBkWh + ∑ RFBkWh = Direct Energy Usage
     The CO2e reductions resulting from the RECs pur-
                                                                     B.		   ∑ ECkWh + ∑ PSkWh + ∑CWkWh = Indirect Energy Usage
chased are generally only applicable to the energy source
                                                                     C. 	   A + B = Total Energy Usage
they generate (in most cases electricity). Therefore the same
emission factors are applied to the kWh of RECs within
                                                                  Where:
the same category of the energy source emissions they are
reducing. Multiplying the emission factor by the Mt of kWh
                                                                  	         FB = Fuel Burned
will produce the value of CO2e reduced.                           	         RFB = Renewable Fuel Burned
                                                                  	         EC = Purchased Electricity
Carbon Offsets                                                    	         PS = Purchased Steam and Hot Water
Carbon offsets as a form of GHG emissions mitigation              	         CW = Purchased Chilled Water
were tallied in Mt CO2e purchased so they may be included
in final carbon footprint calculations. Carbon offsets are             Note that RECs and carbon offsets do not enter into
mitigation techniques however, and are not directly associ-       energy usage calculations as they do not represent reduc-
ated with fuel purchase or grid systems from which the hotel      tions in actual usage.
sources its energy.
                                                                  Water Usage
GHG Emissions Calculation                                         Four instances of water usage were addressed, as follows:
Using the four categories of GHG emissions source data            1.	 Purchased steam or hot water,
above, the following calculations were performed:
                                                                  2.	 Purchased chilled water,
   A.	∑ FBCO2e + ∑ FECO2e - ∑ REC1CO2e = Scope 1 GHG Emissions
                                                                  3.	 Purchased water, and
   B.	∑ ECCO2e + ∑ PSCO2e + ∑ CWCO2e - ∑ REC2CO2e = Scope 2 GHG
      Emissions                                                   4.	 Well water withdrawn
   C.	A + B = Gross Carbon Footprint                                   Of these four, the first two were addressed in terms of
   D.	C – COCO2e = Net Carbon Footprint                           the energy requirements for their heating and cooling, and
Where:                                                            not water usage. For the scope of the study, the first two
	         FB = Fuel Burned                                        categories of water usage above do not factor into water
	         FE = Fugitive Emissions                                 consumption because they were assumed to be in a closed
	         EC = Purchased Electricity                              loop system with the district, and thus no water gains or
	         PS = Purchased Steam and Hot Water                      losses occur. Water withdrawals occurring for purchased
	         CW = Purchased Chilled Water                            district water, chilled water, or steam were beyond the scope
                                                                  of the study, and therefore water withdrawal data refers only
	         REC1 = Scope 1 Renewable Energy Certificates
                                                                  to water withdrawn onsite.
	         REC2 = Scope 2 Renewable Energy Certificates
                                                                       Data on water consumption were collected based on
	         CO = Carbon Offsets
                                                                  the values of water used on property, and not the values of
Energy Usage                                                      water treated by the district. Sub-metering for irrigation and
The same data collected for GHG emissions boundary and            cooling tower vapor may present a discrepancy in the water
quantification were used to calculate the hotel’s energy          usage if not property counted, as both are instances of water
performance, with two additions. First, also considered was       usage and should be counted (but not double counted).
any renewable energy generated onsite that did not factor


Cornell Hospitality Report • July 2011 • www.chr.cornell.edu  	                                                                  21
For water usage, the common units of
 Exhibit 7
                                                                                       measurement for providing water data were
 Potential sustainability performance metrics                                          Cubic Feet (Ft3), Cubic Meters (M3), Liters
                                                                                       (l), and Gallons (g). M3 was used as the unit
        Aggregate             ÷   Metric Unit       =   Performance Metric
         Measure                                                                       of aggregate measurement, converted to liters
  Scope 1 GHG Emissions       ÷   Available Rooms   =   Scope 1 GHG Emissions PAR      as the unit in normalized metrics.
  Scope 2 GHG emissions       ÷   Available Rooms   =   Scope 2 GHG emissions PAR            To measure water usage in the data set
  Gross Carbon Footprint      ÷   Available Rooms   =   Gross Carbon Footprint PAR     once normalizing the units of measurement,
      Net Carbon Footprint    ÷   Available Rooms   =    Net Carbon Footprint PAR      the following calculations were performed:
      Direct Energy Usage     ÷   Available Rooms   =     Direct Energy Usage PAR
                                                                                                 A.	        Purchased district water,
      Indirect Energy Usage   ÷   Available Rooms   =    Indirect Energy Usage PAR               B.	        Well water withdrawn, and
       Total Energy Usage     ÷   Available Rooms   =     Total Energy Usage PAR                 C. 	       A + B = Total Water Usage.
  Purchased District Water    ÷   Available Rooms   =   Purchased District Water PAR
  Well Water Withdrawn        ÷   Available Rooms   =   Well Water Withdrawn PAR
                                                                                       Waste Generation
       Total Water Usage      ÷   Available Rooms   =      Total Water Usage PAR       The definition of performance metrics for
         Diverted Waste       ÷   Available Rooms   =       Diverted Waste PAR         waste is much more extensive than those for
      Non-Diverted Waste      ÷   Available Rooms   =     Non-Diverted Waste PAR       energy, water, or carbon because of the broad
          Total Waste         ÷   Available Roos    =         Total Waste PAR          scope of materials covered within the waste
  Scope 1 GHG Emissions       ÷   Occupied Rooms    =   Scope 1 GHG Emissions POR      stream and the lack of data currently avail-
  Scope 2 GHG emissions       ÷   Occupied Rooms    =   Scope 2 GHG emissions POR      able. Waste data were not considered within
  Gross Carbon Footprint      ÷   Occupied Rooms    =   Gross Carbon Footprint POR     the operational boundary for the scope 3 car-
      Net Carbon Footprint    ÷   Occupied Rooms    =    Net Carbon Footprint POR
                                                                                       bon emissions or any associated energy flows.
      Direct Energy Usage     ÷   Occupied Rooms    =     Direct Energy Usage POR
                                                                                       Likewise, water extracted from organic waste
      Indirect Energy Usage   ÷   Occupied Rooms    =    Indirect Energy Usage POR
                                                                                       was not addressed in boundary or quantifica-
       Total Energy Usage     ÷   Occupied Rooms    =     Total Energy Usage POR
                                                                                       tion definitions.
  Purchased District Water    ÷   Occupied Rooms    =   Purchased District Water POR
  Well Water Withdrawn        ÷   Occupied Rooms    =   Well Water Withdrawn POR
                                                                                            The most common quantification is the
       Total Water Usage      ÷   Occupied Rooms    =     Total Water Usage POR
                                                                                       tonnage of waste, whether landfilled, burned,
         Diverted Waste       ÷   Occupied Rooms    =       Diverted Waste POR         or diverted. This serves both as a quantifica-
      Non-Diverted Waste      ÷   Occupied Rooms    =     Non-Diverted Waste POR       tion method as well as a metric, although
          Total Waste         ÷   Occupied Rooms    =         Total Waste POR          studies have shown that diverted waste data
  Scope 1 GHG Emissions       ÷     Rooms Sold      =   Scope 1 GHG Emissions PRS      are not always readily available.50 Further-
  Scope 2 GHG emissions       ÷     Rooms Sold      =   Scope 2 GHG emissions PRS      more, consumption and impacts related
  Gross Carbon Footprint      ÷     Rooms Sold      =   Gross Carbon Footprint PRS     to different types of diverted waste lessen
      Net Carbon Footprint    ÷     Rooms Sold      =    Net Carbon Footprint PRS      the significance of a catch-all category of
      Direct Energy Usage     ÷     Rooms Sold      =     Direct Energy Usage PRS      diversion. The study therefore sought out to
      Indirect Energy Usage   ÷     Rooms Sold      =    Indirect Energy Usage PRS
                                                                                       qualitatively assess the availability of waste
       Total Energy Usage     ÷     Rooms Sold      =     Total Energy Usage PRS
                                                                                       data, understanding that issues of quantifica-
  Purchased District Water    ÷     Rooms Sold      =   Purchased District Water PRS
                                                                                       tion, boundary, and metrics needed further
  Well Water Withdrawn        ÷     Rooms Sold      =   Well Water Withdrawn PRS
                                                                                       study for final performance metrics to be
       Total Water Usage      ÷     Rooms Sold      =      Total Water Usage PRS
         Diverted Waste       ÷     Rooms Sold      =       Diverted Waste PRS
                                                                                       determined.
      Non-Diverted Waste      ÷     Rooms Sold      =     Non-Diverted Waste PRS       Metrics
          Total Waste         ÷     Rooms Sold      =         Total Waste PRS
                                                                                       A critical issue for a lodging industry sus-
  Scope 1 GHG Emissions       ÷     Square Feet     =   Scope 1 GHG Emissions PSF
                                                                                       tainability measure is to render it in terms
  Scope 2 GHG emissions       ÷     Square Feet     =   Scope 2 GHG emissions PSF
                                                                                       that are appropriate to hotel operation. In
  Gross Carbon Footprint      ÷     Square Feet     =   Gross Carbon Footprint PSF
      Net Carbon Footprint    ÷     Square Feet     =    Net Carbon Footprint PSF
                                                                                       particular, since stakeholders have requested
      Direct Energy Usage     ÷     Square Feet     =     Direct Energy Usage PSF
                                                                                       measurements of sustainability-related data
      Indirect Energy Usage   ÷     Square Feet     =    Indirect Energy Usage PSF     as connected to their hotel stays, annual
       Total Energy Usage     ÷     Square Feet     =     Total Energy Usage PSF
  Purchased District Water    ÷     Square Feet     =   Purchased District Water PSF   50 Chan, W. W. (2009). Environmental measures for
  Well Water Withdrawn        ÷     Square Feet     =    Well Water Withdrawn PSF
                                                                                       hotels’ environmental management systems. Interna-
       Total Water Usage      ÷     Square Feet     =      Total Water Usage PSF       tional Journal of Contemporary Hospitality Manage-
         Diverted Waste       ÷     Square Feet     =       Diverted Waste PSF         ment, 21(5), 542-560.
      Non-Diverted Waste      ÷     Square Feet     =     Non-Diverted Waste PSF
          Total Waste         ÷     Square Feet     =         Total Waste PSF

22	                                                                                    The Center for Hospitality Research • Cornell University
values of GHG emissions and usage are not relevant to their
                                                                   Exhibit 8
specific data request.
    Therefore the measurements need to be converted into           Sample composition
metrics that are:                                                              Sample Composition
1.	 comprehensible and relevant to the stakeholder;
                                                                                             Economy
                                                                               Luxury
2.	 common throughout the industry;                                                                            Midscale
3.	 representative of individual consumption;
4.	 practical for calculation and communication; and              Upper
                                                                  Upscale                                            Upper
5.	 incentivizing in improving performance across all sus-
    tainability aspects.
                                                                                                                    Midscale
     Four potential values of performance metrics were
identified for common use. Their application in sustainabil-
ity measurement is derived from dividing any of the above
GHG emissions, energy, water, and waste values by common                                                     Upscale
industry metrics:
Rooms available—the total rooms available (room inven-
   tory) during the calendar year (i.e., impact per available
   room or PAR);
                                                                  CDDs), although the percentage of responses diminished
Rooms sold—the total rooms sold during the calendar year          as the questions became more detailed (i.e., gross floor area,
   (not including comp rooms or no-shows) (or impact              average square footage per guestroom, square footage of
   per room sold or PRS);                                         function space, occupied rooms). Though nearly every hotel
Rooms occupied—the total rooms occupied during the                reported rooms sold in the period, less than half provided
   calendar year (sold rooms + comp rooms) (or impact             the occupied room count (rooms sold + comp rooms). Less
   per occupied room or POR); and                                 than half of the properties specified the facilities and ameni-
                                                                  ties (other than laundry) that were included in the utility
Area—the total area of the building (or impact per square         totals. Most hotels reported total water but most properties
    feet, PSF, or per square meter, or PSM).                      did not report water usage broken down into sub-categories
     The only additional denominators considered were per         of district water, well water, or chilled water.
guest or per guest-night. A per-guest metric may be relevant            Fourteen hotels responded to waste questions. Of
to activity within the hotel (e.g., a meeting), but not neces-    those, 11 were able to report waste data in tonnage, but only
sarily for a room-night. Should a per-guest value be request-     four hotels were able to provide waste diversion rates. Two
ed, it is easier to divide a room-based metric by the number      hotels diverted organic waste through composting. Though
of guests (as is the same case in ground and air transporta-      diversion rates were reported, only one property was able to
tion) to arrive at the corresponding value rather than build      provide actual diverted waste (in cubic yards). No properties
a metric around the number of guests and extrapolate to a         provided diverted waste data by specific stream.
per-room metric. This study examined the potential perfor-              No hotels had purchased RECs or carbon offsets.
mance metrics shown in Exhibit 7, on the previous page.           Boundaries
Study Results                                                     Boundary variations arose in the data collection. For exam-
                                                                  ple, four hotels included data on utility consumption from
Data                                                              outsourced amenities such as cafés and restaurants. Of the
Hotel data represented every STR chain scale segment              four, three were sub-metered. The difficulties in verifying the
(except independent), in every major climate zone. As             facilities and amenities included in utility totals also present
shown in Exhibit 8, the sample was represented most heavily       boundary variations. Though laundry and swimming pools
by upscale and upper upscale properties. Although most            were easily verified, other facilities that could affect perfor-
hotels were in the U.S., the data included nine international     mance metrics (such as a fitness center, spa, or a gift shop or
properties across Europe, the Middle East, and Asia. All          other retail outlets) were not commonly specified.
hotels reported number of guestrooms, chain scale seg-                  Finally, of the 19 hotels reporting whether laundry was
ment, and heating and cooling degree days (HDDs and               included in consumption totals, six hotels reported that they


Cornell Hospitality Report • July 2011 • www.chr.cornell.edu  	                                                                23
Exhibit 9

 Number of respondents per survey question
                                                                                                 Percent of Respondents Reporting
         100%
             80%
             60%
             40%
             20%
             0%
                                                               Number of Heating Degree …


                                                                                                                  Number of available room…
                                                                                            Cooling Degree Days


                                                                                                                                                                                                            Total Energy (MBTU)


                                                                                                                                                                                                                                                                                                                                        Water LPRS
                                       Gross floor area (m2)


                                                                                                                                                                                                                                                                             Total Energy kWhPRS
                                                                                                                                                                                                                                  Total Energy (kWh)


                                                                                                                                                                                                                                                                                                                                                                                                Total GHG MtCO2e


                                                                                                                                                                                                                                                                                                                                                                                                                                     Total GHG kgPRS
                                                                                                                                                                                                                                                                                                                                                                                                                                                       Total GHG kg/Ft2
                                                                                                                                              Number of rooms sold in 2010


                                                                                                                                                                                                                                                                                                                                                                                                                   Total GHG kgPAR
                                                                                                                                                                                                                                                                                                                                                     Water L/FT2
                                                                                                                                                                                                                                                                                                                                                                   Total Direct GHG (Scope 1)
                                                                                                                                                                                                                                                                                                                           Water LPAR
                                                                                                                                                                             Total Water Consumption (m3)
                       Swimming Pool


                                                                                                                                                                                                                                                                                                   Total Energy kWH/Ft.2
                                                                                                                                                                                                                                                       Total Energy kwhPAR


washed linens and towels in-house, and four hotels out-                                                                                                                                                                                                   GHG emissions per available room ranged from 3kg to
sourced their laundry to a third-party vendor. I note, howev-                                                                                                                                                                                      75kg, or 4.4kg to 76kg per room sold. Ranges and variances
er, that laundry was included in the twelve hotels’ utility con-                                                                                                                                                                                   in energy consumption mimicked those of GHG emissions,
sumption. This indicates the possibility that laundry could                                                                                                                                                                                        which is not surprising given their strong connection. Water
have been included in consumption totals even though it                                                                                                                                                                                            variances did not show as much of a range or deviation as
was outsourced. The variances of energy, water, and GHG                                                                                                                                                                                            energy or GHG emissions, ranging from 565 to 1,117 liters
performance metrics due to in-house vs. outsourced laundry                                                                                                                                                                                         PAR, or 846 to 1,673 liters PRS. The mean increment in oc-
wash are discussed below, although any conclusion is tenu-                                                                                                                                                                                         cupied rooms sold was .7%. In the highest case, the occupied
ous because of the limited data sample. (Exhibit 9 specifies                                                                                                                                                                                       room count was 1.5 percent higher than the count of rooms
the number of respondents to each question.)                                                                                                                                                                                                       sold.
                                                                                                                                                                                                                                                         Though smaller through segment filters, when sepa-
Performance Metrics
                                                                                                                                                                                                                                                   rating the hotels out by STR chain scale, the ranges and
Some form of per available room or per square measure                                                                                                                                                                                              variances also lessen. This is logical since similar properties
values were available for all 20 hotels. Per-room-sold values                                                                                                                                                                                      (i.e., comp sets) of rate categories may have similar attributes.
were possible for 17 hotels, yet per-occupied-room values                                                                                                                                                                                          Any type of benchmarks taken from the study may be more
were only available for 8 hotels in the data set. Performance                                                                                                                                                                                      representative by chain scale.
varied widely among properties, as did property size and                                                                                                                                                                                                 The study did not include year-over-year performance
chain scale. The breakdown by metric and chain scale seg-                                                                                                                                                                                          to allow for analysis of fluctuations in values due to oc-
ment can be found in Appendix E.                                                                                                                                                                                                                   cupancy changes. However, it is clear that PAR and PSR


24	                                                                                                                                                                                                                                                                                         The Center for Hospitality Research • Cornell University
Exhibit 10

  Sample data

                                                                                        Number of
                                                                      Number of          available
                                                                       Heating  Cooling    room    Number of
                                        Number of    Gross floor area  Degree   Degree   nights in rooms sold
       Chain scale segment              guestrooms         m2           Days     Days      2010      in 2010
       Economy (n=1)                              56          1755.77   4226.00  1237.00 20440.00 12604.67
       Midscale (n=2)                              143             7659.58    3008.50     2912.00    52052.00      30748.00
       Upper Midscale (n=2)                        683            41409.72    2036.00     2111.00 249026.50 101643.00
       Upscale (n=10)                              289            27525.86    1502.30     4040.40 103882.30        84789.89
       Upper Upscale (n=2)                         908            84886.95    2101.00     1607.00 331968.00 228314.00
       Luxury (n=3)                                530            52731.99    2504.33     2645.67 193120.00 131762.00
       Total (n=20)                                400            35156.14    2052.65     3141.90 145235.80        99487.04


                                                                                 Total    Total    Total
                                           Total Energy           Total Energy  Energy   Energy   Energy
       Chain scale segment                   (MBTU)                  (kWh)      kwhPAR kWhPRS kWH/Ft.2
       Economy (n=1)                              1206.63             353643.64    17.30    28.06    18.71
       Midscale (n=2)                              5125.43          1502179.02           28.68         49.13          18.15
       Upper Midscale (n=2)                      44814.11          13134263.38           54.91         66.12          32.76
       Upscale (n=10)                            25947.15           7604673.46           72.94        100.60          40.84
       Upper Upscale (n=2)                       72578.85          21271643.46           64.02         93.06          27.06
       Luxury (n=3)                              65577.08          19219542.60           89.35        127.76          31.56
       Total (n=20)                              36141.77          10592546.16           64.19         91.03          32.66


                                           Total Water
                                          Consumption                                 Water         Water      Swimming
       Chain scale segment                    (m3)                Water LPAR          LPRS          L/FT2        Pool
       Economy (n=1)                                                                                                  0
       Midscale (n=2)                            16886.72                 335.41        546.69       214.19                1
       Upper Midscale (n=2)                    105743.25                  213.19        454.76       246.82                1
       Upscale (n=10)                            72609.32            102661.48          827.59       271.23                9
       Upper Upscale (n=2)                     126709.09                  355.04        516.15       145.11                2
       Luxury (n=3)                            190498.32                  648.60      1247.31        312.42                1
       Total (n=20)                              97120.45              48532.05         807.70       254.08               14

                                                                                                               Concluded on next page

metrics cannot be used interchangeably. A summary of the             parameter issues. It is interesting to note that among the four
sample data is found in Exhibit 10, on this page and the next.       hotels reporting waste diversion rates, top performance in
    Regarding waste, performance was difficult to evaluate           diversion rates was not correlated with performance in waste
given the lack of response and boundary or quantification            generation, suggesting that diversion rates alone may not be


Cornell Hospitality Report • July 2011 • www.chr.cornell.edu  	                                                                    25
Exhibit 10

  Sample data


                                       Total Direct          Total GHG     Total GHG Total GHG Total GHG
      Chain scale segment             GHG (Scope 1)           MtCO2e        kgPAR      kgPRS     kg/Ft2
      Economy (n=1)                             35.38               130.06        6.36     10.32      6.88
      Midscale (n=2)                             96.14               674.81           12.81         22.10           8.10
      Upper Midscale (n=2)                      966.15              5476.78           21.18         22.08         12.46
      Upscale (n=10)                            724.82              4502.87           34.18         46.74         18.39
      Upper Upscale (n=2)                     1983.41               8149.79           24.17         35.13         10.15
      Luxury (n=3)                            1511.32               7788.07           36.40         52.62         12.82
      Total (n=20)                              938.10              4918.65           27.72         39.01         13.85


 Exhibit 11

 Analysis of waste measurement

                     Metric                   Hotel A            Hotel B            Hotel C             Hotel D
       Diversion Rate                          39.2%              16%                 21%                 21%
       Total Waste PAR                          2.97              1.40                3.24                1.72
       Total Waste POR                          N/A               2.01                4.65                2.49
       Total Waste PRS                          3.33              2.01                4.71                2.50
       Total Waste PSF                          1.92               0.95               1.07                0.89

the most appropriate indicator of performance to communi-        ing or renovating the hotel was not considered. Second,
cate consumption and impacts (Exhibit 11).                       although the study applied the calendar year expenses to
                                                                 the extent possible, a rolling 12-month average or quarterly
Discussion
                                                                 update as the standard data boundary may be more relevant
The variations in performance indicator values clearly           to a stakeholder request if monthly calculation is practical.
demonstrate the need for more precise footprinting than
a catch-all value used in generic carbon calculators. Using      Facility-Level Data
one generic industry-wide average and multiplying by the         The study only took into account facility-level data, not
number of room-nights to footprint a stakeholder’s hotel         considering the upstream or downstream footprints. Need-
stays would be no more valid than applying a single daily        less to say, if every business, including the hotel’s suppliers,
rate for all room-nights. These findings underline the need      measured Scope 1 and 2 emissions in aggregate and normal-
for collaborative agreement on the performance metrics. The      ized metrics, then hotels would not have to calculate scope
following discussion outlines the points where agreement         3 emissions themselves. Therefore if hotels would measure
would benefit the industry as it attempts to tell its sustain-   the scope 1 and 2 emissions from operations in a uniform
ability story.                                                   metric for their clients, and then require the same from their
                                                                 suppliers, then the goal of measurement and comparability
Boundary
                                                                 would be more effectively addressed. A sustainability mea-
Several boundary issues merit further discussion. To begin       sure might include the effects of the parent brand’s structure.
with, capital expenditures are not included because these        If a hotel company were to enter into a large-scale carbon
measures are intended to address operating impacts. Though       offsetting scheme or REC initiative, one would have to
a hotel’s P&L includes debt service, the “environmental debt     determine how to distribute the effects of reductions among
service” of amortizing or allocating the footprint of build-     constituent properties.


26	                                                                        The Center for Hospitality Research • Cornell University
Likewise, the utility data were analyzed as submitted,        nities when they are charged in addition to the room rate.51
with an overall assumption of a data-as-boundary parameter.         At still other properties, guests pay a resort fee or similar
No distinctions were made for facilities or amenities and           amount in addition to the room rate, and those guests are
how those may have affected performance or been allocated           not quoted an á la carte rate for amenities chosen. Likewise
to third-party operators. As an example, laundry data were          all the public areas, FF&E, and aesthetics are included in the
treated as reported, even though some operations washed             value proposition and contribute to the footprint, regardless
laundry in-house and others outsourced. Some hotels                 of whether the guest expressly appreciates these amenities.
included utility usage from the laundry and others did not.               Finally, the reductions in footprints if guests reduced
Drawing a boundary of only operational control may skew             their consumption at the margin may be negligible when
footprints depending on how laundry is handled. This is             one considers the energy and water used in public areas.
especially important considering the ubiquitous linen-reuse         Beyond that issue, small changes in the guest-stay footprint
programs now in place. To turn around and indicate that a           may also disappear when an entire trip is considered, given
footprint did not include laundry data because it was out-          the components that make up the carbon footprint of travel.
sourced may seem counterintuitive (or even disingenuous)            In that light, even the proportion represented by lodging is
to stakeholders.                                                    negligible in comparison to the transportation. As shown in
      The matter of how to record laundry impacts provides          Appendix G, emissions from flying to the destinations of ho-
key insight to the importance of agreement regarding                tel location in the data set ranged from 115 kgCO2e to 2,555
inclusion of data from amenities and facilities. Some are           kgCO2e. When comparing the mean carbon footprint of
handled by the hotel operator, and some are outsourced,             the air emissions with the mean footprint of hotel stays per
and the structure is never uniform across all hotels. As well,      room sold (assuming a 3-night stay), the hotel stay repre-
most operations do not have sub-metered utility billing and         sented 13 percent of the carbon footprint. This was without
will need agreement on how to allocate or disaggregate data         accounting for the footprint of ground transportation, or any
as needed. Perhaps the best way to frame this boundary              related business event. Therefore, even if the guest and hotel
issue is to bear in mind the stakeholder perception of guest        combined to reduce by 15 percent the guests’ consumption-
consumption.                                                        based footprint for the hotel stay, that would account for less
      With regard to the footprint of a guest stay, it seems        than a 2-percent change in the total travel footprint.
clear that basing performance indicators on average con-                  It should be noted that the above arguments are
sumption is the preferable approach, rather than attempt to         intended for the discussion of industry-wide performance
account for what hotel features the guest did or did not use.       indicator development, and not value creation for the guest.
In fact, at the moment it is impractical to provide guest-spe-      Certainly options and possibilities exist to engage with
cific data(e.g., whether the guest used the pool, or turned on      guests, use innovative technology, and create pricing struc-
the room air conditioner). The sub-metering and monitor-            tures that add value to the guest experience. Those discus-
ing systems required to confirm actual use and consumption          sions are, however, outside the boundaries of standardizing
would be a technological, financial, and operational burden.        the carbon footprint calculation of a hotel stay.
Moreover, consumption-based accounting will complicate
                                                                    Quantification
the comparability of performance indicators among hotels
by guest stay. Aside from increased cost, installing such           The lodging industry will need to agree on several quanti-
monitoring devices would ironically increase the hotel’s            fication parameters to allow for uniform footprinting and
environmental footprint due to manufacturing, installing,           comparability. They are listed below, along with the defini-
maintaining, and using the systems. I do not argue here             tions used in this study:
against sub-metering in certain situations, but tracking the        •	   Source or site energy as base values for energy and
data from each guest stay does not seem cost-effective or                carbon (site energy was used);
environmentally sound for the benefit provided.
                                                                    •	   Emission factors for fuel burning and fugitive emissions
     A second reason for applying an average-guest-stay
                                                                         (WRI emission factors were used, derived from IPCC
footprint lies in the unparallel structure of amenity con-
                                                                         data);
sumption and rates charged. Guests feel more free to use
amenities at a hotel that includes those services in daily rates,   •	   GWP years for fugitive emissions sources (100-year fac-
such as a complimentary breakfast, wi-fi, or a fitness center.           tors were used);
On the other hand, guests are more judicious in using ame-
                                                                    51 Chekitan S. Dev and Glenn Withiam, “Fresh Thinking about the Box,”
                                                                    Cornell Hospitality Roundtable Proceedings, Vol. 3, No. 6, p. 10 (Cornell
                                                                    Center for Hospitality Research), quoting a study by Rebecca Hamilton
                                                                    on predicted and actual use of amenities in U.S. hotels.


Cornell Hospitality Report • July 2011 • www.chr.cornell.edu  	                                                                            27
Exhibit 12

     Evaluation of potential sustainability performance metrics based on sample data set

                                                                               Representative of
                                  Relevance to               Current                Room                 Practical Data    Incentivizes
             Metric                  Guest                 Industry Use          Consumption               Gathering       Performance
 Per Available Room                  Medium                     High                 Medium                    High             Low
 Per Room Sold                         High                     High                   High                    High            High
 Per Occupied Room                     High                   Medium                   High                  Medium            High
 Per Square Foot/                       Low                     High                 Medium                    High           Medium
 Meter


•	      High or low heating values of fuel burning (high values           tion and the wide mix of fuel sources used to generate that
        were used);                                                       power. The EPA eGRID platform provides emission factors
                                                                          by region based on fuel mixes and the grid structure. Ac-
•	      Country or sub-national emission factors and how to
                                                                          cording to the 2010 eGRID summary tables, a hotel in Den-
        account for CH4 and N2O uniformly for electricity (na-
                                                                          ver would have a Scope 2 carbon footprint over 3 times that
        tional emission factors were used and only CO2 outside
                                                                          of a hotel in Los Angeles for the same electricity consump-
        the U.S.);
                                                                          tion (2,198.35 lb/MWh in Colorado vs. 683.53 lb/MWh in
•	      Emission factors for energy and GHG emissions from                California).53 If the eGRID national average of 1,306.18 lb/
        steam and chilled water (U.S. EPA emission factors were           MWh is used as the emission factor in both properties’ cal-
        used, based on EIA data);                                         culation, however, the two hotels may be compared.

•	      Conversion factors for standardizing energy units to              Metrics
        Btu or kWh (factors from the U.S. Energy Information              Although the industry commonly applies a per-available-
        Administration were used); and                                    room analysis of its revenues, PAR is probably not the most
                                                                          useful GHG measure from the guest’s point of view, based
•	      The integration of RECs and offsets into carbon per-
                                                                          on a comparison of the four footprint “denominators.” PAR
        formance indicators (RECs were to be subtracted from
                                                                          does not reflect consumption incurred for a room-night as
        energy pre-quantification of carbon; offsets were to be
                                                                          effectively as other metrics. Also, PAR values may be inverse-
        subtracted post-quantification in a net value).
                                                                          ly correlated with occupancy, because the PAR performance
     For GHG emissions quantification, the WRI states that                would improve as occupancy rates decline.
the most specific emission factors available should be used.52
                                                                          Per Room Sold (PRS)
Although region-specific emission factors would certainly
add precision to the carbon footprint calculation those data              Given the industry’s current widespread use of STR defini-
are not readily available in most countries. Therefore a GHG              tions of rooms sold, the PRS metric is far more practical and
inventory for a hotel chain with thousands of properties in               is more representative of individual room consumption and
dozens of countries would most likely want to take the only               does not fluctuate as highly with occupancy. The range of
standardized approach currently available of using national-              the utility fluctuations however within the scope and bound-
level emission factors. The other choice would be to disclose             ary of the study would need analyzing with a larger data set
country-by-country the specificity levels and references cited            to investigate the validity of this measure.
for emission factors used.
                                                                          Per Occupied Room (POR)
     Even in the United States, where regional emission fac-
tors are available, any large-scale comparison among hotel                POR is the measure that most accurately represents con-
properties would become unintelligible and impractical                    sumption per room because it includes comp rooms, which
given the large role of electricity in hotel energy consump-              are not part of the STR calculations of rooms sold. Comp
                                                                          rooms do, of course, generate utility usage and GHG emis-
52 World Resource Institute & World Business Council for Sustainable
Development. (2004). The Greenhouse Gas Protocol: A Corporate Ac-         53 Calculated using the EPA eGRID2010 Summary Tables, Environmen-
counting and Reporting Standard. Geneva: Earthprint Limited.              tal Protection Agency (2010). Version 1.0.


28	                                                                                 The Center for Hospitality Research • Cornell University
sions. In the study’s results, comp rooms represented an          as chain scale, and normalization factors (notably, weather
additional .7% to rooms sold on average. If comp room data        and outlets or facilities).
are not readily available, then benchmark factors for comp
                                                                  Normalization
rooms could be added to PRS.
                                                                  Because climate is a critical input to energy performance,
Per Square Foot (PSF) or Per Square Meter (PSM)                   the study collected data on geographic region, climate zone,
For operations purposes a PSF/PSM metric is the most              heating degree days, and cooling degree days. as a precursor
practical, given the unchanging denominator of area. An           to future weather normalization. Normalization based on
area-based measurement allows for comparability among             climate zone and specifically HDDs and CDDs is needed to
properties with similar occupancies because it would imme-        allow meaningful comparisons not only across hotels, but for
diately normalize for differences in public areas and outlets.    the same hotel across time.
Although it does not directly address occupancy-related con-           The data-as-boundary specification presents a limita-
sumption, with an appropriate adjustment (i.e., multiplying       tion in the existence and operation of certain outlets. In
by the average area per guestroom, gross or net) it would be      addition to the issue of an on-premises laundry, whether the
relevant for stakeholders asking to know the environmental        property has a spa, fitness center, or F&B outlets all affect its
footprint of their stay.                                          performance. Research will determine whether these require
     A comparison of the four potential sustainability perfor-    normalization. At the minimum, a normalization factor to
mance metrics is shown in Exhibit 12. Theoretically the met-      be added to the footprint of hotels which outsource laundry
rics most relevant for client footprinting will represent the     may be appropriate as further research could define appro-
closest actual consumption and impacts resulting from the         priate benchmark values.
hotel stay. A PRS or POR metric is consumption-based at a         Chain Scale Benchmarks
larger level, since it divides the hotel’s consumption and im-
                                                                  Since we have each property’s chain scale, it is possible
pacts by the number of rooms utilized by the hotel’s guests.
                                                                  that issues of amenities and public areas can be smoothed
Useful though they may be, PAR and PSF values do not
                                                                  by normalizing or enabling comparisons among segments,
necessary reflect a footprint of the guest. Therefore some ele-
                                                                  and a PSF proxy may thus be unnecessary. In any event, it
ments of guest consumption need to be taken into account.
                                                                  makes little sense to compare a limited service hotel to a full-
From this perspective, comp rooms could be considered as a
                                                                  service property.
part of the hotel’s general footprint from BOH operation.
                                                                        A final consideration for comparability is the type of
     The difficulty in PRS metrics is that they vary widely by
                                                                  guestroom occupied by the client, which was not included
the amount of public space and facilities and amenities. In
                                                                  in this study. A suite or deluxe room may have a higher
this instance, the differences in hotel size and scale may be
                                                                  footprint than a standard guestroom. The air travel emis-
best communicated in PSF/PSM metrics. Just as in the case
                                                                  sions calculation found that the footprint of a business or
of guests and room-nights, multiple metrics may be used
                                                                  first class seat was on average higher than an economy seat
and communicated, but if all performance indicators were
                                                                  by a factor of 2.2. Further study could determine whether
disclosed collectively they would compromise the hotel’s oc-
                                                                  that is also true with regard to the additional consumption
cupancy data. Specifically, if PAR and PRS were both given,
                                                                  associated with a suite.
then a stakeholder could divide the PAR value by the PRS
                                                                        Just as the premise of Energy Star ratings is to provide
value and arrive at the hotel’s occupancy. Given the competi-
                                                                  an overall performance rating based on a benchmarking
tive value of property-level occupancy data, it is not practi-
                                                                  and rating system, an overall sustainability rating or index
cal to provide both metrics to external stakeholders.
                                                                  of performance for hotels is a potential path toward com-
     In the end, PSF/PSM and per-room metrics do not
                                                                  parability. It is beyond the current framework to develop a
compromise the hotel’s data. Based on this reason and
                                                                  comprehensive index scheme, as the current industry need
the sample set results of data availability, PSF and PRS
                                                                  is to standardize the parameters of performance indicators
metrics appear to be best for footprinting and comparing
                                                                  individually. Further research on benchmarking, stakeholder
sustainability performance in carbon, energy, and water
                                                                  requests, and performance indicator development would
from hotel stays. Further research may provide a hybrid
                                                                  help advance a benchmark index.
metric of PSF and PRS to provide increased comparability.
                                                                  Stakeholders
Comparability and Benchmarking
                                                                  As we have seen from this study, sustainability performance
To ensure comparability of the analysis, the footprint data
                                                                  measurement involves a complex series of assumptions and
need to be filtered through two attributes: revenue class such
                                                                  parameters. To increase transparency, these assumptions
                                                                  can be provided when performance indicators are given to


Cornell Hospitality Report • July 2011 • www.chr.cornell.edu  	                                                                 29
stakeholders. The stakeholder can then evaluate the indica-       indicators in sustainability measurement and then offered
tors and assumptions in making a comparison among peer            a process by which performance indicators are defined by
hotels. As an example, a reference sheet for this study was       passing specific aspects of sustainability through defining
included in Appendix E.                                           characteristics of boundary, quantification, and metrics
     This study’s quantification method is limited because        while considering the issues of industry collaboration and
the data represent the footprint of the entire building, but      practicality.
not its component services. As a result, this methodology              The study applied the framework to determine the
would not provide information for stakeholder groups that         boundary, quantification methods, and metrics for perfor-
request footprints of meetings and events. The footprint          mance indicators of carbon, energy, water, and waste derived
of the room-night is one part of an event footprint, but          from hotel stays, representing the most common request by
how meeting footprints are handled will also affect room-         external stakeholders. Metrics for these four aspects were
night quantification. One way to do this is to calculate a        conclusively studied with the result of a uniform recommen-
per-square-foot or -meter footprint and then allocate the         dation for measurement in carbon, energy, and water. Waste,
meeting’s footprint proportionate to the area of the func-        however, requires further parameter specification by both
tion space and duration of the event. Unfortunately, simpli-      industry and stakeholders to proceed with performance
fied square footage (meter) allocations do not necessarily        indicator development by means of the framework. For the
represent proportionate consumption (i.e., a ballroom             remaining three, the multitude of boundary and facility allo-
representing 10 percent of a hotel’s gross floor area does not    cation issues also require further parameter specification to
necessarily use 10 percent of its overall energy and water        arrive at uniform performance indicators that can be applied
consumption). At the same time, per-room metrics are not          industry-wide.
representative of meeting footprints. Regardless of how the            In addition to satisfying client requests for footprints of
event footprint is quantified, it would result in double count-   hotel stays, the study’s set performance indicators could be
ing of consumption and impacts within the performance             included as supplemental, sector-specific measurements of
indicators provided to the client if room-night footprints are    intensity or product-level footprints in sustainability reports.
quantified separately from function space footprints using        The prevalence of requests by stakeholders for this type of
the same total energy or water balance. Footprints for meet-      information leads to the conclusion that they would pass a
ings are strongly tied to footprints of guestrooms for specific   materiality test for being deemed core performance indica-
stakeholder requests and will need further research to be         tors by a working group. Likewise, the performance indica-
uniformly presented in performance metrics.                       tors have specific linkages to certifications and frameworks
     With this issue in mind, potential solutions for generat-    previously reviewed in the background section. A linkage
ing industry agreement in uniform boundary and quantifica-        table is included in Appendix F.
tion for facilities and amenities are:                                 Further work is needed to advance the framework and
1.	 Further study to determine proportions and impact             the proposed performance indicators. Industry discussion
    of each boundary issue to overall consumption and             and collaboration is paramount in this regard. Further re-
    impacts of the sustainability aspects;                        search with more comprehensive data sets, tests of boundary
                                                                  and quantification issues, and stakeholder needs will also
2.	 Analysis of consumption percentages to determine their        help advance both the framework and the standardization of
    materiality in whether they need precise measurement          sustainability performance measurement in hotel operations.
    or can have a benchmark industry percentage allocated              One potential barrier to collaboration is that nearly
    to them (i.e., by chain scale segment and normalized for      every major hotel company already has developed internal
    climate zone) without granular, event-specific data; or       system-wide performance measurement software without
3.	 Analysis of the proximity of current allocation               prior industry agreement on boundaries, quantification,
    structures in rental or operating agreements to               and data sets to be communicated to external stakeholders.
    determine their application in allocating corresponding       Such systems represent considerable investment. At pres-
    consumption.                                                  ent many are still in a phase of evolving and gaining buy-in,
                                                                  but the delaying of collaborative agreement could result in
Conclusion                                                        increased costs should systems need to be modified accord-
This study’s purpose was to address the lodging industry’s        ing to a common standard. In the long run however, the cost
need to answer external stakeholder requests for standard-        of harmonizing data reporting from internal systems would
ized sustainability performance indicators. It started by pro-    be lower than the instance of a continued fee (and analytical
posing a conceptual framework for developing performance          leverage) paid to third parties for external normalization. n


30	                                                                        The Center for Hospitality Research • Cornell University
Appendix A

  Performance disclosed and metrics used in hotel GRI reports through 2009


 METRICS               Accor                    HK-Shanghai             IHG                     Jumeirah
 BREAKDOWN
 Total Energy     MWh                           Gj                      kWh                     kWh (elec only)
 (EN3 and/or EN4)
 Energy Intensity      kWh Per Available        MJ per m2               kWh Per Available       Not Reported
                       Room                                             Room
 Total Water (EN8) Mm3                          m3                      m3                      m3
 Water Intensity       Per Occupied Room        L. Per Guest Night      Not Reported            Not Reported
                       Mm3
 Total Waste          Tons                      Not Reported            Not Reported            Not Reported
 (EN22)
 Waste Intensity      Tons Per Hotel            Not Reported            Not Reported            Not Reported
 Total GHG             Metric Tons              Metric Tons             Approximate Metric      Not Reported
 Emissions (EN16)                                                       Tons
 GHG Emissions         Not Reported             Not Reported            kg. Per Room Night      Not Reported
 Intensity
 Boundaries           As available from         Headquarters +          Managed and             Dubai-based managed
                      reporting properties      Operational Control +   Franchised properties   properties and those of
                      (owned, managed,          Some External                                   influence
                      leased, and franchised)   Employees

                       Marriott                  NH                       Rezidor                    Sol Meliá            Taj
 Total Energy     MWh                            MWh                      Not Reported               Gj                   Gj
 (EN3 and/or EN4)
 Energy Intensity      kWh Per Available Room kWh Per Guest Night         kWh per m2                 Not Reported         Not Reported
 Total Water (EN8) Mm3                           m3                       Not Reported               m3                   m3
 Water Intensity       Per Available Room        L. Per Guest Night       L. Per Guest Night         Not Reported         Not Reported
                       Mm3
 Total Waste          Tons                       kg.                      Not Reported               Not Reported         Not Reported
 (EN22)
 Waste Intensity       Not Reported              kg. Per Guest Night      kg. Per Guest Night        Tons or kg per       Not Reported
                                                                                                     Hotel
 Total GHG             Metric Tons               Metric Tons              Metric Tons                kg                   Metric Tons
 Emissions (EN16)
 GHG Emissions         Lb. Per Available Room    kg. Per Guest Night      kg. Per Guest Night        Not Reported         Not Reported
 Intensity
 Boundaries            Energy/Water/GHG:      As available (sometimes     Managed and Leased         Not Specified        Cites brands that
                       Global Managed, Waste: partial) among owned,       Properties (that                                are included
                       US Managed             leased, and managed         reported)


Cornell Hospitality Report • July 2011 • www.chr.cornell.edu  	                                                                         31
Appendix B

  Emission factors of kg CO2 per kWh of electricity generated per country


                                       EMISSION FACTORS OF KG CO2E PER kWh OF ELECTRICITY GENERATRED PER COUNTRY
                             Emission                     Emission                       Emission                  Emission                          Emission
Country                        Factor Country               Factor Country                 Factor Country            Factor Country                    Factor
Albania                      0.0324402 Cuba               1.0194389 Israel                0.773651 Nicaragua       0.5497637 Togo                    0.4586697
Algeria                      0.6881182 Cyprus             0.7582802 Italy                 0.403512 Nigeria         0.3861378 Trinidad and Tobago     0.7243096
Angola                       0.0982004 Czech Republic      0.526629 Jamaica              0.8297551 Norway           0.006867 Tunisia                 0.5458586
Argentina                    0.3033696 Denmark             0.341339 Japan                 0.418346 Oman            0.8561127 Turkey                   0.438222
Armenia                      0.1382909 Dominican Republic 0.6238551 Jordan               0.6018739 Pakistan        0.4128082 Turkmenistan            0.7951304
Australia                     0.920527 Ecuador            0.3957349 Kazakhstan           0.5200265 Panama          0.2288439 Ukraine                 0.3443288
Austria                       0.214471 Egypt              0.4698084 Kenya                0.3174905 Paraguay                 0 United Arab Emirates   0.8199856
Azerbaijan                   0.4734752 El Salvador        0.2167277 North Korea          0.5331955 Peru            0.1723235 United Kingdom           0.504733
Bahrain                      0.8248637 Eritrea             0.690342 South Korea           0.464337 Philippines     0.4350061 United States              0.55866
Bangladesh                   0.5843308 Estonia            0.6401581 Kuwait               0.6429168 Poland             0.65865 Uruguay                0.2963499
Belarus                      0.2963771 Ethiopia            0.002914 Kyrgyzstan            0.079161 Portugal         0.416424 Uzbekistan                 0.44636
Belgium                       0.260036 Finland             0.241592 Latvia               0.1673881 Qatar           0.6257141 Venezuela               0.2084422
Benin                        0.6962126 France              0.084953 Lebanon              0.6946497 Romania          0.428605 Vietnam                 0.3963138
Bolivia                      0.5049688 Gabon              0.3466605 Libya                0.8788286 Russia          0.3285654 Yemen                   0.8230311
Bosnia and Herzegovina        0.801958 Georgia            0.1449678 Lithuania             0.139482 Saudi Arabia    0.7553734 Zambia                  0.0067574
Botswana                     1.8514539 Germany             0.403629 Luxembourg            0.326047 Senegal         0.7258949 Zimbabwe                0.5727689
Brazil                       0.0814376 Ghana              0.2756985 Macedonia            0.6189059 Serbia          0.7155911 Other Africa            0.4886113
Brunei Darussalam            0.8210049 Gibraltar          0.7304305 Malaysia             0.6553582 Singapore       0.5360586 Other Latin America     0.5089928
Bulgaria                     0.4479618 Greece              0.724964 Malta                0.8340854 Slovak Republic 0.223412 Other Asia               0.3078166
Cambodia                     1.0049344 Guatemala          0.3344147 Mexico                0.541285 Slovenia        0.3317589
Cameroon                     0.0425357 Haiti              0.3051825 Moldova               0.475568 South Africa    0.8689996
Canada                        0.184179 Honduras           0.4132526 Mongolia                0.52331 Spain           0.349794
Chile                        0.2942425 Hong Kong, China   0.8546126 Morocco              0.7079012 Sri Lanka       0.3137244
China (including Hong Kong)  0.7883087 Hungary             0.343927 Mozambique           0.0010178 Sudan           0.6139183
Colombia                     0.1496172 Iceland             0.000542 Myanmar              0.3382211 Sweden           0.047966
Congo                        0.1023289 India              0.9440385 Namibia              0.0756469 Switzerland      0.025723
Democratic Republic of Congo 0.0027816 Indonesia          0.6767253 Nepal                0.0037996 Syria           0.6043992
Costa Rica                   0.0473985 Iran               0.5143547 Netherlands           0.394315 Tajikistan      0.0280183
Côte d'Ivoire                0.4362172 Iraq               0.7009096 Netherlands Antilles 0.7170685 Tanzania        0.3155122
Croatia                       0.318398 Ireland             0.535333 New Zealand              0.3091 Thailand       0.5109283

Source: World Resources Institute (2009). GHG Protocol tool for stationary combustion. Version 4.1.


32	                                                                                                   The Center for Hospitality Research • Cornell University
Appendix C

 GWP of common refrigerants


 Gas or Blend            GWP                       Source                                    Gas or Blend             GWP                       Source
 CO2                     1                         IPCC Second Assessment                    R-410A                   1,725                     ASHRAE Standard 34
                                                   Report (1995)
 HFC-23                  11,700                    IPCC Second Assessment                    R-410B                   1,833                     ASHRAE Standard 34
                                                   Report (1995)
 HFC-32                  650                       IPCC Second Assessment                    R-411A                   15                        ASHRAE Standard 34
                                                   Report (1995)
 HFC-125                 2,800                     IPCC Second Assessment                    R-411B                   4                         ASHRAE Standard 34
                                                   Report (1995)
 HFC-134a                1,300                     IPCC Second Assessment                    R-412A                   350                       ASHRAE Standard 34
                                                   Report (1995)
 HFC-143a                3,800                     IPCC Second Assessment                    R-413A                   1,774                     ASHRAE Standard 34
                                                   Report (1995)
 HFC-152a                140                       IPCC Second Assessment                    R-414A                   0                         ASHRAE Standard 34
                                                   Report (1995)
 HFC-236fa               6,300                     IPCC Second Assessment                    R-414B                   0                         ASHRAE Standard 34
                                                   Report (1995)
 R-401A                  18                        ASHRAE Standard 34                        R-415A                   25                        ASHRAE Standard 34
 R-401B                  15                        ASHRAE Standard 34                        R-415B                   105                       ASHRAE Standard 34
 R-401C                  21                        ASHRAE Standard 34                        R-416A                   767                       ASHRAE Standard 34
 R-402A                  1,680                     ASHRAE Standard 34                        R-417A                   1,955                     ASHRAE Standard 34
 R-402B                  1,064                     ASHRAE Standard 34                        R-418A                   4                         ASHRAE Standard 34
 R-403A                  1,400                     ASHRAE Standard 34                        R-419A                   2,403                     ASHRAE Standard 34
 R-403B                  2,730                     ASHRAE Standard 34                        R-420A                   1,144                     ASHRAE Standard 34
 R-404A                  3,260                     ASHRAE Standard 34                        R-500                    37                        ASHRAE Standard 34
 R-406A                  0                         ASHRAE Standard 34                        R-501                    0                         ASHRAE Standard 34
 R-407A                  1,770                     ASHRAE Standard 34                        R-502                    0                         ASHRAE Standard 34
 R-407B                  2,285                     ASHRAE Standard 34                        R-503                    4,692                     ASHRAE Standard 34
 R-407C                  1,526                     ASHRAE Standard 34                        R-504                    313                       ASHRAE Standard 34
 R-407D                  1,428                     ASHRAE Standard 34                        R-505                    0                         ASHRAE Standard 34
 R-407E                  1,363                     ASHRAE Standard 34                        R-506                    0                         ASHRAE Standard 34
 R-408A                  1,944                     ASHRAE Standard 34                        R-507(A)                 3,300                     ASHRAE Standard 34
 R-409A                  0                         ASHRAE Standard 34                        R-508A                   10,175                    ASHRAE Standard 34
 R-409B                  0                         ASHRAE Standard 34                        R-508B                   10,350                    ASHRAE Standard 34

 Adapted from: World Resources Institute, Calculating HFC and PFC Emissions from the Manufacturing, Installation, Operation and Disposal of Refrigeration & Air-conditioning
 Equipment (Version 1.0): Guide to calculation worksheets (January 2005)


Cornell Hospitality Report • July 2011 • www.chr.cornell.edu  	                                                                                                           33
Appendix D

 Results from data set


 Profile Data              Data Set   Mean         Min                     Max                    Standard
                                                                                                  Deviation
 Guestrooms                20         394          56                      1,354                   343
 Gross floor area (Ft.2)   20         378,418      18,899                  1,500,000               381,740
 Ft.2 total function       6          65,212       1,236                   206,154                 90,802
 space
 Ft.2 per guestroom        8          601          254                     969                     250
 Heating Degree Days       20         2,053        24                      4,352                   1,670
 Cooling Degree Days       20         3,142        864                     6,254                   2,185
 Rooms Available           20         143,908      20,440                  495,040                 125,113
 Rooms Sold                18         97,024       12,605                  340,392                 78,227
 Occupied Rooms            8          111,948      30,017                  344,948                 112,716
 Comp % Increment          8          0.7%         0.2%                   1.5%                    0.5%


 Performance               Data Set   Mean         Min                     Max                    Standard
 Metrics                                                                                          Deviation
 Total Energy (kWh)        18         10,592,546   353,644                 37,650,364              10,801,452
 Total Energy PAR          17         64           17                      131                     31
 Total Energy POR          8          85           39                      176                     42
 Total Energy PRS          15         91           28                      178                     44
 Total Energy PSF          17         33           18                      97                      18
 Total Water (M3)          17         97,120       3,672                   353,694                 94,975
 Water LPAR                17         565          52                      1,117                   333
 Water LPOR                8          722          435                     1,653                   397
 Water LPRS                15         846          351                     1,673                   468
 Water L PSF               17         254          31                      600                     131
 Total Waste (Tons)        11         665          42                      3,019                   888
 Total Waste kgPAR         11         4.9          0.7                     26.2                    7.4
 Total Waste kgPOR         4          2.6          1.4                     4.6                     1.4
 Total Waste kgPRS         9          6.4          1.4                     33.3                    10.2
 Total Waste kg PSF        11         2.5          0.4                     13.9                    4.0
 Total Direct GHG (Scope   16         938.10       35.38                   2,879.04                1,006
 1)
 % Fugitive of Scope 1     10         0.022%       0.000%                  0.140%                 0.044%
 Total GHG Emissions       17         4,919        130                     16,067                  5,270
 (Scope 1 & 2)
 Total GHG kgPAR           17         28           6                       77                      18
 Total GHG kgPOR           8          35           17                      75                      18
 Total GHG kgPRS           15         39           10                      102                     25
 Total GHG kg PSF          17         14           7                       36                      8


34	                                                        The Center for Hospitality Research • Cornell University
Appendix D

  Results from data set (continued)


                                                 Mean Values by STR Segment
 Performance             Economy        Midscale        Upper Midscale       Upscale         Upper Upscale          Luxury
 Metrics
 Total Energy (kWh)      353,644        1,502,179       13,134,263           7,604,673       21,271,643             19,219,543
 Total Energy PAR        17             29              55                   73              64                     89
 Total Energy POR        N/A            49              N/A                  66              92                     132
 Total Energy PRS        N/A            49              66                   102             93                     128
 Total Energy PSF        N/A            18              38                   41              27                     32
 Total Water (M3)        N/A            16,887          105,743              72,609          126,709                190,498
 Water LPAR              114            335             418                  592             355                    882
 Water LPOR              N/A            545             N/A                  664             511                    1,169
 Water LPRS              N/A            547             455                  910             516                    1,247
 Water L PSF             N/A            214             247                  271             145                    312
 Total Waste (Tons)      N/A            42              419                  756             948                    N/A
 Total Waste kgPAR       1.3            0.7             2.1                  7.3             2.5                    N/A
 Total Waste kgPOR       N/A            1.4             N/A                  2.0             3.6                    N/A
 Total Waste kgPRS       N/A            1.4             3.3                  9.2             3.6                    N/A
 Total Waste kg PSF      1.5            0.4             6.5                  3.8             1.0                    N/A
 Total Direct GHG        35             96              966                  649             1,983                  1,511
 (Scope 1)
 % Fugitive of Scope 1   0.0214%        0.0200%         0.0214%              N/A             N/A                    0.0046%
 Total GHG Emissions     130            675             5,477                4,503           8,150                  7,788
 (Scope 1 & 2)
 Total GHG kgPAR         6              13              21                   34              24                     36
 Total GHG kgPOR         N/A            22              N/A                  26              35                     59
 Total GHG kgPRS         10             22              22                   47              35                     53
 Total GHG kg PSF        7              8               12                   18              10                     13


Hotel Locations: USA, 11 properties; United Arab Emirates, 4 properties; UK, 2 properties; China, 2 properties; and Netherlands, 1 property.
Energy Source: Natural Gas, 16 hotels, Electricity, 15 hotels, and Propane, LPG, Fuel Oil, and Steam, 1 property each.


Cornell Hospitality Report • July 2011 • www.chr.cornell.edu  	                                                                         35
Appendix E

 Sample hotel property reference sheet for external stakeholders
 Performance Metrics [to be filled in per hotel]                                      Boundaries
 Gross Carbon Footprint PRS         [value]kg          Data Parameters                 Included                Not Included
 Gross Carbon Footprint PSF         [value]kg        Data-as-boundary         All operated facilities’   Construction/Renovation
 Net Carbon Footprint PRS           [value]kg                                 utility consumption
 Net Carbon Footprint PSF           [value]kg
                                                     2010 calendar year       All meeting space          Outsourced operations
 Total Energy PRS                   [value]kWh
                                                     Facility-level           Fuels Burned (stationary   Treatment of wastewater
                                                                              and mobile)
 Total Energy PSF                   [value]kWh       Self-reported            Fugitive Emissions         Water purification
 Water PRS                          [value]L         No weather               Purchased Electricity      Offsite IT servers
 Water PSF                          [value]L         normalization
                                                     No chain scale           Purchased Steam            Employee commutes/
                                                     normalization                                       travel
                                                                              RECs                       Corporate or regional
                                                                                                         offices
                                                                              Carbon Offsets             Life cycles of materials
                                                                                                         and supplies
       Attributes [to be filled in per hotel]                                                            Upstream or downstream
                                                                                                         impacts
 # Guestrooms           [#]
                                                                                                         Guest travel or
 STR Segment            [list chain scale segment]                                                       consumption offsite
 HDDs                   [#]
 CDDs                   [#]                                                   Quantification Methods
 Function Space         [list Square Footage]                   Source            Emission Factor              Observation
                        [Included/Not Included]
                                                     Refrigerants             WRI HFC and PFC            100-year GWP cycle
 Laundry Wash           [Included/Not Included]                               Emissions Version 1.0
 Restaurant[s]          [Included/Not Included]      Natural Gas              WRI 4.0 Stationary         HHV, Global Factor, Site
 Swimming Pool          [Included/Not Included]                               Combustion                 Energy
 Spa                    [Included/Not Included]      Propane                  EPA Emissions from         HHV, Country Factor, Site
                                                                              Stationary Combustion      Energy
 Fitness Center         [Included/Not Included]
                                                     LPG                      WRI 4.0 Stationary         HHV, Global Factor, Site
 Retail Outlets         [Included/Not Included]                               Combustion                 Energy
 Business Center        [Included/Not Included]      Fuel Oil                 WRI 4.0 Stationary         HHV, Global Factor, Site
                                                                              Combustion                 Energy
                                                     Electricity              WRI 4.1 Stationary         HHV, Country Factor, Site
                                                                              Combustion, EPA eGRID      Energy
                                                                              (USA)
                                                     Steam                    EIA (USA)                  Country Factor, Site
                                                                                                         Energy
                                                     Chilled Water            EIA (USA)                  Country Factor, Site
                                                                                                         Energy


36	                                                                       The Center for Hospitality Research • Cornell University
Appendix F

 DIrect and indirect linkages to indicators developed through the measurement framework

                                                                                Linkages
 Performance                                                                                      Green Seal    LEED
 Indicator (Total,                                            ISO                                 GS-33 5th      EB:      AHLA Green
 PRS, or PSF/PSM) Description          GRI 3.1   CDP 2011    26000      GSTC       Green Key         Ed.        O&M        Guidelines
                       Scope 1 GHG      EN16     8.2, 13.4   6.7.5.2,   D.2.1    Engineering &                   EA
 GHGa                    emissions                           6.5.5.2             Maintenance 2                 Credit
                                                                                                                 6
                       Scope 2 GHG      EN16     8.3, 13.4   6.7.5.2,   D.2.1    Engineering &                   EA
 GHGb                    emissions                           6.5.5.2             Maintenance 2                 Credit
                                                                                                                 6
                       Gross carbon     EN16      11.2,      6.7.5.2,   D.2.1    Engineering &                   EA
 GHGc                    footprint                13.4,      6.5.5.2             Maintenance 2                 Credit
                                                  SM4                                                            6
 GHGd
                        Net carbon      EN16,     14.2a,     6.7.5.2,   D.2.1    Engineering &      3.8.4
                         footprint      EN18       SM4       6.5.5.2             Maintenance 2
                       Direct energy    EN3        12.2      6.5.3.2,   D.1.3    Engineering &                    EA       Guideline
 ENERGYa                   usage                             6.5.4.2,            Maintenance 1,                 Credit        2
                                                             6.7.5.2                  60                       3.2, 3.3
                         Indirect       EN4        12.2      6.5.3.2,   D.1.3    Engineering &                    EA       Guideline
 ENERGYb               energy usage                          6.5.4.2,            Maintenance 1,                 Credit        2
                                                             6.7.5.2                  60                       3.2, 3.3
                       Total energy                          6.5.3.2,   D.1.3     Engineering &                   EA       Guideline
 ENERGYc                  usage                              6.5.4.2,            Maintenance 1,                 Credit        2
                                                             6.7.5.2                   60                      3.2, 3.3
                        Total water     EN8        9.2       6.5.3.2,   D.1.4                       3.8.7       WE         Guideline
 WATERc                   usage                  (Water)     6.5.4.2,                                          Credit         2
                                                             6.7.5.2                                             1


Cornell Hospitality Report • July 2011 • www.chr.cornell.edu  	                                                                         37
Appendix G

    Sample of GHG emissions from air travel between selected cities


                                               Orlando San Francisco   Dallas Boston Phoenix San Diego Amsterdam Chicago Dubai London Shanghai New York Las Vegas
                               Orlando                        4,876    1,928 2,242     3,686     4,576      9,054 2,008 15,964   8,682  16,604    1,868     4,066


                                                                                                                                                                                 ROUNDTRIP AIR DISTANCES (miles)
                               San Francisco       627                 2,956 5,392     1,298       894    10,910 3,682 16,168 10,702    12,266    5,156       824
                               Dallas              326          394            3,102   1,764     2,366      9,806 1,602 16,370   9,466  15,222    2,758     2,140
ROUNDTRIP GHG EMISSIONS (kg)


                               Boston              356          694      391           4,590     5,160      6,888 1,728 13,332   6,508  17,658      374     4,748
                               Phoenix             397          213      296     594               604    11,588 2,876 18,326 10,512    13,564    4,296       510
                               San Diego           720          176      410     666     126              11,648 3,438 18,928 11,758    13,160    4,876       516
                               Amsterdam         1,168        1,280      936     771   1,433     1,397             8,210  6,416    460  11,064    7,262    11,788
                               Chicago             293          466      237     247     390       422        975        15,272  7,878  14,074    1,474     3,022
                               Dubai             2,163        1,640    1,687 1,365     2,422     2,555        615 2,096          6,824   8,010   13,660    17,112
                               London              967        1,028    1,099     776   1,472     1,257        120    870    589         11,474    6,882    11,366
                               Shanghai          2,085        1,410    1,804 2,104     1,623     1,586      1,671 1,748     783  1,112           14,746   13,090
                               New York            259          638      397     115     456       579        858    246  1,253    678   1,735              4,484
                               Las Vegas           650          167      309     611     149       155     1,452     392  1,924  1,211   1,577      533


                    Notes: Calculated using TRX Air Emissions Calculator. http://carbon.trx.com

                    Assumptions
                    •	 Best performing airline used in each instance
                    •	 Economy class seating
                    •	 Statute miles
                    •	 Direct flights where routing available, comparable two-segment flight routes where direct flights not available
                    •	 Radiative forcing included (factor of 2.7)


               38	                                                                                                        The Center for Hospitality Research • Cornell University
Advancing
                                                            Business
                                                          and Personal
                                                   Success        Explore, develop and apply ideas with
                                                                           global hospitality leaders and
                                                                               expert Cornell professors.

                                                                         Professionals from around the world are
                                                                         invited to attend 3-day, 10-day or online
                                                                         courses at the world’s leading institute for
                                                                         hospitality management education in:
                                                                        • Strategic Leadership               • Marketing
                                                                        • Finance                            • Operations
                                                                        • Foodservice                        • Real Estate
                                                                        • Human Resources

                                                                         Visit our website to apply.


                                                                         The Executive Path
                                                                                    Hospitality Leadership Through Learning

                                                                         Complete program information and applications available online:

Cornell Hospitality Report • July 2011 • www.chr.cornell.edu  	          www.hotelschool.cornell.edu/execed
                                                                                                   39
                                                                         Phone + 1 607 255 4919 Email exec_ed_hotel@cornell.edu
Cornell Center for Hospitality Research
Publication Index
www.chr.cornell.edu
Cornell Hospitality Quarterly                                                               Vol. 3 No. 2  The Challenge of Hotel and
                                               Vol. 11 No. 2  Positioning a Place:          Restaurant Sustainability: Finding Profit in
http://cqx.sagepub.com/                        Developing a Compelling Destination          “Being Green,” by Glenn Withiam
                                               Brand, by Robert J. Kwortnik, Ph.D., and
2011 Reports                                   Ethan Hawkes, M.B.A.                         Vol. 3 No. 1  Cautious Optimism:
                                                                                            CHRS Examines Hospitality Industry
Vol. 11, No. 11  Customer Loyalty:
                                               Vol. 11 No. 1  The Impact of Health          Trends, by Glenn Withiam
A New Look at the Benefits of Improving
                                               Insurance on Employee Job Anxiety,
Segmentation Efforts with Rewards
Programs, by Clay Voorhees, Ph.D.,
                                               Withdrawal Behaviors, and Task               2010 Reports
                                               Performance`, by Sean Way, Ph.D., Bill       Vol. 10 No. 18  How Travelers Use
Michael McCall, Ph.D., and Roger
                                               Carroll, Ph.D., Alex Susskind, Ph.D., and    Online and Social Media Channels to
Calantone, Ph.D.
                                               Joe C.Y. Leng                                Make Hotel-choice Decisions, by Laura
Vol. 11, No. 10  Customer Perceptions of                                                    McCarthy, Debra Stock, and Rohit Verma,
Electronic Food Ordering,                      2011 Hospitality Tools                       Ph.D.
by Sheryl E. Kimes                             Vol. 2 No. 1  The Game Has Changed:
                                               A New Paradigm for Stakeholder               Vol. 10 No. 17  Public or Private? The
Vol. 11, No. 9  2011 Travel Industry           Engagement, by Mary Beth McEuen              Hospitality Investment Decision, by
Benchmarking: Status of Senior                                                              Qingzhong Ma, Ph.D. and Athena Wei
Destination and Lodging Marketing              2011 Industry Perspectives                   Zhang, Ph.D.
Executives, by Rohit Verma, Ph.D., and
Ken McGill                                     No. 7  MegaTips 2: Twenty Tested             Vol. 10 No. 16  Best Practices in Search
                                               Techniques for Increasing Your Tips, by      Engine Marketing and Optimization:
Vol 11 No 8  Search, OTAs, and Online          Michael Lynn                                 The Case of the St. James Hotel, by Greg
Booking: An Expanded Analysis of the                                                        Bodenlcos, Victor Bogert, Dan Gordon,
Billboard Effect, by Chris Anderson Ph.D.      2011 Proceedings                             Carter Hearne, and Chris K. Anderson,
                                               Vol 3, No. 7 Improving the Guest             Ph.D.
Vol. 11 No. 7  Online, Mobile, and Text        Experience through Service Innovation:
Food Ordering in the U.S. Restaurant           Ideas and Principles for the Hospitality     Vol. 10 No. 15  The Impact of Prix Fixe
Industry, by Sheryl E. Kimes, Ph.D., and       Industry, by Cathy A. Enz, Ph.D.             Menu Price Formats on Guests’ Deal
Philipp F. Laqué                                                                            Perception, by Shuo Wang and Michael
                                               Vol 3, No. 6  Hospitality Brand              Lynn, Ph.D.
Vol. 11 No. 6  Hotel Guests’ Reactions to      Management Roundtable: Fresh Thinking
Guest Room Sustainability Initiatives, by      about the Box, by Chekitan S. Dev and        Vol. 10 No. 14  The Future of Hotel
Alex Susskind, Ph.D. and Rohit Verma,          Glenn Withiam                                Revenue Management, by Sheryl Kimes,
Ph.D.                                                                                       Ph.D.
                                               Vol 3, No. 5  Building Brands in the
Vol. 11, No. 5 The Impact of Terrorism         Internet Age: Analytics, Loyalty, and        Vol. 10, No. 13  Making the Most of
and Economic Shocks on U.S. Hotels, by         Communication, by Glenn Withiam              Priceline’s Name-Your-Own-Price
Cathy A. Enz, Renáta Kosová, and Mark                                                       Channel, by Chris Anderson, Ph.D., and
Lomanno                                        Vol. 3, No. 4  Brave New World: Online       Radium Yan, D.B.A
	                                              Hotel Distribution, by Glenn Withiam
Vol. 11 No. 4  Implementing Human                                                           Vol. 10, No. 12  Cases in Innovative
Resource Innovations: Three Success            Vol. 3, No. 3  Social Media and the          Practices in Hospitality and Related
Stories from the Service Industry, by Justin   Hospitality Industry: Holding the Tiger by   Services, Set 4, by Cathy A. Enz, Ph.D.,
Sun and Kate Walsh, Ph.D.                      the Tail, by Glenn Withiam                   Rohit Verma, Ph.D., Kate Walsh, Ph.D.
                                                                                            Sheryl E. Kimes, Ph.D., and Judy A.
Vol. 11 No. 3 Compendium 2011                                                               Siguaw, D.B.A
Cornell Center for Hospitality Research
                                                                              Publication Index


                                              Vol. 10, No. 4  Cases in Innovative          2009 Reports
Vol. 10, No. 11  Who’s Next? An Analysis      Practices in Hospitality and Related
of Lodging Industry Acquisitions, by          Services, Set 2: Brewerkz, ComfortDelgro     Vol. 9, No. 18  Hospitality Managers and
Qingzhong Ma, Ph.D. and Peng Liu, Ph.D.       Taxi, DinnerBroker.com, Iggy’s, Jumbo        Communication Technologies: Challenges
                                              Seafood, OpenTable.com, PriceYourMeal.       and Solutions, by Judi Brownell, Ph.D.,  
Vol. 10, No. 10  Cases in Innovative          com, Sakae Sushi, Shangri-La Singapore,      and Amy Newman
Practices in Hospitality and Related          and Stevens Pass, by Sheryl E. Kimes,
Services, Set 3: Cayuga Sustainable           Ph.D., Cathy A. Enz, Ph.D., Judy A.          Vol. 9, No. 17  Cases in Innovative
Hospitality, Chic & Basic, JetBlue Airlines   Siguaw, D.B.A., Rohit Verma, Ph.D., and      Practices in Hospitality and Related
Jumeirah Essex House, The Ritz-Carlton        Kate Walsh, Ph.D.                            Services, Set 1: Aqua by Grandstand,
Hotel Company, Runtriz, The Seaport                                                        Brand Karma, Capella Hotels & Resorts,
Hotel, Thayer Lodging, TripTelevision, and    Vol. 10, No. 3  Customer Preferences         EnTrip, Hotels.com Visualiser, Luggage
Xsense Experiential Design Consulting, by     for Restaurant Brands, Cuisine, and          Club, Royal Plaza on Scotts, Tastings,
Cathy A. Enz, Ph.D., Rohit Verma, Ph.D.,      Food Court Configurations in Shopping        Tune Hotels, and VisitBritain.com, by Judy
Kate Walsh, Ph.D. Sheryl E. Kimes, Ph.D.,     Centers, by Wayne J. Taylor and Rohit        A. Siguaw, D.B.A., Cathy A. Enz, Ph.D.,
and Judy A. Siguaw, D.B.A.                    Verma, Ph.D.                                 Sheryl E. Kimes, Ph.D., Rohit Verma,
                                                                                           Ph.D., and Kate Walsh, Ph.D
Vol. 10, No. 9  Building Customer Loyalty:    Vol. 10, No. 2  How Hotel Guests Perceive
Ten Principles for Designing an Effective     the Fairness of Differential Room Pricing,   Vol 9 No 16   The Billboard Effect:
Customer Reward Program, by Michael           by Wayne J. Taylor and Sheryl E. Kimes,      Online Travel Agent Impact on Non-
McCall, Ph.D., Clay Voorhees, Ph.D., and      Ph.D.                                        OTA Reservation Volume, by Chris K.
Roger Calantone, Ph.D.                                                                     Anderson, Ph.D.
                                              Vol. 10, No. 1  Compendium 2010
Vol. 10, No. 8  Developing Measures for                                                    Vol 9 No 15   Operational Hedging and
Environmental Sustainability in Hotels:       2010 Roundtable Retrospectives               Exchange Rate Risk: A Cross-sectional
An Exploratory Study, by Jie J. Zhang,                                                     Examination of Canada’s Hotel Industry,
                                              Vol. 2, No. 1 Sustainability Roundtable      by Charles Chang, Ph.D., and Liya Ma
Nitin Joglekar, Ph.D., and Rohit Verma,       2009: The Hotel Industry Seeks the Elusive
Ph.D.                                                                                      Vol 9 No 14   Product Tiers and ADR
                                              “Green Bullet.”                              Clusters: Integrating Two Methods for
Vol. 10, No. 7  Successful Tactics for                                                     Determining Hotel Competitive Sets, by
Surviving an Economic Downturn: 	
                                              2010 Industry Perspectives                   Jin-Young Kim and Linda Canina, Ph.D.
Results of an International Study, by         No. 6 The Future of Meetings: The Case
Sheryl E. Kimes, Ph.D                         for Face-to-Face, by Christine Duffy and     Vol 9, No. 13  Safety and Security in U.S.
                                              Mary Beth McEuen                             Hotels, by Cathy A. Enz, Ph.D
Vol. 10, No. 6  Integrating Self-service
Kiosks in a Customer-service System,          No. 5 Making Customer Satisfaction Pay:      Vol 9, No. 12  Hotel Revenue Management
byTsz-Wai (Iris) Lui, Ph.D., and Gabriele     Connecting Survey Data to Financial          in an Economic Downturn: 	
Piccoli, Ph.D.                                Outcomes in the Hotel Industry, by Gina      Results of an International Study, by
                                              Pingitore, Ph.D., Dan Seldin, Ph.D., and     Sheryl E. Kimes, Ph.D
Vol. 10, No. 5  Strategic Pricing in          Arianne Walker, Ph.D.
European Hotels, 2006–2009, by Cathy                                                       Vol 9, No. 11 Wine-list Characteristics
A. Enz, Ph.D., Linda Canina, Ph.D., and       No. 4 Hospitality Business Models            Associated with Greater Wine Sales, by
Mark Lomanno                                  Confront the Future of Meetings, by          Sybil S. Yang and Michael Lynn, Ph.D.
                                              Howard Lock and James Macaulay
                                                                                           Vol 9, No. 10 Competitive Hotel Pricing in
                                                                                           Uncertain Times, by Cathy A. Enz, Ph.D.,
                                                                                           Linda Canina, Ph.D., and Mark Lomanno
w w w. c hr.cornell.edu

Developing a sustainability measurement framework for hotels

  • 1.
    Developing a SustainabilityMeasurement Framework for Hotels: Toward an Industry-wide Reporting Structure Cornell Hospitality Report Vol. 11, No. 13, July 2011 by Eric Ricaurte www.chr.cornell.edu
  • 2.
    Advisory Board Niklas Andréen,Group Vice President Global Hospitality & Partner Marketing, Travelport GDS Ra’anan Ben-Zur, Chief Executive Officer, French Quarter Holdings, Inc. Scott Berman, Principal, Real Estate Business Advisory Services, Industry Leader, Hospitality & Leisure, PricewaterhouseCoopers Raymond Bickson, Managing Director and Chief Executive Officer, Taj Group of Hotels, Resorts, and Palaces Stephen C. Brandman, Co-Owner, Thompson Hotels, Inc. Raj Chandnani, Vice President, Director of Strategy, WATG Benjamin J. “Patrick” Denihan, Chief Executive Officer, Denihan Hospitality Group Brian Ferguson, Vice President, Supply Strategy and Analysis, Expedia North America Chuck Floyd, Chief Operating Officer–North America, Hyatt Gregg Gilman, Partner, Co-Chair, Employment Practices, Davis & Gilbert LLP Tim Gordon, Senior Vice President, Hotels, priceline.com The Robert A. and Jan M. Beck Center at Cornell University Susan Helstab, EVP Corporate Marketing, Back cover photo by permission of The Cornellian and Jeff Wang. Four Seasons Hotels and Resorts Jeffrey A. Horwitz, Chair, Lodging + Gaming, and Co-Head, Mergers + Acquisitions, Proskauer Kevin J. Jacobs, Senior Vice President, Corporate Strategy & Treasurer, Hilton Worldwide Kenneth Kahn, President/Owner, LRP Publications Kirk Kinsell, President of Europe, Middle East, and Africa, InterContinental Hotels Group Cornell Hospitality Reports, Radhika Kulkarni, Ph.D., VP of Advanced Analytics R&D, SAS Institute Vol. 11, No. 13 (July 2011) Gerald Lawless, Executive Chairman, Jumeirah Group Mark V. Lomanno, CEO, Smith Travel Research © 2011 Cornell University. This report may not be reproduced or distributed without Betsy MacDonald, Managing Director, HVS Global Hospitality Services the express permission of the publisher. David Meltzer, Senior Vice President, Global Business Development, Sabre Hospitality Solutions Cornell Hospitality Report is produced for William F. Minnock III, Senior Vice President, Global Operations the benefit of the hospitality industry by Deployment and Program Management, The Center for Hospitality Research at Marriott International, Inc. Cornell University Mike Montanari, VP, Strategic Accounts, Sales - Sales Management, Schneider Electric North America Rohit Verma, Executive Director Shane O’Flaherty, President and CEO, Forbes Travel Guide Jennifer Macera, Associate Director Thomas Parham, Senior Vice President and General Manager, Glenn Withiam, Director of Publications Philips Hospitality Americas Chris Proulx, CEO, eCornell & Executive Education Center for Hospitality Research Carolyn D. Richmond, Partner, Hospitality Practice, Fox Rothschild Cornell University LLP School of Hotel Administration Steve Russell, Chief People Officer, Senior VP, Human Resources, McDonald’s USA 489 Statler Hall Michele Sarkisian, Senior Vice President, Maritz Ithaca, NY 14853 Janice L. Schnabel, Managing Director and Gaming Practice Leader, Marsh’s Hospitality and Gaming Practice Phone: 607-255-9780 Trip Schneck, President and Co-Founder, TIG Global LLC Fax: 607-254-2922 K. Vijayaraghavan (Vijay), Chief Executive, Sathguru www.chr.cornell.edu Management Consultants (P) Ltd. Adam Weissenberg, Vice Chairman, and U.S. Tourism, Hospitality & Leisure Leader, Deloitte & Touche USA LLP
  • 3.
    Thank you toour generous Corporate Members ASAE Foundation Carlson Hotels Hilton Worldwide McDonald’s USA Philips Hospitality SAS STR Taj Hotels Resorts and Palaces TIG Global Partners Davis & Gilbert LLP Deloitte & Touche USA LLP Denihan Hospitality Group eCornell & Executive Education Expedia, Inc. Forbes Travel Guide Four Seasons Hotels and Resorts Fox Rothschild LLP French Quarter Holdings, Inc. HVS Hyatt InterContinental Hotels Group Jumeirah Group LRP Publications Marriott International, Inc. Marsh’s Hospitality Practice Maritz priceline.com PricewaterhouseCoopers Proskauer Sathguru Management Consultants (P) Ltd. Sabre Hospitality Solutions Schneider Electric Thayer Lodging Group Thompson Hotels Travelport Friends Berkshire Healthcare • Center for Advanced Retail Technology • Cruise Industry News • DK Shifflet & Associates • ehotelier.com • EyeforTravel • 4Hoteliers.com • Gerencia de Hoteles & Restaurantes • Global Hospitality Resources • Hospitality Financial and Technological Professionals • hospitalityInside.com • hospitalitynet.org • Hospitality Technology Magazine • Hotel Asia Pacific • Hotel China • HotelExecutive.com • International CHRIE • International Hotel Conference • International Society of Hospitality Consultants • iPerceptions • JDA Software Group, Inc. • J.D. Power and Associates • The Lodging Conference • Lodging Hospitality • Lodging Magazine • LRA Worldwide, Inc. • Milestone Internet Marketing • MindFolio • Mindshare Technologies • PhoCusWright Inc. • PKF Hospitality Research • Resort and Recreation Magazine • The Resort Trades • RestaurantEdge.com • Shibata Publishing Co. • Synovate • The TravelCom Network • Travel + Hospitality Group • UniFocus • USA Today • WageWatch, Inc. • The Wall Street Journal • WIWIH.COM • Wyndham Worldwide
  • 4.
    Developing a Sustainability Measurement Framework forHotels: Toward an Industry-wide Reporting Structure by Eric Ricaurte About the Author Eric Ricaurte works to advance sustainability by helping the world’s leading global hospitality companies measure and report on key issues of corporate responsibility and sustainability (eer3@cornell.edu). He adds this to his 10 years of experience in operations and consulting for hotels, hospitality vendors, tourism operators, attractions, and tourism boards in Latin America. Eric is actively involved as a speaker, roundtable organizer, and writer in the topic of sustainability within the hotel industry. His work includes the first hotel property GRI sustainability report and the first hotel report following the Global Sustainable Tourism Criteria. Eric’s research focuses on standardizing sustainability measurement within hospitality and tourism, beginning as a finalist in the Hotel School’s student research competition in 2001 for his paper titled, “Carbon sequestration, offsetting, and trading, and their relation to travel and tourism.” Eric holds a Bachelor of Science from the Cornell School of Hotel Administration and is a candidate for a Master of Science degree in Tourism Management from New York University. 4 The Center for Hospitality Research • Cornell University
  • 5.
    Executive Summary W hat is the carbon footprint of my hotel stay? Surprisingly, each global lodging company currently provides the answer to this question in a different format, inhibiting aggregate corporate or event travel carbon footprinting and comparison. Third parties have attempted to help answer this question uniformly but their proposals have not gained traction, and no single method for calculation has been widely adopted. The need for uniform carbon footprint calculation of a hotel stay is paramount, yet it is not the only sustainability performance metric. Other issues such as energy, water, and waste are also at the forefront of stakeholder requests and manifested through sustainability reporting and certifications. The emergence of such questions, combined with the global trends of sustainable development and corporate responsibility, point toward a broader need for addressing non-financial performance data collectively and uniformly within the hotel industry. In response to requests from guests, investors, and other stakeholders regarding sustainability, most hotel companies have developed platforms to address these needs. Despite this promising development, the individual chains’ reports, assumptions, and measures are not always communicated uniformly—although it’s clear that stakeholders seek to use the data to make comparisons. Taking a historical context for sustainability measurement within the industry and globally, this report presents a conceptual framework for developing sustainability performance indicators to address present stakeholder requests, as well as others that may arise. The framework developed and tested in this report is designed to provide an avenue for industry collaboration and discussion toward a uniform set of metrics that are highly practical in application. The framework is tested using actual 2010 data from 20 hotels operated by InterContinental Hotels Group, Marriott International, or Wyndham Worldwide, all of which assisted with data collection. The study applied the framework seeking to evaluate the boundaries, quantification methods, and metrics for performance indicators of carbon, energy, water, and waste derived from hotel stays, which currently are the most common requests from external stakeholders. In addition, the practicality of data collection was considered as currently practiced. Based on the study’s methods and results as an example, standard metrics are certainly feasible, yet several issues required for collaborative industry agreement remain. Hotels will need to agree on boundary specifications such as addressing differences in laundry wash handling, the quantification of values such as which emission factors to use and how to allocate rooms versus function space footprints, and the metrics utilized such as per occupied room or per available room. Further issues to enable comparability are discussed. No one catch-all industry benchmark will adequately represent the environmental footprint of hotel stays. Normalization based on amenities or outlets, climate zones, and chain scale segment can help various stakeholders understand the complexity of hotel footprinting, provided that industry collaboration coincides with the proprietary sustainability systems lodging companies are developing internally. Cornell Hospitality Report • July 2011 • www.chr.cornell.edu 5
  • 6.
    COrnell Hospitality Report Developinga Sustainability Measurement Framework for Hotels: Toward an Industry-wide Reporting Structure by Eric Ricaurte “The race to shape sustainability standards will transform the competitive landscape and the social and environmental practices of companies in every industry.”* Foreword In 2009, Professor David Sherwyn, former academic director of the Center for Hospitality Research, responded to a stated hospitalty industry need to address sustainability issues. Working with Eric Ricaurte and other industry participants, Professor Sherwyn organized the first CHR Sustainability Roundtable. We received a extremely positive feedback from the roundtable participants along with the recommendation that CHR should regularly organize sustainability roundtables and undertake research projects to explore different aspects of this complex topic. CHR has also issued a sustainability white paper. During the Cornell Hospitality Research Summit (October 2010) and the second Sustainability Roundtable (November 2010) a diverse group of industry leaders expressed the need for consistent reporting standards for sustainability. Consequently, CHR commissioned a study for which Eric Ricaurte took the lead, with the guidance and assistance of David Jerome, senior vice president of corporate responsibility for InterContinental Hotels Group, Faith Taylor, vice president of sustainability and innovation for Wyndham Worldwide, and Paul Hildreth, director, engineering & facilities management, Marriott International. This study is part of a continuing research effort by CHR on topics related to sustainability, which includes a study supported by Philips Hospitality a CHR Senior Partner, another study supported by PKF Consulting, a CHR Friend, and an ongoing study supported by Schneider Electric, a CHR Partner. We look forward to your continued support and feedback as we continue follow-up research projects on sustainability and other topics of interest and relevance to the industry. Sincerely, Rohit Verma, Ph.D., Professor, Service Operations Management Executive Director, Center for Hospitality Research School of Hotel Administration, Cornell University *Gregory Unruh and Richard Ettenson, “Winning in the Green Frenzy,” Harvard Business Review, November 2010, pp. 110-116. 6 The Center for Hospitality Research • Cornell University
  • 7.
    T he genesis of this paper is the clear need for an industry-wide framework that allows for uniform measurement of the sustainability performance between individual hotel properties and among their parent chains. Hotel companies are well aware of their stakeholders’ interest in the carbon footprint and other aspects of a hotel’s operation, whether that interest stems from their own environmental footprinting, plans to use the hotel’s services, or interest in investing in the property. To that end, most hotel companies have developed their own framework for measuring and communicating environmental footprints and reporting on sustainability. However, as I explain in this paper, the industry lacks a common ground that allows for comparison across hotels and chains. This paper seeks to provide the catalyst for cooperative discourse across the industry to provide a comprehensive measurement scheme that will be at once comprehensive, practical, and intuitive. In outlining and demonstrating the boundaries for such a common comparison framework, I emphasize the need for industry-wide cooperation in establishing a sustainability measure. Nearly every contemporary examination or discussion companies have integral and complex relationships with of sustainability involves some form of performance mea- the stakeholders who define their existence has gained surement and metrics. At the global level, the concept of much ground over the past 30 years since such models ecosystem services is taking hold and framing the context of arose.2 Stakeholder groups are diverse, but sustainability GHG emissions mitigation as one component of Payments for performance requests from clients and investors in particu- Ecosystem Services (PES). Within business, seminal works lar are driving the need for uniform measurement. such as “The Economics of Ecosystems and Biodiversity”1 are As with other industries, hotels are being asked by being used to explore measurable relationships between hu- casual guests and corporate clients alike to quantify the mans and the natural environment. Stock exchanges can trade environmental impact of their stay, often in terms of the sustainability indexes, and investment rating systems now carbon footprint of a room-night and the related consump- include “intangible value” and environmental, social, and gov- tion of energy, water, and waste. Similarly, investors request ernance (ESG) disclosures. The top global companies provide the same information from hotel companies. Consequently, annual sustainability reports using a number of non-financial hotels are among the many companies that produce performance indicators around a framework resembling the sustainability reports that include ESG disclosure. In so triple bottom line, and some companies provide sustainability doing, however, hotels typically provide the information in reports to international bodies to quantify and measure risks diverse formats making it difficult for the client or stake- associated with the driving causes of sustainability’s call. Ad- holder to roll up the data or compare different operations ditionally, investors and clients are asking for precise mea- in any meaningful way. Second, different stakeholders’ sures of a company’s sustainability performance, often right sustainability requests encompass a multitude of issues, im- down to the product level, to provide an understanding of the pacts, and measurements which can only escalate as more environmental footprint of goods and services. Similarly, sup- stakeholders ask more frequent and more diverse questions. ply chain initiatives and indexes have companies asking each For these and other reasons, any standardization of the other for measurable performance data, and consortiums and calculation of the environmental footprint of a hotel stay working groups are collaborating to define how the envi- needs to fit a framework that will satisfy not only today’s ronmental impacts of goods and services may be quantified, questions, but the questions of tomorrow as well. measured, and communicated in labeling and procurement. The hotel industry has no commonly accepted guide- These are the so-called “scope 3” impacts that extend beyond line for disclosing standardized sustainability information immediate operational data. to allow for comparison among properties and companies. Parallel to the emergence of environmental footprinting is the attention paid to engaging stakeholders. The theory that 2 See: Donaldson, Thomas and Lee E. Preston. “The Stakeholder Theory of the Corporation: Concepts, Evidence, and Implications.” Academy of 1 See: www.teebweb.org/. Management Review 20.1 (1995): 65-91 Cornell Hospitality Report • July 2011 • www.chr.cornell.edu 7
  • 8.
    That vacuum maywell be filled by measurement standards ing to the percentage of an item or specification found at the and guidelines developed by third parties with a focus that is property. not hotel-specific, and which did not engage hotel compa- Consumption (usage). The familiar metrics of utility nies themselves as stakeholders in defining the methods. use, consumption of goods and supplies, and generation of This study aims to serve the hotel industry’s need for a waste or discarded materials can be measured directly, or practical conceptual framework for measuring the material indirectly according to the percentage of the different types aspects of sustainability within hotel operations. In doing of consumption. so this study attempts to advance the body of knowledge in Impacts. A typical impact measure is carbon footprint sustainability by developing transparent and clear methods (typically, greenhouse gas emissions), and this category of measuring the most material impacts from hotel opera- includes other impacts on people or the Earth and its ecosys- tions. Hotels, hotel companies, and industry associations tem services. Impacts are measurable through characteriza- will be able to immediately use this framework to build data tion and normalization, and derived from consumption. sets and discuss common acceptance in the immediate areas Although I specify five measurement categories, I must of requests. Furthermore, the framework may be expanded note that the policies, processes, and specifications are often to include other performance indicators and more in-depth measured, but they are usually introduced with the intention parameters for the ones currently examined by using its of reducing consumption and impacts. So a property may points of discussion. have a policy containing showerhead flow rate specifica- tions or lighting wattage which are measured as criteria for Where the Industry Stands reducing energy and water consumption (and in turn carbon Before discussing the measurement framework, I exam- emissions as an impact). Similarly, specification of the per- ine the present state of hotel sustainability measurement centage of FF&E, materials, and supplies with VOCs, toxic, as found in the academic literature; industry initiatives; or non-biodegradable ingredients serves to reduce impacts sustainability certifications, criteria, and guidelines; hotel on environmental health and safety. sustainability reporting; and available third-party resources. My review of existing material identified the following Measurement in Historical Context five general categories of sustainability measurement relating Hotels have long been monitoring and measuring items to hotel operations: policies, processes, specifications, con- now associated with sustainability, and it would be highly sumption (usage), and impacts.3 inaccurate to insinuate that sustainability performance mea- Policies. Whether a hotel has written policies address- surement in the hotel industry is a new concept. The hotel ing specific issues is often measured in a yes-or-no checklist industry has been measuring, benchmarking, and improving format, for example, the presence or absence of a policy performance in areas such as energy, waste, water, indoor regarding sustainable purchasing. The policy may stipulate air quality, noise, and contaminants for nearly 100 years that specific weighting of factors in decision making, provi- we know of.4 Hoteliers did not need environmental groups sions for meeting and updating the criteria, and evaluating or climate change to work on improving energy efficiency. vendors. As just one example, ROI analysis of fluorescent light bulb Processes. The performance of managerial or behavior- change-out is decades old, and original studies had to take al processes is often measured, for example by recording that into consideration the cost of changing the ballast to accom- the green team met at least once a month over a calendar modate a fluorescent. year. Staff training statistics could be tallied, and records Academic studies to measure sustainability in hospitali- kept for practices such as toilet and faucet revision, lighting ty have addressed energy, water, waste, air quality,5 and more procedures, or waste separation. recently GHG emissions. Evaluations of hotel performance Specifications. Also termed technical as a component also have used the ISO 14001 standard to examine energy, of measurement, these criteria are most commonly found waste, and water consumption, applying per-occupied-room as specifications of FF&E or building design. Wide-ranging specifications might include faucet flow rates, efficiency of lighting, and chemical composition of materials. Specifica- 4 D.M. Stipanuk, “The U.S. Lodging Industry and the Environment—A tions are rated according to a yes-or-no checklist, or accord- Historical View, Cornell Hotel and Restaurant Administration Quarterly, Vol. 37, No. 5 (1996), pp. 39-45. 5 Bohdanowicz, Paulina, and Martinac, Ivo (2007). Determinants and 3 Some components adapted from: Eric Ricaurte, “A Guide to Measur- benchmarking of resource consumption in hotels—Case study of Hilton ing Sustainability,” Hotel Sustainable Development: Principles and Best International and Scandic in Europe. Energy and Buildings, 39, 82-95; Practices, ed. A.J. Singh and Hervé Houdré (Washington, DC: AHLA and L.A. Jackson, (2010). Toward a framework for the components of Educational Institute, 2011). green lodging. Journal of Retail and Leisure Property, 9(3), 211-230. 8 The Center for Hospitality Research • Cornell University
  • 9.
    metrics.6 Benchmarking studiesin energy, water, and GHG and studied, notably in benchmarking of energy and water emissions have incorporated per-guestroom, square footage, use.11 HER was built off the Scandic Utility System (SUS), as and per-guest comparisons.7 A key insight from benchmark- developed in 1997.12 In 1990, nearly two decades before IHG ing studies is the variances in normalized utility consump- launched Green Engage, InterContinental (when owned tion among hotels, as well as between company benchmarks by Bass Hotels and Resorts) developed an environmental and individual property performance.8 Several studies ex- operating manual13 with a formalized system of spread- amine the influences of climate on the comparability of hotel sheets tracking utility use comparing against company environmental performance.9 One noticeable oversight in benchmarks.14 Accor rolled out its Environmental Guide for the measurement studies involves the social components of Hotel Managers in 1998, which had guidance on measur- sustainability. Though difficult to measure, some platforms ing and tracking energy consumption against performance have included a social pillar, which has yet to gain industry- benchmarks.15 Rezidor introduced a tool for measuring and wide acceptance.10 reporting consumption in its portfolio,16 and Hyatt has had Though academic studies on sustainability measure- a tracking system for energy and water in place since 1994.17 ment, models, and frameworks exist, they do not neces- The Westin chain has been using Energard Technologies’ sarily address the need for comparisons and common Envision energy accounting system since the mid-’80s, and measurement among properties on a global level in practical in 2000, Starwood (owner of the Westin brand) adopted its industry application. Moreover, most studies did not focus use for all brands in its North America division.18 on carbon emissions, and in any event, no framework or The industry has supported discussion of environ- lodging-specific measurement methodology from academic mental performance for over four decades,19 together with literature has been adopted by the hotel industry or cited in proposed collaborative industry benchmarking initiatives. third-party hotel sustainability criteria. Hotel Energy and Water Consumption Benchmarks was a Despite the lack of standard benchmarks, hotel compa- study performed by David Stipanuk, the AHLA, and the nies have developed in-house environmental performance AHLF, using 2000–01 data from hotels in several major U.S. measurement systems for internal benchmarking and chains.20 The study analyzed energy and water usage per measurement. Prior to its current LightStay program, Hilton property and per square foot by chain scale segment with International’s Hilton Environmental Reporting (HER) regional considerations, demonstrating a variance in energy database was implemented in 2004 and has been highlighted usage depending on a number of factors. As the century began, the World Wildlife Fund and the International Hotels 6 Chan, W. W. (2009). Environmental measures for hotels’ environmental Environmental Initiative began developing an interactive en- management systems. International Journal of Contemporary Hospitality vironmental benchmarking tool and guide for hotels to mea- Management, 21(5), 542-560. sure and compare performance in energy, waste, and water 7 Deng, Shiming (2003). Energy and water uses and their performance ex- planatory indicators in hotels in Hong Kong. Energy and Buildings, 35(8), 11 Bohdanowicz, Paulina, Martinac, Ivo (2007). Determinants and 775-784; and Beccali, M., Gennusa, M. L., Coco, L. L., Rizzo, G. (2009). benchmarking of resource consumption in hotels—Case study of Hilton An empirical approach for ranking environmental and energy saving mea- International and Scandic in Europe. Energy and Buildings, 39, 82-95. sures in the hotel sector. Renewable Energy, 34, 82-90. 12 Bohdanowicz, Paulina. Hilton Environmental Reporting as a tool of 8 Scanlon, N. L. (2007). An analysis and assessment of environmental Corporate Social Responsibility. Royal Institute of Technology. operating practices in hotel and resort properties. International Journal of Hospitality Management, 26(3), 711-723. 13 Faulk, E. Saskia (2000). A survey of environmental management by 9 Chan, W.W. (2005). Predicting and saving the consumption of electricity hotels and related tourism businesses. Paper prepared for presentation OIKOS PhD Summer Academy 2000, University of St. Gallen. in sub-tropical hotels. International Journal of Contemporary Hospital- ity Management, 17(3), 228-37; Redlin, M.H. and de Roos, J.A. (1980). 14 IBLF & WWF. (2005). Why Environmental Benchmarking Will Help Gauging energy savings: further applications of multiple-regression Your Hotel. London: International Business Leaders Forum. analysis. Cornell Hotel and Restaurant Administration Quarterly, 20.4, 15 Ibid. 48-52; Zmeureanu, R.G. (1994). Energy performance of hotels in Ottawa. 16 Ibid. ASHRAE Transactions, 100(1), 314-22; and Bohdanowicz, Paula, Marti- nac, Ivo (2007). Determinants and benchmarking of resource consump- 17 See: Hyatt Earth Website, tion in hotels—Case study of Hilton International and Scandic in Europe. www.hyattearth.com/our_progress/tracking_measurement.html. Energy and Buildings, 39, 82-95. 18 Information received via Gus Newbury, Vice President, Engineering, 10 See: Houdré, Hervé (2008). Sustainable Hospitality©: Sustainable Starwood Hotels & Resorts Worldwide, Inc. Development in the Hotel Industry. Cornell Hospitality Industry Per- 19 Stipanuk, D.M. (1996), The U.S. lodging industry and the environ- spectives, August, 4-20; and Levy, Stuart E., Duverger, Philippe (2010). ment—A historical view. Cornell Hotel and Restaurant Administration Consumer Perceptions of Sustainability in the Lodging Industry: Exami- Quarterly, 37(5), 39-45. nation of Sustainable Tourism Criteria. International CHRIE Conference- Refereed Track. Paper 31. http://scholarworks.umass.edu/refereed/CH- 20 David M. Stipanuk, AH&LA Energy Management and Conservation RIE_2010/Friday/31 Guide (Washington, DC: American Hotel and Lodging Association, 2001). Cornell Hospitality Report • July 2011 • www.chr.cornell.edu 9
  • 10.
    Exhibit 1 Commonperformance indicators in lodging firms’ Global Reporting Initiative • Programs related to training and professional development (LA11) All 9 reports disclosed qualitative information on: • Initiatives to reduce GHG emissions (EN18) • Energy consumption (EN3 or EN4) • (Some form of) initiatives to reduce energy consumption and the reductions achieved (EN5 or EN6) 8 of 9 reports disclosed performance on: • Water usage or withdrawal (EN8) • Composition of the organization’s governance bodies and breakdown of labor force by indicators of diversity (LA13) • Scope 1 and 2 GHG emissions (EN16) 7 of 9 reports disclosed performance on : • The size of their workforce by type (LA1) • Percentages of workforce receiving performance reviews (LA12) consumption,21 as well as GHG emissions.22 The WWF also industry agreement. Within this dialogue, diverse responses highlighted other potential environmental performance to stakeholder requests exist. The two most commonly dis- indicators for tourism vacation footprinting such as average cussed approaches, certification and sustainability reporting, earthshare and consumption of meat.23 Neither the tool nor were developed outside of the industry and serve some but the footprinting methods gained traction, however, and the not all stakeholder requests for sustainability performance. hotel benchmarking initiative has not been active lately. Measures of non-financial performance in hotels have moved One substantive change of recent years is that the well beyond internal portfolio comparisons and ROI calcula- terminology for discussing the topics has coalesced. Prior tions. One primary evolution of measurement has been the to the 1960s, hotel environmental issues were addressed by inclusion of carbon emissions as a key performance indicator. their own individual categories.24 More recently, individual Like its 1980s’ predecessor, ozone depletion, the global dis- factors are grouped under the rubric of sustainability, which cussion on GHG emissions and climate change has urgently embraces a broad scope of metrics. spotlighted non-financial performance indicators on a global scale, to the point where the entire world now has a collective Shifting Drivers of Measurement performance target of 350 parts per million of CO2 in the The chief difference in today’s dialogue and measurement atmosphere.25 frameworks stems from increased stakeholder requests, including investors, shareholders, governments at all levels, Corporate Responsibility and Sustainability and corporate clients and other organizations. Questions Reporting relating to measurements of environmental and social In response to stakeholder requests, in 2008 and 2009 all of aspects have proliferated in RFPs to hotels at both property the top 100 U.S. companies by revenue, and 80 percent of and corporate levels. the Global Fortune 250 companies produced sustainability These concerns underscore the hotel industry’s need reports disclosing ESG performance, based on the Global to adopt a uniform approach to measuring and quantify- Reporting Initiative (GRI).26 This GRI content is developed ing the various aspects of sustainability, and communicate based on stakeholders’ requests. them to stakeholders. In some cases the measurement Specific to the topic of climate change and GHG emis- methodology is dictated, but others require collaborative sions, the Carbon Disclosure Project (CDP) surveyed 3,000 organizations worldwide,27 and added questions regarding 21 Dodds, Rachel. Why Environmental Benchmarking will help your hotel. London, UK: The Prince of Wales International Business Leaders Forum (IBLF), 2005. 25 For more information see www.350.org. 22 See: www.benchmarkhotel.com, which is no longer in use by the 26 Brown-Smatlan, A. & Sparks A. (2010, May 12). The Evolution of organizations mentioned. Greenhouse Gas Reporting by Business: Addressing Product and Supply 23 WWF-UK Business and Consumption Unit (2002). Holiday Foot- Chain Emissions. Presentation through KPMG & WBCSD. Los Angeles & printing: A Practical Tool for Responsible Tourism. WWF-UK. Geneva. 24 Ibid. 27 Carbon Disclosure Project. (2011). CDP: What we do. Retrieved April 14, 2011, from https://www.cdproject.net/en-US/WhatWeDo/Pages/over- view.aspx. 10 The Center for Hospitality Research • Cornell University
  • 11.
    Exhibit 2 Presenceof measurement criteria in hotel certifications and guidelines Waste Toxicity / Generation Food and Biodegradability GHG Energy Water and Materials Beverage of Cleaning Guest Criteria Emissions Usage Usage Disposal Purchasing items Supplies Satisfaction GSTC       Green Key       Green Seal      (GS-33) LEED (EB):       O&M AHLA     = Directly stated;  = Implied or precursor water use in 2010, similar to carbon reporting. As of 2009 its own methodology, and the criteria for these schemes are approximately nine global hotel companies produced GRI generally transparent and publicly available. reports and six had responded to a CDP questionnaire. As One outcome of the industry’s interest in certification shown in the evaluation in Exhibit 1 (previous page), these is apparent in the establishment of the Global Sustainable nine hotel GRI reports typically involved the following per- Tourism Criteria (GSTC) and its initial objectives of helping formance indicators:28 energy consumption and reduction, to harmonize tourism sustainability certification platforms. water use, and diversity indicators. In addition, although The GSTC stipulates that tourism businesses should measure only five reports disclosed performance on total waste their guest satisfaction, purchases of disposable and con- (EN22), all reports contained sections on waste minimiza- sumable goods, energy consumption, water consumption, tion with some form of localized or per-unit waste data. and GHG emissions, as well as non-diverted waste. While Most noteworthy in my evaluation of GRI reports is the lack the GSTC takes into account the broad range of tourism of standardization in reporting. For example, intensity of us- businesses, it does not, however, specify instructions on age, when disclosed, can be found in values per square meter, how the boundaries of measurement or the metrics will be per guest night, per occupied room, per room-night, and delineated in each sector. Although the GSTC aims to be a per hotel, without specific definitions of what exactly the de- framework for use by many stakeholders including certifica- nominators represent. Furthermore, specific documentation tion bodies, it does not delve into technical specifications is lacking on what resources have been used in calculating which are needed for standardization of measurement. Nor GHG emissions, or the emissions factors used in perform- do the predominant hotel certifications found in the U.S. ing the calculation. Therefore although two companies may completely adhere to the GSTC. declare the same metric, the boundaries of the denominator In North America, the three most prevalent certifica- may differ. For a list of reporting companies and a full break- tion frameworks in hotels are Green Key, Green Seal, and down of metrics found in GRI reports, see Appendix A. the USGBC’s LEED, modified for use by hotels. In another approach, the American Hotel and Lodging Association de- Certifications veloped its Green Guidelines as criteria applicable for hotel Sustainability certifications of various types have proliferated operations. These most closely resemble the criteria found in the past two decades. For hotels, the advantage of certifi- in the dozens of state-level certifications. An analysis finds cation lies in the certification’s ability to validate the hotel’s that the certifications and guidelines consistently call for sustainability efforts and serve as a response to stakeholders’ measurement of consumption or impacts in energy, waste, sustainability concerns, using one label with which the stake- water, and GHG emissions, as shown in Exhibit 2. Only four holder is already familiar. Each certification scheme carries additional criteria are mentioned as specifically necessitating 28 Evaluation includes Marriott, IHG, Accor, NH, Jumeirah, Sol Meliá, measurement, albeit not consistently. In addition, internal Rezidor, Taj, and Hong Kong & Shanghai Hotels. Accor reported ac- performance measurement as a component of a broad-based cording to French disclosure requirements and not GRI Framework, but management platform is also common. Much like the GSTC, provided a linkage document for its report to the GRI guidelines. however, specific technical protocols or guidelines for quan- Cornell Hospitality Report • July 2011 • www.chr.cornell.edu 11
  • 12.
    corporate responsibility guidelines.In addition, 35 sector- Exhibit 3 specific initiatives are listed and cross-evaluated. Travel ISO 26000 subjects and practices and tourism is listed as a sector, with only two initiatives mentioned: the ECPAT Code of Conduct and the GSTC. Of Core Subjects the 15 core subjects and practices available per ISO 26000, Organizational governance ECPAT addresses only three, and GSTC touches on five. Human rights Sustainability certification and sustainability reports Labor practices notwithstanding, the current gap in making an appropri- ate response to stakeholders’ sustainability requests lies in The environment providing specific hotel performance data that provides a Fair operating practices product-level quantification of an environmental footprint. Consumer Issues Since corporate travel is a driver of GHG emissions and Community involvement and development other environmental impacts, companies tracking their own environmental footprints are asking hotels for data relating Practices to their hotel stays; meetings and events clients also wish Recognizing social responsibility to know the environmental footprint of the rooms and the Stakeholder identification and engagement event they are booking; and even some transient guests want to know the carbon footprint of their hotel stay. The relationship of an organization’s characteristics to social responsibility Performance Measurement Understanding the social responsibility of an organization Although the complexity of variables among hotels can Integrating social responsibility throughout an organization constrain the usefulness of wide-scale benchmarking,29 the industry still needs a uniform measurement scale. This could Communication on social responsibility begin with the type of effort that created the GRI, which Enhancing credibility regarding social responsibility provides the opportunity and forum for different industrial Reviewing and improving an organization’s actions and practices sectors to develop sector-specific supplements through col- related to social responsibility laborative, transparent, multistakeholder efforts. Fifteen such Note: Adapted from ISO 26000 supplements have been developed or are in development at present.30 None addresses hotels, and additional sector supplements will not be developed in the near future. tification are lacking. The only exception is LEED certifica- The Greenhouse Gas Protocol Corporate Accounting tion, which specifies measurements by square footage but and Reporting Standard is the most widely accepted and ref- not room-nights. erenced guide for quantifying and reporting GHG emissions, Certification criteria do not always match stakeholder and the corresponding ISO 14064 standard also provides concerns. First, the multitude of certifications worldwide guidance on quantification. Both resources are, however, inhibits the uniformity in criteria that stakeholders seek. targeted at the organizational level, and a draft of the GHG Second, certifications do not generally stipulate disclosure protocol does not specifically spell out how a hotel property of performance as part of their criteria and thus do not offer would quantify the carbon footprint of a hotel stay. The standardized guidance on measurement methods. Finally, Climate Registry General Reporting Protocol comes much not all certifications call for measurement of the same per- closer by providing guidance, quantification methods, and formance indicators. My examination of certifications found emissions factors for facility-level reporting. It even gives them to be relatively narrow within the overall umbrella of an example of how a hotel chain might quantify the carbon corporate responsibility and sustainability. footprint of the organization,31 but the example is cursory By contrast, the comprehensiveness of sustainability and does not provide comparative metrics at the product topics can be seen in ISO 26000, which offers guidance on the subjects and practices for integrating social responsibility, 29 Bohdanowicz, Paulina, and Martinac, Ivo (2007). Determinants and as shown in Exhibit 3. ISO 26000, however, explicitly states benchmarking of resource consumption in hotels—Case study of Hilton that it is a guidance document and not a standard to be used International and Scandic in Europe. Energy and Buildings, 39, 82-95. 30 Global Reporting Initiative. (2011). Sector Supplements. Retrieved for certification purposes, and nowhere does it mention hotels. This standard examines 40 separate cross-sectoral April 14, 2011, from http://www.globalreporting.org/ReportingFrame- work/SectorSupplements/. initiatives including reporting frameworks and certification 31 Climate Registry. (2008). General Reporting Protocol, v 1.1. Los schemes, evaluating the content of each with regard to its Angeles. 12 The Center for Hospitality Research • Cornell University
  • 13.
    level. To date,no global chain-affiliated hotel property has widely available. Portfolio Manager’s national-level focus reported to the Climate Registry. also makes quantification problematic at global levels. Just Because of the cost of energy, businesses of all types as regional EnergyStar data are adjusted for region in the have monitored energy use for decades, and consequently U.S., comparisons among several nations would require energy use measurement has seen the best attempts at application of some sort of coefficient of adjustment or other standardization. Most relevant for hotels is the EPA Energy normalization factors. Star Portfolio Manager, which may well be the only envi- One can use Portfolio Manager to track operational ronmental performance measurement tool that is relatively water consumption, but GHG emissions can be calculated available and used within the hotel sector. Offering a tool to only by inference. Energy site-source calculations are taken track and measure energy and water use, Portfolio Man- at national averages, but carbon emissions from purchased ager also calculates GHG emissions for buildings and offers electricity are taken using emission factors from regional uniform boundaries and metrics which enable comparisons. grid characteristics. Even though water is tracked, no In addition to being utilized as a component of LEED EB mention of a similar site-source consideration for a water certification, Energy Star itself also serves as another type footprint is mentioned. of certification available for hotels. Well known in the U.S. While we can expect to see more interest in water sus- in a number of contexts, Energy Star is used by many state tainability quantification, there is no single standard to date. and local governments as a platform for disclosing energy The World Business Council for Sustainable Development performance of buildings.32 (WBCSD) offers a Global Water Tool which enables analysis Portfolio Manager provides insight as to some key ele- of water usage at an organizational level. This tool offers ments necessary for achieving success as a standard for mea- metrics developed based on country-specific resources, and surement. First, it offers a publicly available quantification it distinguishes among types of water, but it is not product method which is derived from public data. Second, it offers specific. The most comprehensive examination of water in a uniform boundaries and metrics which enable comparisons, sustainability measurement context is the Water Footprint with extensive guidance on how the boundaries and metrics Assessment Manual, which provides a range of guidance and are set. Both the boundaries and guidance are tailored for quantification for water footprints at various levels, at all life different types of facilities, including hotels. Third, it offers a cycle stages, and for different types of water resources (e.g., common, freely available software platform. Finally, it repre- green water, blue water, and grey water).34 sents an important advancement toward a type of rating or Current performance measurement within hospitality is index for hotel sustainability. widely used for other types of performance indicators, with Portfolio Manager also has several distinct limitations the work of Smith Travel Research as a signal example. The for application in global hotel sustainability measurement. It hotel industry is effectively addicted to measuring, track- was not designed for hotels, it was not designed for global ing, benchmarking, and utilizing performance indicators of use, and it was designed only to address energy use. As an ADR, occupancy, and RevPAR. Each metric comes with a example of these issues, Portfolio Manager’s metrics are well-defined and agreed-upon set of boundaries and quan- rendered per square foot, which can be helpful for building tification rules that enable comparability. Industry capacity, operators, but not for would-be guests attempting to account capability, and willingness to collaborate on performance for the impact of a room-night. Its calculation methods, measurement clearly exist, and drawing upon their currently moreover, did not test occupancy as one of the 32 indepen- accepted metrics for performance comparison can ease the dent variables. Though it has robust data in aggregate, its adoption of sustainability indicators. rating model was developed using 2003 CBECS data from This review of various sustainability rubrics delineates 142 U.S. properties, and was tested with 64 properties.33 the breadth of topics that must be considered for an inte- One would not expect that the U.S. EPA would cre- grated sustainability measurement. For the lodging industry, ate an international application, but the fact is that for the the current lack of standard does not mean that standardiza- purpose of benchmarking, international hotel data are not tion attempts do not exist, or that industry discussion and collaboration are not taking place. At a global level industry 32 See: www.energystar.gov/ia/business/government/State_Local_Govts_ Leveraging_ES.pdf. 34 Hoekstra, A. Y., Chapagain, A. K., Aldaya, M. M., Mekonnen, M. M. 33 Environmental Protection Agency (2009, February). Energy Star Per- (2011). The Water Footprint Assessment Manual: Setting the Global formance Ratings Technical Methodology for Hotel. Standard. Washington, DC: Earthscan. Cornell Hospitality Report • July 2011 • www.chr.cornell.edu 13
  • 14.
    Exhibit 4 Sustainabilitymeasurement framework roundtables are discussing the topic,35 and working groups requires a second data entry or interface, which would repre- for developing standard sustainability performance metrics sent an extra step for hotel companies. are currently underway. In addition, third parties have de- Despite all the research and development in both aca- veloped their own quantification methods or benchmarks to deme and the industry, no transparent third-party, academic, provide uniform solutions for carbon footprinting of hotel or industry method for uniformly measuring and communi- stays. One goal of such solutions is to provide a calculation cating the sustainability performance of hotel stays has so far of the corresponding carbon offsets. Some travel agents, tour been both clearly defined and widely adopted. At the same operators, and back-of-house travel services providers also time, the convergence of increased stakeholder inclusiveness, provide carbon footprint calculations for travel that includes technological advances, and global issues relating to sustain- hotel stays. Sustainability reporting firms also have made able development and the future well-being of society points attempts to define methods and produce relevant metrics in clearly to the need for uniformly measuring and communi- property-level sustainability reports.36 Finally, opportunistic cating the most salient performance indicators. Such efforts carbon firms have attempted to fill the gap in uniformity by can serve as a roadmap toward standardization of sustain- offering proprietary quantification methods and indexes. ability performance measurement. For example, should a Hotel companies have so far been reluctant to adopt GRI Hotel Sector Supplement be convened in two years, third-party solutions due to the lack of transparent and the same methods and discussion can be carried forward industry-engaged boundary and quantification or rating to facilitate discussion in a larger context and with a more methods, the limited scope of sustainability metrics, the inclusive approach. risk of extravagant fees resulting for large chains, and the The Measurement Framework implausibility of handing over invaluable occupancy data— and also because they have already invested substantial time To address the lack of an overall sustainability measurement and effort into developing their own sustainability software rubric, I offer the framework presented in Exhibit 4 as a platforms. Third-party calculation of performance metrics means of identifying, refining, and standardizing perfor- mance sustainability indicators both now and in the future.37 35 Sherwyn, David ed. (2010). The Hotel Industry Seeks Elusive “Green Bullet.” Cornell Hospitality Roundtable Proceedings, 2(1). 36 See: Willard InterContinental Washington, DC, 2007 and 2008 sustain- 37 See: United Nations World Commission on Environment and Develop- ability reports. ment. (1987). Our Common Future. Oxford: Oxford University Press. 14 The Center for Hospitality Research • Cornell University
  • 15.
    Dimensions and Aspects buildings within the context of the human experience.44 The Two overarching considerations were used to structure the integration of quality of life indicators within hospitality and framework: specific guidance from existing guidelines relat- tourism performance measurement is advantageous given ing to sustainable development, and general guidance from the travel industry’s contribution to one’s quality of life— considerations about quality of life. The framework proposes usually with less resource consumption than purchasing to include the full range of potential performance indicators goods for quality of life purposes. relating to sustainable development. Non-financial perfor- Boundaries mance indicators for sustainability reporting based on the Once a particular aspect has been defined, its boundary and GRI guidelines and ISO 26000 encompass aspects relating to its measurement need to be set. For example, environment is organizational governance, society and communities, prod- a general aspect that encompasses dozens of specific topics uct responsibility, labor practices, human rights, and the (including most of those described as ecosystem services), environment.38 Aspects already stipulated within the GRI yet it is a necessary categorization for framing the issues. are provided with robust protocols, specific methodology Within environment, the specific topics can be chosen as references, and relevance to sustainable development. Such areas of focus. indicators are more readily transferrable to a hotel platform. The boundary also refers to the lines drawn along the To ensure practical future application, the framework chain of operations and life cycle of the service. Sustainabil- also includes measurements related to quality of life, and ity implies a holistic approach to understanding the inter- the resulting performance indicators. Though less specific related impacts of human activities. It is necessary to define or directly transferrable, measurement relating to quality specific boundaries for performance measurement as they of life should be included if sustainability is to be achieved. are not as clear as those of financial accounting. The matter Non-financial measurements of life satisfaction, well-being, of boundary issues is comprehensively discussed in the and happiness are seen as performance indicators that when GHG protocol and GRI guidelines. harnessed can help society make transitions toward sustain- able living.39 Such non-financial measurements have been Quantification Methods put forth in several instances, including the Happy Planet The second step for developing sustainability performance Index,40 Bhutan’s Gross National Happiness,41 and the Qual- indicators is to define the quantification methods, which ity of Life Index,42 as well as academic and other institu- present definitional issues similar to boundaries in that tions studying this type of performance measurement.43 some quantification methods are widely accepted and More closely related, the USGBC has begun to study green others are disputed. Emission factors, coefficients, and the terms of quantification should be transparently defined and communicated. Timeliness is key here as emission factors will change and evolve over time and are not always agreed 38 For a complete list of disclosures and performance indicators, see the upon. As examples, the GWP of methane and nitrous oxide GRI guidelines at www.globalreporting.org. changed over the course of IPCC annual reports, and the 39 World Business Council for Sustainable Development (2010). Vision GHG emissions from air travel vary in how they are quanti- 2050: The New Agenda for Business. Washington, DC. fied (in a range from 1.9 to 2.7) based on the application of 40 Abdallah, S., Thompson, S., Michaelson, J., Marks, N. and Steuer, N. radiative forcing.45 This type of quantification assumption (2009). The (un)Happy Planet Index 2.0: Why Good Lives Don’t Have to Cost the Earth. London: New Economics Foundation. should be defined and communicated in any measurement 41 Braun, A. A. (2009). Gross National Happiness in Bhutan: A Living protocol. Example of an Alternative Approach to Progress. Wharton International Metrics Research Experience. Retrieved from Wharton University of Pennsylva- nia: http://repository.upenn.edu/cgi/viewcontent.cgi?article=1077&conte Finally, the metrics used to monitor, track, and commu- xt=wharton_research_scholars; and Revkin, A. (2005, October 4). A new nicate performance require clear definition. In hotels, the measure of well-being from a happy little kingdom. The New York Times. framework’s metrics begin as a function of the hotel facility Retrieved from http://www.nytimes.com/2005/10/04/science/04happ. html?_r=2&pagewanted=all. 42 Economist Intelligence Unit. (2005). The Economist Intelligence Unit’s 44 Pyke, C., McMahon, S., Dietsche, T. (2010). Green Building and quality-of-life index. The Economist: The World in 2005. Retrieved from Human Experience: Testing Green Building Strategies with Volunteered http://www.economist.com/media/pdf/quality_of_life.pdf Geographic Information. Washington, DC: U.S. Green Building Council. 43 Inter-American Development Bank. (2008). Beyond Facts: Under- 45 For more information see Penner, J.E. et al. (eds.) (1999), Aviation and standing Quality of Life (Executive Summary). Cambridge: Harvard the Global Atmosphere. A Special Report of IPCC Working Groups I and University Press; and Joseph Stiglitz, Amartya Sen, Jean-Paul Fitoussi III in collaboration with the Scientific Assessment Panel to the Montreal (2009). The Commission on the Measurement of Economic Performance Protocol on Substances that Deplete the Ozone Layer. Cambridge (UK): and Social Progress. Cambridge University Press. Cornell Hospitality Report • July 2011 • www.chr.cornell.edu 15
  • 16.
    as the basicunit of measurement. All data exist primarily per practicality of data collection and quantification methods for hotel, with subsequent calculations based on a rational ru- arriving at the performance indicators. bric, including square feet or square meters, rooms, or guests. To test the practicality and usefulness of the defined As appropriate, hotel units may be aggregated to measure performance indicators, the study examined 2010 data from overall performance and footprint. Metrics chosen are di- 20 hotel properties affiliated with InterContinental Hotels rectly correlated to the nature of the stakeholder request. Group, Marriott International, or Wyndham Worldwide. The data comprised a variety of segments and global regions. Framework Application Participating properties completed a 65-item questionnaire, The framework is carried out by first identifying the perfor- asking which data were available, how data points were mance measurement components and then defining filters measured (including the existence of sub-metering and sub- of boundaries, quantification methods, and metrics. The category specificity), and the actual values. Data were then following two key considerations are necessary for the re- analyzed to produce and compare the performance indica- sulting performance indicators to reach any type of industry tors among the properties, with feedback from the three agreement: collaboration and practicality. Collaboration firms on the study method and results. in the hotel industry has existed for decades on numerous issues, and it seems clear that the industry is further willing Dimensions and Aspects to collaborate on sustainability and corporate responsibility The environment aspect of sustainable development measures. Let me underline the concept of collaboration. It included the commonly cited indicators, GHG emissions, seems that the previous attempts at standardizing sustain- energy, water, and waste. These were limited entirely to con- ability metrics by third parties failed specifically because sumption and impact areas of sustainability measurement, they developed a method and then attempted to impose because measurement is more straightforward and more it upon the industry. As I pointed out, most major hotel easily agreed on than such matters as policies, processes, and companies have already developed internal methods for specifications, which were not included. The wide range of performance measurement. But the lack of collaboration in criteria falling under those latter categories would delay the platform development has brought the industry to where process of collaborative effort and industry standardization it is today, unable to uniformly communicate sustainability for the purposes of this study. performance to external stakeholders and thus pressured to To obtain data for these areas to develop performance accept a third-party solution. indicators the following data points were collected (in addi- Any solution needs a high degree of practicality. It tion to data on property profile and qualitative information should take into account the availability of property data on facilities and outlets): and the scientific and technical data or resources available 1. Energy usage, for quantification and calculation, and it should address the 1.1 Fuels burned on-site (separated by fuel type), issue of specific, granular data collection versus benchmark 1.2 Electricity, values based on materiality thresholds. Just because obtain- ing data or scientific information about certain issues is cur- 1.3 Municipal Steam, rently impractical does not mean that such indicators should 1.4 Renewable Energy Certificates (RECs) purchased, be abandoned. As a precursor to indicator development, 2. Water usage, however, collaboration with peers, stakeholders, and the 2.1 Municipal water, supply chain should be sought to help advance the practical- 2.2 Municipal chilled water, ity of data collection. 2.3 Well water, Framework Application and Study Design 3. Waste tonnage, Based on the conceptual framework, I conducted a study to 3.1 Diverted (separated by category as available), develop aspects, boundaries, quantification methods, and 3.2 Non-Diverted, metrics for comparable indicators for the most commonly 4. Refrigerant usage for refilling of cooling equipment cited hotel sustainability performance factors. Three major (separate by refrigerant type), industry organizations participated and helped evaluate the 5. Carbon Offsets purchased. 16 The Center for Hospitality Research • Cornell University
  • 17.
    Boundary Specification instances of data collection, while a calendar year data set only requires one data point. Property Operations Recognizing that utility billing is not uniform in month- Specifications for the boundary of GHG emissions and the ly cut-off dates and shifts depending on when meters are like were driven by the purpose of the study, which was to read or on which dates days of the week fall, the study used determine the measurement units resulting from property one of two methods: operations. Therefore the consumption data and resulting 1. Using the 12-period data set closest to January–Decem- environmental impacts in GHG emissions were considered ber, usage was to be divided by the number of days in from the operation of the building, and not its life cycle or the 12 periods, and then the resulting value was multi- its supply chain. As a consequence, the following were not plied by 365 to arrive at an annual figure proximate to included: the calendar year; or • Consumption and resulting GHG emissions from the 2. Using each period on the beginning and final ends of construction and remodeling of the building; the calendar year, each instance was to be divided by • Consumption by the guest when outside the property the usage by the number of days within the period, and (e.g., air or ground travel to the hotel); then the value multiplied by the number of days occur- ring within the calendar year of the billing period. As an • Consumption by corporate offices or regional staff that example, usage billed from December 10, 2009, through operates outside the building, though they are necessar- January 9, 2010, would be divided by 31 and then multi- ily involved in the overall functioning of the hotel; or plied by 9 to arrive at the January value. • Consumption from operations of vendors or suppliers. The boundary of utility consumption and environ- mental impacts followed the Greenhouse Gas Protocol’s Data as Boundary definition of scope, using scope 1 (direct emissions) and 2 For the purpose of this study, the utility data submitted were (indirect emissions) only, and not considering scope 3 emis- the same data analyzed. No consideration was made as to sions (those of third parties), as specified in the quantifica- the operational or financial control of any outlets, facilities, tion section below. Rationale for limiting the study to scope amenities, or other public spaces that may be included in 1 and 2 was drawn from the following considerations: the utility data but are technically outside the hotel man- 1. Scope 3 emissions from hotel operations is invariably agement’s operations. Inclusion of outlets and facilities was complex, given the inputs of materials, labor, and guests, analyzed qualitatively in the study to determine which are and would require extensive data gathering; generally included and which, if any, are sub-metered. Likewise, if a property resold any energy to a third party 2. The same invariability would inhibit uniform quantifica- or its original provider and that had not been adjusted in the tion and measurement by hotels to stakeholders in the data provided, then it was not reflected in the analysis. Con- short- and mid-term, undermining the current basic versely, if a property outsourced operations such as laundry, needs and requests of the same stakeholders; then utility consumption from those outsourced services 3. The difficulty in scope 3 emissions standardization in were not included because they were not represented in the hotel environmental footprinting is compounded by utility bills presented. No validation of the data were sought, the issues of uncertainty and lack of a widely accepted so the actual data were analyzed, regardless of whether they standard regarding quantification of GHG emissions a included minute instances of fuel burning such as from (PAS 2050:2008 exists in the UK for product footprint- shuttle services, landscaping, or small heating stations. ing, but ISO 14067 and the GHG Protocol Corporate Data were collected on an annual basis, for the previous Value Chain and Product Accounting and Reporting calendar year of operations. Collecting and analyzing data Standards are not finalized to date); and on an annual basis by calendar year allowed for uniform comparison and smoothed fluctuations based on weather 4. Once scope 1 and 2 data are available for all vendors and demand seasonality. In the case of a new property or and life cycles of products, they can be readily aggre- a property that underwent a significant renovation, data gated to determine their overall materiality. were collected for the prior 12-month period rather than Consumption of energy and water and waste generation the calendar year. In addition to consistency of seasonal all followed the same considerations for scope. As a result, fluctuations, a calendar year is preferable in this case to a operational GHG emissions, utility consumption, and waste rolling 12-month period because the latter would require 12 generation were not included in the study’s boundary as associated with: Cornell Hospitality Report • July 2011 • www.chr.cornell.edu 17
  • 18.
    1. Treatmentof wastewater effluent, electricity (Scope 2), 2. Water purification of purchased potable water, 3. Emissions resulting from purchased heat and steam, 3. Offsite IT servers, and chilled water (Scope 2), and 4. Employee commutes, 4. Fugitive emissions (Scope 1). 5. Travel of property employees, The following stipulations were used in quantifying 6. Corporate, regional, and satellite facilities, GHG emissions: 7. Guest travel, 1. Site energy was used (as opposed to source energy) for fuel and electricity consumption; 8. Guest consumption off-site, 9. Vendors and suppliers, 2. GHG emissions are expressed in carbon dioxide equiva- lent (CO2e); 10. Outsourced laundry wash, 3. Fuel emission factors were converted at high heating 11. Life cycles of materials and supplies used in ongoing values (HHV); operations, and 12. Life cycles of durable materials and supplies (i.e. FF&E). 4. Emission factors were prioritized as follows: 1. Global (universal), Quantification 2. National, and The predominant resource for GHG emissions quantifica- tion and inventorying is provided by the World Resources 3. Regional, provincial, or state factors; Institute (WRI) and its Greenhouse Gas Protocol. These cite 5. WRI emission factors were used as the primary source the Intergovernmental Panel on Climate Change (IPCC) on when available; and certain methods and data, but the IPCC does not provide 6. Country-sourced emission factors were used when WRI the tools or guidelines for national, corporate, or facility emission factors are not available. inventory calculation. While many countries will use their own greenhouse gas inventories to arrive at default emis- 1. Burning Fossil Fuels sions factors, others use the WRI’s guidelines for GHG The following six fuel types generally consumed in hotel inventories. This includes national or regional bodies (such operations were included in GHG emissions calculation: as the Climate Registry in North America). natural gas, gasoline, diesel, propane, fuel oil (including six Greenhouse Gases subtypes), and liquefied petroleum gas (LPG) and some of its subtype mixes of propane, liquid propane, and butane. In accordance with the Greenhouse Gas Protocol, the fol- GHG emissions from fuel burning were calculated by mul- lowing gases were considered greenhouse gases in emissions tiplying the consumption of each fuel type by its emission inventories: factor. • Carbon Dioxide (CO2), For the quantification of GHG emissions from fuel • Methane (CH4), burning, the standard unit of measurement used was metric • Nitrous Oxide (N20), tons of carbon dioxide equivalent (Mt CO2e) for aggregate • Hydrofluorocarbons (HFCs), values, and later normalized as kilograms of carbon dioxide • Perfluorocarbons (PFCs), and equivalent (kg CO2e) when the value was less than one met- • Sulfur Hexafluoride (SF6). ric ton. Although data regarding each fuel source were gath- Because hotel operations do not generally emit per- ered in distinct units of measurement, the most convenient fluorocarbons or sulfur hexafluoride those two gases were approach was to convert all fuel consumption to a single not included in this study. Although water vapor has been unit (i.e., MBtu or kWh) for GHG emissions quantification characterized as a greenhouse gas and many hotels emit and then convert that result to kg upon final calculation. As water vapor as part of waste heat from cooling towers, the fuels are often provided in different forms from the utility waste heat is considered surface-level and not atmospheric, provider, conversion factors were applied, although conver- and therefore this vapor was not quantified. sion values vary per source of conversion data.46 For the previously delineated boundary and scope, the Emissions Factors from Fuel Burning following sources of GHG emissions in a hotel’s operation The WRI’s Stationary Combustion Tool Version 4.0, using were included in the quantification of a carbon footprint: emission factors from the IPCC Guidelines for National 1. Emissions resulting from the burning of fossil fuels (Scope 1), 46 U.S. Department of the Interior BTUs Conversion Table. http://www. 2. Emissions resulting from the generation of purchased doi.gov/pam/eneratt2.html. 18 The Center for Hospitality Research • Cornell University
  • 19.
    Exhibit 5 GHGemissions (commercial and institutional sector) using high heating values of fuel Fuel Type Mt CO2/MBtu Mt CH4/MBtu Mt N2O/MBtu kg CO2e/MBtu Natural Gas 0.053272 0.0000047480 0.0000000950 53.4011432 Motor Gasoline 0.0694625 0.0000100235 0.0000006014 69.8594371 Liquefied Petroleum Gases (LPG) 0.0599191 0.0000047480 0.0000000950 60.0482732 Residual Fuel Oil (Fuel Oil No. 5) 0.0775815 0.0000100235 0.0000006014 77.9784316 Source: World Resources Institute (2008). GHG Protocol tool for stationary combustion. Version 4.0. Exhibit 6 Direct greenhouse gas emission factors, using high heating values of fuel Fuel Type kg CO2/MBtu kg CH4/Mbtu kg N2O/MBtu kg CO2e/MBtu Propane 63.0667 0.0105419 0.0006325 63.484124 Liquid Propane 63.1620 0.0105419 0.0006325 63.579457 Fuel Oil No.1 73.1500 0.0105419 0.0006325 73.567457 Fuel Oil No.2 73.1500 0.0105419 0.0006325 73.567457 Fuel Oil No.4 73.1500 0.0105419 0.0006325 73.567457 Diesel 73.1500 0.0105419 0.0006325 73.567457 Source: U.S. Environmental Protection Agency, Climate Leaders Program, Direct Emissions from Stationary Combustion Sources, Appendix B (May 2008) in U.S. Environmental Protection Agency, Greenhouse Gas Inventory and Tracking in Portfolio Manager (August 31, 2009). Greenhouse Gas Inventories, identifies the GHG emission the process of generating and distributing electricity at the factors in common fuel types, as found in Exhibit 5. In the source, not from its consumption onsite. Electricity con- United States, the EPA provides the emission factors shown sumed on property that was generated onsite through com- in Exhibit 6. bined heat and power (cogeneration) was not considered As a result, GHG emissions from fuel burning were here because it would have been accounted for in connec- quantified by multiplying the amount of fuel consumed in tion with fuel burning. MBTU by its corresponding emission factor (WRI when Electricity consumption was provided in kWh, which is available, U.S. EPA otherwise), and then converting the ag- directly convertible to GHG emissions by multiplying con- gregate units to arrive at a value of GHG emissions in sumption in kWh by the corresponding country emission Mt CO2 units, as outlined in the following equation: factor, which is driven by the wide range of fuel mixes used EF kg CO2e 1 kg to generate the electricity and power plant efficiency. France FT MtCO2e = nMBTU × × for example has countrywide emission factor of .085 kg of 1 MBTU 1000 Mt CO2 per kWh of electricity produced, while China’s emission Where: FT = GHG emissions from fuel type factor is .788 kg of CO2 per kWh.47 Country emission factors n = volume of fuel consumption (CO2 only) from electricity generation as available from the EF = Emission Factor WRI GHG Protocol Tool for Stationary Combustion are in Appendix B for reference. GHG emissions from purchased 2. Purchased Electricity electricity in the U.S. were quantified by multiplying the GHG emissions from purchased electricity are indirect amount of kWh consumed by .000593718. emissions (scope 2) because using the electricity drives its production, but the greenhouse gases are emitted during 47 Calculated using the GHG Protocol tool for stationary combustion, World Resources Institute (2009), Version 4.0. Cornell Hospitality Report • July 2011 • www.chr.cornell.edu 19
  • 20.
    To convert theemission factors to Mt CO2/kWh: identified by the Energy Information Administration are as follows: EC MtCO2e = • Absorption chiller: 0.0665 MtCO2e/MBTU, and 1 kWh EF lb CO2e 1 kg 1 Mt nkWh × × 1 MWh × × • Engine-driven chiller: 0.04433 MtCO2e/MBTU. 1000 MWh 2.2 lb 1000 kg For electric-driven chillers, the emission factor again depends on the fuel mix used to generate electricity, which Where: is multiplied by .238095 in the U.S. Following the same EC = GHG emissions from electricity arguments as outlined above in quantifying emissions from n = amount of electricity consumption EF = Country Emission Factor purchased electricity, GHG emissions from purchased elec- tric-driven chilled water in the U.S. were to be quantified by 3. Purchased Steam and Hot or Chilled Water multiplying the amount of MBTU consumed by 0.04155978. As is the case with electricity, energy required to generate For emission factors by country, the Energy Informa- steam, hot water, and chilled water which is purchased by tion Administration offered guidance on determining the hotel is included as a Scope 2 emission. Also similar to emission factors in foreign countries by multiplying their electricity, emission factors for purchased steam or water electricity emission factors (expressed in MT CO2/MWh, vary by country and region. The WRI provides guidance on kg CH4/ton-hour, and kg N2O/ton-hour of cooling pur- how such inventories and emission factors may be calcu- chased) by 0.921, using its foreign electricity emission fac- lated, but does not provide country data or emission factors. tors. Those factors, however, are dated 1999–2002; therefore The U.S. Energy Information Administration provided ge- the WRI country electricity emission factors can be substi- neric emission factors for steam and chilled water based on tuted for more accurate data. national averages under its Voluntary Reporting of Green- 4. Fugitive Emissions house Gases initiative. Steam or hot water emission factors were provided without country-specific distinction. Emissions from substances with significant global warming potential (GWP), such as those found in refrigeration equip- Steam and Hot Water ment, were included in the quantification of a hotel’s carbon Emission factors for steam and hot water are dependent on footprint. This includes chillers, decentralized air condition- how the water was heated and distributed. According to ing units, and F&B temperature-regulated storage. Common the U.S. Energy Information Administration, the national refrigerants are HFC-22 (R-22), HFC-123, HFC-134a, R- emission factor used in inventory accounting for purchased 410a, and R-404a. Though the operational use of these gases steam and hot water in the U.S. is 96.952 kgCO2e /MMB- themselves does not generate GHG emissions, their leakage TU.48 To normalize the unit of measure: into the atmosphere constitutes fugitive emissions, a Scope 1 1 kg EF kg CO2e source of GHG emissions according to the Greenhouse Gas SE MtCO2e = nMMBTU× × 1 MMBTU Protocol.49 1000 Mt In hotel operations the data from fugitive emissions Where: were gathered not necessarily when the leakage occurs, but SE = GHG emissions from steam when the equipment’s refrigerant was refilled through cor- n = amount of steam consumption rective maintenance on property. If refrigerant was recycled EF = Country Emission Factor by the vendor without actual leakage, then it was not count- ed, since offsite use of the gas is not within the specified As a result, GHG emissions from purchased steam scope. Likewise, this amount does not refer to the amount of in the U.S. were quantified by multiplying the amount of refrigerant circulating in the cooling equipment. MBTU consumed by 0.096952 to arrive at a value of GHG Emission factors for refrigerants are specified by emissions in Mt CO2e units. engineering and scientific organizations. Emission factors Chilled Water used for quantification in this study represent the GWP over Considerations for chilled water are similar to those of a 100-year lifespan of the gases in the atmosphere. A full purchased steam or electricity. Because natural gas may be list of refrigerants and their GWP is found in Appendix C. either absorption or engine-driven, the U.S. benchmark GHG emissions from fugitive refrigerant were quantified by domestic chilled water emission factors for natural gas as multiplying the amount (in Mt) of each refrigerant replaced 48 Instructions for Form EIA-1605, Voluntary Reporting of Greenhouse Gases, Energy Information Administration, Department of Energy. Oc- 49 World Resource Institute & World Business Council for Sustainable tober 15, 2007. Appendix N; Emissions Benchmarks for Purchased Steam Development (2004). The Greenhouse Gas Protocol: A Corporate Ac- and Chilled/Hot Water. counting and Reporting Standard. Geneva: Earthprint Limited. 20 The Center for Hospitality Research • Cornell University
  • 21.
    (because of leakage)by its GWP, then summing the GHG into the GHG emissions quantification. The energy gener- emissions from each, to arrive at a value of GHG emissions ated on-site from renewable sources was to be quantified in Mt CO2 units. in the same unit of measurement as the other fuels burned. Second, energy consumed by chilled water or fuel would GHG Emissions Reductions need conversion to units of energy (but not GHG emissions) For the purposes of this study, emission reductions repre- in the case that it were provided in volume. sent purchases of Renewable Energy Certificates (RECs) For energy usage, the three units of measurement for only within the data set period and not reductions achieved providing energy data were MBTU, kWh, and J. Given the from one period against another. Data for RECs purchased prevalence of electricity use in hotels, kWh was used as the through a utility provider were collected in kWh of RECs unit of measurement. purchased for inclusion in the final carbon footprint calcula- To measure energy usage in the data set, the following tions. If a property generated renewable energy on-site, then calculations were performed: the energy usage was later accounted for in the subsequent energy quantification section. A. ∑ FBkWh + ∑ RFBkWh = Direct Energy Usage The CO2e reductions resulting from the RECs pur- B. ∑ ECkWh + ∑ PSkWh + ∑CWkWh = Indirect Energy Usage chased are generally only applicable to the energy source C. A + B = Total Energy Usage they generate (in most cases electricity). Therefore the same emission factors are applied to the kWh of RECs within Where: the same category of the energy source emissions they are reducing. Multiplying the emission factor by the Mt of kWh FB = Fuel Burned will produce the value of CO2e reduced. RFB = Renewable Fuel Burned EC = Purchased Electricity Carbon Offsets PS = Purchased Steam and Hot Water Carbon offsets as a form of GHG emissions mitigation CW = Purchased Chilled Water were tallied in Mt CO2e purchased so they may be included in final carbon footprint calculations. Carbon offsets are Note that RECs and carbon offsets do not enter into mitigation techniques however, and are not directly associ- energy usage calculations as they do not represent reduc- ated with fuel purchase or grid systems from which the hotel tions in actual usage. sources its energy. Water Usage GHG Emissions Calculation Four instances of water usage were addressed, as follows: Using the four categories of GHG emissions source data 1. Purchased steam or hot water, above, the following calculations were performed: 2. Purchased chilled water, A. ∑ FBCO2e + ∑ FECO2e - ∑ REC1CO2e = Scope 1 GHG Emissions 3. Purchased water, and B. ∑ ECCO2e + ∑ PSCO2e + ∑ CWCO2e - ∑ REC2CO2e = Scope 2 GHG Emissions 4. Well water withdrawn C. A + B = Gross Carbon Footprint Of these four, the first two were addressed in terms of D. C – COCO2e = Net Carbon Footprint the energy requirements for their heating and cooling, and Where: not water usage. For the scope of the study, the first two FB = Fuel Burned categories of water usage above do not factor into water FE = Fugitive Emissions consumption because they were assumed to be in a closed EC = Purchased Electricity loop system with the district, and thus no water gains or PS = Purchased Steam and Hot Water losses occur. Water withdrawals occurring for purchased CW = Purchased Chilled Water district water, chilled water, or steam were beyond the scope of the study, and therefore water withdrawal data refers only REC1 = Scope 1 Renewable Energy Certificates to water withdrawn onsite. REC2 = Scope 2 Renewable Energy Certificates Data on water consumption were collected based on CO = Carbon Offsets the values of water used on property, and not the values of Energy Usage water treated by the district. Sub-metering for irrigation and The same data collected for GHG emissions boundary and cooling tower vapor may present a discrepancy in the water quantification were used to calculate the hotel’s energy usage if not property counted, as both are instances of water performance, with two additions. First, also considered was usage and should be counted (but not double counted). any renewable energy generated onsite that did not factor Cornell Hospitality Report • July 2011 • www.chr.cornell.edu 21
  • 22.
    For water usage,the common units of Exhibit 7 measurement for providing water data were Potential sustainability performance metrics Cubic Feet (Ft3), Cubic Meters (M3), Liters (l), and Gallons (g). M3 was used as the unit Aggregate ÷ Metric Unit = Performance Metric Measure of aggregate measurement, converted to liters Scope 1 GHG Emissions ÷ Available Rooms = Scope 1 GHG Emissions PAR as the unit in normalized metrics. Scope 2 GHG emissions ÷ Available Rooms = Scope 2 GHG emissions PAR To measure water usage in the data set Gross Carbon Footprint ÷ Available Rooms = Gross Carbon Footprint PAR once normalizing the units of measurement, Net Carbon Footprint ÷ Available Rooms = Net Carbon Footprint PAR the following calculations were performed: Direct Energy Usage ÷ Available Rooms = Direct Energy Usage PAR A. Purchased district water, Indirect Energy Usage ÷ Available Rooms = Indirect Energy Usage PAR B. Well water withdrawn, and Total Energy Usage ÷ Available Rooms = Total Energy Usage PAR C. A + B = Total Water Usage. Purchased District Water ÷ Available Rooms = Purchased District Water PAR Well Water Withdrawn ÷ Available Rooms = Well Water Withdrawn PAR Waste Generation Total Water Usage ÷ Available Rooms = Total Water Usage PAR The definition of performance metrics for Diverted Waste ÷ Available Rooms = Diverted Waste PAR waste is much more extensive than those for Non-Diverted Waste ÷ Available Rooms = Non-Diverted Waste PAR energy, water, or carbon because of the broad Total Waste ÷ Available Roos = Total Waste PAR scope of materials covered within the waste Scope 1 GHG Emissions ÷ Occupied Rooms = Scope 1 GHG Emissions POR stream and the lack of data currently avail- Scope 2 GHG emissions ÷ Occupied Rooms = Scope 2 GHG emissions POR able. Waste data were not considered within Gross Carbon Footprint ÷ Occupied Rooms = Gross Carbon Footprint POR the operational boundary for the scope 3 car- Net Carbon Footprint ÷ Occupied Rooms = Net Carbon Footprint POR bon emissions or any associated energy flows. Direct Energy Usage ÷ Occupied Rooms = Direct Energy Usage POR Likewise, water extracted from organic waste Indirect Energy Usage ÷ Occupied Rooms = Indirect Energy Usage POR was not addressed in boundary or quantifica- Total Energy Usage ÷ Occupied Rooms = Total Energy Usage POR tion definitions. Purchased District Water ÷ Occupied Rooms = Purchased District Water POR Well Water Withdrawn ÷ Occupied Rooms = Well Water Withdrawn POR The most common quantification is the Total Water Usage ÷ Occupied Rooms = Total Water Usage POR tonnage of waste, whether landfilled, burned, Diverted Waste ÷ Occupied Rooms = Diverted Waste POR or diverted. This serves both as a quantifica- Non-Diverted Waste ÷ Occupied Rooms = Non-Diverted Waste POR tion method as well as a metric, although Total Waste ÷ Occupied Rooms = Total Waste POR studies have shown that diverted waste data Scope 1 GHG Emissions ÷ Rooms Sold = Scope 1 GHG Emissions PRS are not always readily available.50 Further- Scope 2 GHG emissions ÷ Rooms Sold = Scope 2 GHG emissions PRS more, consumption and impacts related Gross Carbon Footprint ÷ Rooms Sold = Gross Carbon Footprint PRS to different types of diverted waste lessen Net Carbon Footprint ÷ Rooms Sold = Net Carbon Footprint PRS the significance of a catch-all category of Direct Energy Usage ÷ Rooms Sold = Direct Energy Usage PRS diversion. The study therefore sought out to Indirect Energy Usage ÷ Rooms Sold = Indirect Energy Usage PRS qualitatively assess the availability of waste Total Energy Usage ÷ Rooms Sold = Total Energy Usage PRS data, understanding that issues of quantifica- Purchased District Water ÷ Rooms Sold = Purchased District Water PRS tion, boundary, and metrics needed further Well Water Withdrawn ÷ Rooms Sold = Well Water Withdrawn PRS study for final performance metrics to be Total Water Usage ÷ Rooms Sold = Total Water Usage PRS Diverted Waste ÷ Rooms Sold = Diverted Waste PRS determined. Non-Diverted Waste ÷ Rooms Sold = Non-Diverted Waste PRS Metrics Total Waste ÷ Rooms Sold = Total Waste PRS A critical issue for a lodging industry sus- Scope 1 GHG Emissions ÷ Square Feet = Scope 1 GHG Emissions PSF tainability measure is to render it in terms Scope 2 GHG emissions ÷ Square Feet = Scope 2 GHG emissions PSF that are appropriate to hotel operation. In Gross Carbon Footprint ÷ Square Feet = Gross Carbon Footprint PSF Net Carbon Footprint ÷ Square Feet = Net Carbon Footprint PSF particular, since stakeholders have requested Direct Energy Usage ÷ Square Feet = Direct Energy Usage PSF measurements of sustainability-related data Indirect Energy Usage ÷ Square Feet = Indirect Energy Usage PSF as connected to their hotel stays, annual Total Energy Usage ÷ Square Feet = Total Energy Usage PSF Purchased District Water ÷ Square Feet = Purchased District Water PSF 50 Chan, W. W. (2009). Environmental measures for Well Water Withdrawn ÷ Square Feet = Well Water Withdrawn PSF hotels’ environmental management systems. Interna- Total Water Usage ÷ Square Feet = Total Water Usage PSF tional Journal of Contemporary Hospitality Manage- Diverted Waste ÷ Square Feet = Diverted Waste PSF ment, 21(5), 542-560. Non-Diverted Waste ÷ Square Feet = Non-Diverted Waste PSF Total Waste ÷ Square Feet = Total Waste PSF 22 The Center for Hospitality Research • Cornell University
  • 23.
    values of GHGemissions and usage are not relevant to their Exhibit 8 specific data request. Therefore the measurements need to be converted into Sample composition metrics that are: Sample Composition 1. comprehensible and relevant to the stakeholder; Economy Luxury 2. common throughout the industry; Midscale 3. representative of individual consumption; 4. practical for calculation and communication; and Upper Upscale Upper 5. incentivizing in improving performance across all sus- tainability aspects. Midscale Four potential values of performance metrics were identified for common use. Their application in sustainabil- ity measurement is derived from dividing any of the above GHG emissions, energy, water, and waste values by common Upscale industry metrics: Rooms available—the total rooms available (room inven- tory) during the calendar year (i.e., impact per available room or PAR); CDDs), although the percentage of responses diminished Rooms sold—the total rooms sold during the calendar year as the questions became more detailed (i.e., gross floor area, (not including comp rooms or no-shows) (or impact average square footage per guestroom, square footage of per room sold or PRS); function space, occupied rooms). Though nearly every hotel Rooms occupied—the total rooms occupied during the reported rooms sold in the period, less than half provided calendar year (sold rooms + comp rooms) (or impact the occupied room count (rooms sold + comp rooms). Less per occupied room or POR); and than half of the properties specified the facilities and ameni- ties (other than laundry) that were included in the utility Area—the total area of the building (or impact per square totals. Most hotels reported total water but most properties feet, PSF, or per square meter, or PSM). did not report water usage broken down into sub-categories The only additional denominators considered were per of district water, well water, or chilled water. guest or per guest-night. A per-guest metric may be relevant Fourteen hotels responded to waste questions. Of to activity within the hotel (e.g., a meeting), but not neces- those, 11 were able to report waste data in tonnage, but only sarily for a room-night. Should a per-guest value be request- four hotels were able to provide waste diversion rates. Two ed, it is easier to divide a room-based metric by the number hotels diverted organic waste through composting. Though of guests (as is the same case in ground and air transporta- diversion rates were reported, only one property was able to tion) to arrive at the corresponding value rather than build provide actual diverted waste (in cubic yards). No properties a metric around the number of guests and extrapolate to a provided diverted waste data by specific stream. per-room metric. This study examined the potential perfor- No hotels had purchased RECs or carbon offsets. mance metrics shown in Exhibit 7, on the previous page. Boundaries Study Results Boundary variations arose in the data collection. For exam- ple, four hotels included data on utility consumption from Data outsourced amenities such as cafés and restaurants. Of the Hotel data represented every STR chain scale segment four, three were sub-metered. The difficulties in verifying the (except independent), in every major climate zone. As facilities and amenities included in utility totals also present shown in Exhibit 8, the sample was represented most heavily boundary variations. Though laundry and swimming pools by upscale and upper upscale properties. Although most were easily verified, other facilities that could affect perfor- hotels were in the U.S., the data included nine international mance metrics (such as a fitness center, spa, or a gift shop or properties across Europe, the Middle East, and Asia. All other retail outlets) were not commonly specified. hotels reported number of guestrooms, chain scale seg- Finally, of the 19 hotels reporting whether laundry was ment, and heating and cooling degree days (HDDs and included in consumption totals, six hotels reported that they Cornell Hospitality Report • July 2011 • www.chr.cornell.edu 23
  • 24.
    Exhibit 9 Numberof respondents per survey question Percent of Respondents Reporting 100% 80% 60% 40% 20% 0% Number of Heating Degree … Number of available room… Cooling Degree Days Total Energy (MBTU) Water LPRS Gross floor area (m2) Total Energy kWhPRS Total Energy (kWh) Total GHG MtCO2e Total GHG kgPRS Total GHG kg/Ft2 Number of rooms sold in 2010 Total GHG kgPAR Water L/FT2 Total Direct GHG (Scope 1) Water LPAR Total Water Consumption (m3) Swimming Pool Total Energy kWH/Ft.2 Total Energy kwhPAR washed linens and towels in-house, and four hotels out- GHG emissions per available room ranged from 3kg to sourced their laundry to a third-party vendor. I note, howev- 75kg, or 4.4kg to 76kg per room sold. Ranges and variances er, that laundry was included in the twelve hotels’ utility con- in energy consumption mimicked those of GHG emissions, sumption. This indicates the possibility that laundry could which is not surprising given their strong connection. Water have been included in consumption totals even though it variances did not show as much of a range or deviation as was outsourced. The variances of energy, water, and GHG energy or GHG emissions, ranging from 565 to 1,117 liters performance metrics due to in-house vs. outsourced laundry PAR, or 846 to 1,673 liters PRS. The mean increment in oc- wash are discussed below, although any conclusion is tenu- cupied rooms sold was .7%. In the highest case, the occupied ous because of the limited data sample. (Exhibit 9 specifies room count was 1.5 percent higher than the count of rooms the number of respondents to each question.) sold. Though smaller through segment filters, when sepa- Performance Metrics rating the hotels out by STR chain scale, the ranges and Some form of per available room or per square measure variances also lessen. This is logical since similar properties values were available for all 20 hotels. Per-room-sold values (i.e., comp sets) of rate categories may have similar attributes. were possible for 17 hotels, yet per-occupied-room values Any type of benchmarks taken from the study may be more were only available for 8 hotels in the data set. Performance representative by chain scale. varied widely among properties, as did property size and The study did not include year-over-year performance chain scale. The breakdown by metric and chain scale seg- to allow for analysis of fluctuations in values due to oc- ment can be found in Appendix E. cupancy changes. However, it is clear that PAR and PSR 24 The Center for Hospitality Research • Cornell University
  • 25.
    Exhibit 10 Sample data Number of Number of available Heating Cooling room Number of Number of Gross floor area Degree Degree nights in rooms sold Chain scale segment guestrooms m2 Days Days 2010 in 2010 Economy (n=1) 56 1755.77 4226.00 1237.00 20440.00 12604.67 Midscale (n=2) 143 7659.58 3008.50 2912.00 52052.00 30748.00 Upper Midscale (n=2) 683 41409.72 2036.00 2111.00 249026.50 101643.00 Upscale (n=10) 289 27525.86 1502.30 4040.40 103882.30 84789.89 Upper Upscale (n=2) 908 84886.95 2101.00 1607.00 331968.00 228314.00 Luxury (n=3) 530 52731.99 2504.33 2645.67 193120.00 131762.00 Total (n=20) 400 35156.14 2052.65 3141.90 145235.80 99487.04 Total Total Total Total Energy Total Energy Energy Energy Energy Chain scale segment (MBTU) (kWh) kwhPAR kWhPRS kWH/Ft.2 Economy (n=1) 1206.63 353643.64 17.30 28.06 18.71 Midscale (n=2) 5125.43 1502179.02 28.68 49.13 18.15 Upper Midscale (n=2) 44814.11 13134263.38 54.91 66.12 32.76 Upscale (n=10) 25947.15 7604673.46 72.94 100.60 40.84 Upper Upscale (n=2) 72578.85 21271643.46 64.02 93.06 27.06 Luxury (n=3) 65577.08 19219542.60 89.35 127.76 31.56 Total (n=20) 36141.77 10592546.16 64.19 91.03 32.66 Total Water Consumption Water Water Swimming Chain scale segment (m3) Water LPAR LPRS L/FT2 Pool Economy (n=1) 0 Midscale (n=2) 16886.72 335.41 546.69 214.19 1 Upper Midscale (n=2) 105743.25 213.19 454.76 246.82 1 Upscale (n=10) 72609.32 102661.48 827.59 271.23 9 Upper Upscale (n=2) 126709.09 355.04 516.15 145.11 2 Luxury (n=3) 190498.32 648.60 1247.31 312.42 1 Total (n=20) 97120.45 48532.05 807.70 254.08 14 Concluded on next page metrics cannot be used interchangeably. A summary of the parameter issues. It is interesting to note that among the four sample data is found in Exhibit 10, on this page and the next. hotels reporting waste diversion rates, top performance in Regarding waste, performance was difficult to evaluate diversion rates was not correlated with performance in waste given the lack of response and boundary or quantification generation, suggesting that diversion rates alone may not be Cornell Hospitality Report • July 2011 • www.chr.cornell.edu 25
  • 26.
    Exhibit 10 Sample data Total Direct Total GHG Total GHG Total GHG Total GHG Chain scale segment GHG (Scope 1) MtCO2e kgPAR kgPRS kg/Ft2 Economy (n=1) 35.38 130.06 6.36 10.32 6.88 Midscale (n=2) 96.14 674.81 12.81 22.10 8.10 Upper Midscale (n=2) 966.15 5476.78 21.18 22.08 12.46 Upscale (n=10) 724.82 4502.87 34.18 46.74 18.39 Upper Upscale (n=2) 1983.41 8149.79 24.17 35.13 10.15 Luxury (n=3) 1511.32 7788.07 36.40 52.62 12.82 Total (n=20) 938.10 4918.65 27.72 39.01 13.85 Exhibit 11 Analysis of waste measurement Metric Hotel A Hotel B Hotel C Hotel D Diversion Rate 39.2% 16% 21% 21% Total Waste PAR 2.97 1.40 3.24 1.72 Total Waste POR N/A 2.01 4.65 2.49 Total Waste PRS 3.33 2.01 4.71 2.50 Total Waste PSF 1.92 0.95 1.07 0.89 the most appropriate indicator of performance to communi- ing or renovating the hotel was not considered. Second, cate consumption and impacts (Exhibit 11). although the study applied the calendar year expenses to the extent possible, a rolling 12-month average or quarterly Discussion update as the standard data boundary may be more relevant The variations in performance indicator values clearly to a stakeholder request if monthly calculation is practical. demonstrate the need for more precise footprinting than a catch-all value used in generic carbon calculators. Using Facility-Level Data one generic industry-wide average and multiplying by the The study only took into account facility-level data, not number of room-nights to footprint a stakeholder’s hotel considering the upstream or downstream footprints. Need- stays would be no more valid than applying a single daily less to say, if every business, including the hotel’s suppliers, rate for all room-nights. These findings underline the need measured Scope 1 and 2 emissions in aggregate and normal- for collaborative agreement on the performance metrics. The ized metrics, then hotels would not have to calculate scope following discussion outlines the points where agreement 3 emissions themselves. Therefore if hotels would measure would benefit the industry as it attempts to tell its sustain- the scope 1 and 2 emissions from operations in a uniform ability story. metric for their clients, and then require the same from their suppliers, then the goal of measurement and comparability Boundary would be more effectively addressed. A sustainability mea- Several boundary issues merit further discussion. To begin sure might include the effects of the parent brand’s structure. with, capital expenditures are not included because these If a hotel company were to enter into a large-scale carbon measures are intended to address operating impacts. Though offsetting scheme or REC initiative, one would have to a hotel’s P&L includes debt service, the “environmental debt determine how to distribute the effects of reductions among service” of amortizing or allocating the footprint of build- constituent properties. 26 The Center for Hospitality Research • Cornell University
  • 27.
    Likewise, the utilitydata were analyzed as submitted, nities when they are charged in addition to the room rate.51 with an overall assumption of a data-as-boundary parameter. At still other properties, guests pay a resort fee or similar No distinctions were made for facilities or amenities and amount in addition to the room rate, and those guests are how those may have affected performance or been allocated not quoted an á la carte rate for amenities chosen. Likewise to third-party operators. As an example, laundry data were all the public areas, FF&E, and aesthetics are included in the treated as reported, even though some operations washed value proposition and contribute to the footprint, regardless laundry in-house and others outsourced. Some hotels of whether the guest expressly appreciates these amenities. included utility usage from the laundry and others did not. Finally, the reductions in footprints if guests reduced Drawing a boundary of only operational control may skew their consumption at the margin may be negligible when footprints depending on how laundry is handled. This is one considers the energy and water used in public areas. especially important considering the ubiquitous linen-reuse Beyond that issue, small changes in the guest-stay footprint programs now in place. To turn around and indicate that a may also disappear when an entire trip is considered, given footprint did not include laundry data because it was out- the components that make up the carbon footprint of travel. sourced may seem counterintuitive (or even disingenuous) In that light, even the proportion represented by lodging is to stakeholders. negligible in comparison to the transportation. As shown in The matter of how to record laundry impacts provides Appendix G, emissions from flying to the destinations of ho- key insight to the importance of agreement regarding tel location in the data set ranged from 115 kgCO2e to 2,555 inclusion of data from amenities and facilities. Some are kgCO2e. When comparing the mean carbon footprint of handled by the hotel operator, and some are outsourced, the air emissions with the mean footprint of hotel stays per and the structure is never uniform across all hotels. As well, room sold (assuming a 3-night stay), the hotel stay repre- most operations do not have sub-metered utility billing and sented 13 percent of the carbon footprint. This was without will need agreement on how to allocate or disaggregate data accounting for the footprint of ground transportation, or any as needed. Perhaps the best way to frame this boundary related business event. Therefore, even if the guest and hotel issue is to bear in mind the stakeholder perception of guest combined to reduce by 15 percent the guests’ consumption- consumption. based footprint for the hotel stay, that would account for less With regard to the footprint of a guest stay, it seems than a 2-percent change in the total travel footprint. clear that basing performance indicators on average con- It should be noted that the above arguments are sumption is the preferable approach, rather than attempt to intended for the discussion of industry-wide performance account for what hotel features the guest did or did not use. indicator development, and not value creation for the guest. In fact, at the moment it is impractical to provide guest-spe- Certainly options and possibilities exist to engage with cific data(e.g., whether the guest used the pool, or turned on guests, use innovative technology, and create pricing struc- the room air conditioner). The sub-metering and monitor- tures that add value to the guest experience. Those discus- ing systems required to confirm actual use and consumption sions are, however, outside the boundaries of standardizing would be a technological, financial, and operational burden. the carbon footprint calculation of a hotel stay. Moreover, consumption-based accounting will complicate Quantification the comparability of performance indicators among hotels by guest stay. Aside from increased cost, installing such The lodging industry will need to agree on several quanti- monitoring devices would ironically increase the hotel’s fication parameters to allow for uniform footprinting and environmental footprint due to manufacturing, installing, comparability. They are listed below, along with the defini- maintaining, and using the systems. I do not argue here tions used in this study: against sub-metering in certain situations, but tracking the • Source or site energy as base values for energy and data from each guest stay does not seem cost-effective or carbon (site energy was used); environmentally sound for the benefit provided. • Emission factors for fuel burning and fugitive emissions A second reason for applying an average-guest-stay (WRI emission factors were used, derived from IPCC footprint lies in the unparallel structure of amenity con- data); sumption and rates charged. Guests feel more free to use amenities at a hotel that includes those services in daily rates, • GWP years for fugitive emissions sources (100-year fac- such as a complimentary breakfast, wi-fi, or a fitness center. tors were used); On the other hand, guests are more judicious in using ame- 51 Chekitan S. Dev and Glenn Withiam, “Fresh Thinking about the Box,” Cornell Hospitality Roundtable Proceedings, Vol. 3, No. 6, p. 10 (Cornell Center for Hospitality Research), quoting a study by Rebecca Hamilton on predicted and actual use of amenities in U.S. hotels. Cornell Hospitality Report • July 2011 • www.chr.cornell.edu 27
  • 28.
    Exhibit 12 Evaluation of potential sustainability performance metrics based on sample data set Representative of Relevance to Current Room Practical Data Incentivizes Metric Guest Industry Use Consumption Gathering Performance Per Available Room Medium High Medium High Low Per Room Sold High High High High High Per Occupied Room High Medium High Medium High Per Square Foot/ Low High Medium High Medium Meter • High or low heating values of fuel burning (high values tion and the wide mix of fuel sources used to generate that were used); power. The EPA eGRID platform provides emission factors by region based on fuel mixes and the grid structure. Ac- • Country or sub-national emission factors and how to cording to the 2010 eGRID summary tables, a hotel in Den- account for CH4 and N2O uniformly for electricity (na- ver would have a Scope 2 carbon footprint over 3 times that tional emission factors were used and only CO2 outside of a hotel in Los Angeles for the same electricity consump- the U.S.); tion (2,198.35 lb/MWh in Colorado vs. 683.53 lb/MWh in • Emission factors for energy and GHG emissions from California).53 If the eGRID national average of 1,306.18 lb/ steam and chilled water (U.S. EPA emission factors were MWh is used as the emission factor in both properties’ cal- used, based on EIA data); culation, however, the two hotels may be compared. • Conversion factors for standardizing energy units to Metrics Btu or kWh (factors from the U.S. Energy Information Although the industry commonly applies a per-available- Administration were used); and room analysis of its revenues, PAR is probably not the most useful GHG measure from the guest’s point of view, based • The integration of RECs and offsets into carbon per- on a comparison of the four footprint “denominators.” PAR formance indicators (RECs were to be subtracted from does not reflect consumption incurred for a room-night as energy pre-quantification of carbon; offsets were to be effectively as other metrics. Also, PAR values may be inverse- subtracted post-quantification in a net value). ly correlated with occupancy, because the PAR performance For GHG emissions quantification, the WRI states that would improve as occupancy rates decline. the most specific emission factors available should be used.52 Per Room Sold (PRS) Although region-specific emission factors would certainly add precision to the carbon footprint calculation those data Given the industry’s current widespread use of STR defini- are not readily available in most countries. Therefore a GHG tions of rooms sold, the PRS metric is far more practical and inventory for a hotel chain with thousands of properties in is more representative of individual room consumption and dozens of countries would most likely want to take the only does not fluctuate as highly with occupancy. The range of standardized approach currently available of using national- the utility fluctuations however within the scope and bound- level emission factors. The other choice would be to disclose ary of the study would need analyzing with a larger data set country-by-country the specificity levels and references cited to investigate the validity of this measure. for emission factors used. Per Occupied Room (POR) Even in the United States, where regional emission fac- tors are available, any large-scale comparison among hotel POR is the measure that most accurately represents con- properties would become unintelligible and impractical sumption per room because it includes comp rooms, which given the large role of electricity in hotel energy consump- are not part of the STR calculations of rooms sold. Comp rooms do, of course, generate utility usage and GHG emis- 52 World Resource Institute & World Business Council for Sustainable Development. (2004). The Greenhouse Gas Protocol: A Corporate Ac- 53 Calculated using the EPA eGRID2010 Summary Tables, Environmen- counting and Reporting Standard. Geneva: Earthprint Limited. tal Protection Agency (2010). Version 1.0. 28 The Center for Hospitality Research • Cornell University
  • 29.
    sions. In thestudy’s results, comp rooms represented an as chain scale, and normalization factors (notably, weather additional .7% to rooms sold on average. If comp room data and outlets or facilities). are not readily available, then benchmark factors for comp Normalization rooms could be added to PRS. Because climate is a critical input to energy performance, Per Square Foot (PSF) or Per Square Meter (PSM) the study collected data on geographic region, climate zone, For operations purposes a PSF/PSM metric is the most heating degree days, and cooling degree days. as a precursor practical, given the unchanging denominator of area. An to future weather normalization. Normalization based on area-based measurement allows for comparability among climate zone and specifically HDDs and CDDs is needed to properties with similar occupancies because it would imme- allow meaningful comparisons not only across hotels, but for diately normalize for differences in public areas and outlets. the same hotel across time. Although it does not directly address occupancy-related con- The data-as-boundary specification presents a limita- sumption, with an appropriate adjustment (i.e., multiplying tion in the existence and operation of certain outlets. In by the average area per guestroom, gross or net) it would be addition to the issue of an on-premises laundry, whether the relevant for stakeholders asking to know the environmental property has a spa, fitness center, or F&B outlets all affect its footprint of their stay. performance. Research will determine whether these require A comparison of the four potential sustainability perfor- normalization. At the minimum, a normalization factor to mance metrics is shown in Exhibit 12. Theoretically the met- be added to the footprint of hotels which outsource laundry rics most relevant for client footprinting will represent the may be appropriate as further research could define appro- closest actual consumption and impacts resulting from the priate benchmark values. hotel stay. A PRS or POR metric is consumption-based at a Chain Scale Benchmarks larger level, since it divides the hotel’s consumption and im- Since we have each property’s chain scale, it is possible pacts by the number of rooms utilized by the hotel’s guests. that issues of amenities and public areas can be smoothed Useful though they may be, PAR and PSF values do not by normalizing or enabling comparisons among segments, necessary reflect a footprint of the guest. Therefore some ele- and a PSF proxy may thus be unnecessary. In any event, it ments of guest consumption need to be taken into account. makes little sense to compare a limited service hotel to a full- From this perspective, comp rooms could be considered as a service property. part of the hotel’s general footprint from BOH operation. A final consideration for comparability is the type of The difficulty in PRS metrics is that they vary widely by guestroom occupied by the client, which was not included the amount of public space and facilities and amenities. In in this study. A suite or deluxe room may have a higher this instance, the differences in hotel size and scale may be footprint than a standard guestroom. The air travel emis- best communicated in PSF/PSM metrics. Just as in the case sions calculation found that the footprint of a business or of guests and room-nights, multiple metrics may be used first class seat was on average higher than an economy seat and communicated, but if all performance indicators were by a factor of 2.2. Further study could determine whether disclosed collectively they would compromise the hotel’s oc- that is also true with regard to the additional consumption cupancy data. Specifically, if PAR and PRS were both given, associated with a suite. then a stakeholder could divide the PAR value by the PRS Just as the premise of Energy Star ratings is to provide value and arrive at the hotel’s occupancy. Given the competi- an overall performance rating based on a benchmarking tive value of property-level occupancy data, it is not practi- and rating system, an overall sustainability rating or index cal to provide both metrics to external stakeholders. of performance for hotels is a potential path toward com- In the end, PSF/PSM and per-room metrics do not parability. It is beyond the current framework to develop a compromise the hotel’s data. Based on this reason and comprehensive index scheme, as the current industry need the sample set results of data availability, PSF and PRS is to standardize the parameters of performance indicators metrics appear to be best for footprinting and comparing individually. Further research on benchmarking, stakeholder sustainability performance in carbon, energy, and water requests, and performance indicator development would from hotel stays. Further research may provide a hybrid help advance a benchmark index. metric of PSF and PRS to provide increased comparability. Stakeholders Comparability and Benchmarking As we have seen from this study, sustainability performance To ensure comparability of the analysis, the footprint data measurement involves a complex series of assumptions and need to be filtered through two attributes: revenue class such parameters. To increase transparency, these assumptions can be provided when performance indicators are given to Cornell Hospitality Report • July 2011 • www.chr.cornell.edu 29
  • 30.
    stakeholders. The stakeholdercan then evaluate the indica- indicators in sustainability measurement and then offered tors and assumptions in making a comparison among peer a process by which performance indicators are defined by hotels. As an example, a reference sheet for this study was passing specific aspects of sustainability through defining included in Appendix E. characteristics of boundary, quantification, and metrics This study’s quantification method is limited because while considering the issues of industry collaboration and the data represent the footprint of the entire building, but practicality. not its component services. As a result, this methodology The study applied the framework to determine the would not provide information for stakeholder groups that boundary, quantification methods, and metrics for perfor- request footprints of meetings and events. The footprint mance indicators of carbon, energy, water, and waste derived of the room-night is one part of an event footprint, but from hotel stays, representing the most common request by how meeting footprints are handled will also affect room- external stakeholders. Metrics for these four aspects were night quantification. One way to do this is to calculate a conclusively studied with the result of a uniform recommen- per-square-foot or -meter footprint and then allocate the dation for measurement in carbon, energy, and water. Waste, meeting’s footprint proportionate to the area of the func- however, requires further parameter specification by both tion space and duration of the event. Unfortunately, simpli- industry and stakeholders to proceed with performance fied square footage (meter) allocations do not necessarily indicator development by means of the framework. For the represent proportionate consumption (i.e., a ballroom remaining three, the multitude of boundary and facility allo- representing 10 percent of a hotel’s gross floor area does not cation issues also require further parameter specification to necessarily use 10 percent of its overall energy and water arrive at uniform performance indicators that can be applied consumption). At the same time, per-room metrics are not industry-wide. representative of meeting footprints. Regardless of how the In addition to satisfying client requests for footprints of event footprint is quantified, it would result in double count- hotel stays, the study’s set performance indicators could be ing of consumption and impacts within the performance included as supplemental, sector-specific measurements of indicators provided to the client if room-night footprints are intensity or product-level footprints in sustainability reports. quantified separately from function space footprints using The prevalence of requests by stakeholders for this type of the same total energy or water balance. Footprints for meet- information leads to the conclusion that they would pass a ings are strongly tied to footprints of guestrooms for specific materiality test for being deemed core performance indica- stakeholder requests and will need further research to be tors by a working group. Likewise, the performance indica- uniformly presented in performance metrics. tors have specific linkages to certifications and frameworks With this issue in mind, potential solutions for generat- previously reviewed in the background section. A linkage ing industry agreement in uniform boundary and quantifica- table is included in Appendix F. tion for facilities and amenities are: Further work is needed to advance the framework and 1. Further study to determine proportions and impact the proposed performance indicators. Industry discussion of each boundary issue to overall consumption and and collaboration is paramount in this regard. Further re- impacts of the sustainability aspects; search with more comprehensive data sets, tests of boundary and quantification issues, and stakeholder needs will also 2. Analysis of consumption percentages to determine their help advance both the framework and the standardization of materiality in whether they need precise measurement sustainability performance measurement in hotel operations. or can have a benchmark industry percentage allocated One potential barrier to collaboration is that nearly to them (i.e., by chain scale segment and normalized for every major hotel company already has developed internal climate zone) without granular, event-specific data; or system-wide performance measurement software without 3. Analysis of the proximity of current allocation prior industry agreement on boundaries, quantification, structures in rental or operating agreements to and data sets to be communicated to external stakeholders. determine their application in allocating corresponding Such systems represent considerable investment. At pres- consumption. ent many are still in a phase of evolving and gaining buy-in, but the delaying of collaborative agreement could result in Conclusion increased costs should systems need to be modified accord- This study’s purpose was to address the lodging industry’s ing to a common standard. In the long run however, the cost need to answer external stakeholder requests for standard- of harmonizing data reporting from internal systems would ized sustainability performance indicators. It started by pro- be lower than the instance of a continued fee (and analytical posing a conceptual framework for developing performance leverage) paid to third parties for external normalization. n 30 The Center for Hospitality Research • Cornell University
  • 31.
    Appendix A Performance disclosed and metrics used in hotel GRI reports through 2009 METRICS Accor HK-Shanghai IHG Jumeirah BREAKDOWN Total Energy MWh Gj kWh kWh (elec only) (EN3 and/or EN4) Energy Intensity kWh Per Available MJ per m2 kWh Per Available Not Reported Room Room Total Water (EN8) Mm3 m3 m3 m3 Water Intensity Per Occupied Room L. Per Guest Night Not Reported Not Reported Mm3 Total Waste Tons Not Reported Not Reported Not Reported (EN22) Waste Intensity Tons Per Hotel Not Reported Not Reported Not Reported Total GHG Metric Tons Metric Tons Approximate Metric Not Reported Emissions (EN16) Tons GHG Emissions Not Reported Not Reported kg. Per Room Night Not Reported Intensity Boundaries As available from Headquarters + Managed and Dubai-based managed reporting properties Operational Control + Franchised properties properties and those of (owned, managed, Some External influence leased, and franchised) Employees Marriott NH Rezidor Sol Meliá Taj Total Energy MWh MWh Not Reported Gj Gj (EN3 and/or EN4) Energy Intensity kWh Per Available Room kWh Per Guest Night kWh per m2 Not Reported Not Reported Total Water (EN8) Mm3 m3 Not Reported m3 m3 Water Intensity Per Available Room L. Per Guest Night L. Per Guest Night Not Reported Not Reported Mm3 Total Waste Tons kg. Not Reported Not Reported Not Reported (EN22) Waste Intensity Not Reported kg. Per Guest Night kg. Per Guest Night Tons or kg per Not Reported Hotel Total GHG Metric Tons Metric Tons Metric Tons kg Metric Tons Emissions (EN16) GHG Emissions Lb. Per Available Room kg. Per Guest Night kg. Per Guest Night Not Reported Not Reported Intensity Boundaries Energy/Water/GHG: As available (sometimes Managed and Leased Not Specified Cites brands that Global Managed, Waste: partial) among owned, Properties (that are included US Managed leased, and managed reported) Cornell Hospitality Report • July 2011 • www.chr.cornell.edu 31
  • 32.
    Appendix B Emission factors of kg CO2 per kWh of electricity generated per country EMISSION FACTORS OF KG CO2E PER kWh OF ELECTRICITY GENERATRED PER COUNTRY Emission Emission Emission Emission Emission Country Factor Country Factor Country Factor Country Factor Country Factor Albania 0.0324402 Cuba 1.0194389 Israel 0.773651 Nicaragua 0.5497637 Togo 0.4586697 Algeria 0.6881182 Cyprus 0.7582802 Italy 0.403512 Nigeria 0.3861378 Trinidad and Tobago 0.7243096 Angola 0.0982004 Czech Republic 0.526629 Jamaica 0.8297551 Norway 0.006867 Tunisia 0.5458586 Argentina 0.3033696 Denmark 0.341339 Japan 0.418346 Oman 0.8561127 Turkey 0.438222 Armenia 0.1382909 Dominican Republic 0.6238551 Jordan 0.6018739 Pakistan 0.4128082 Turkmenistan 0.7951304 Australia 0.920527 Ecuador 0.3957349 Kazakhstan 0.5200265 Panama 0.2288439 Ukraine 0.3443288 Austria 0.214471 Egypt 0.4698084 Kenya 0.3174905 Paraguay 0 United Arab Emirates 0.8199856 Azerbaijan 0.4734752 El Salvador 0.2167277 North Korea 0.5331955 Peru 0.1723235 United Kingdom 0.504733 Bahrain 0.8248637 Eritrea 0.690342 South Korea 0.464337 Philippines 0.4350061 United States 0.55866 Bangladesh 0.5843308 Estonia 0.6401581 Kuwait 0.6429168 Poland 0.65865 Uruguay 0.2963499 Belarus 0.2963771 Ethiopia 0.002914 Kyrgyzstan 0.079161 Portugal 0.416424 Uzbekistan 0.44636 Belgium 0.260036 Finland 0.241592 Latvia 0.1673881 Qatar 0.6257141 Venezuela 0.2084422 Benin 0.6962126 France 0.084953 Lebanon 0.6946497 Romania 0.428605 Vietnam 0.3963138 Bolivia 0.5049688 Gabon 0.3466605 Libya 0.8788286 Russia 0.3285654 Yemen 0.8230311 Bosnia and Herzegovina 0.801958 Georgia 0.1449678 Lithuania 0.139482 Saudi Arabia 0.7553734 Zambia 0.0067574 Botswana 1.8514539 Germany 0.403629 Luxembourg 0.326047 Senegal 0.7258949 Zimbabwe 0.5727689 Brazil 0.0814376 Ghana 0.2756985 Macedonia 0.6189059 Serbia 0.7155911 Other Africa 0.4886113 Brunei Darussalam 0.8210049 Gibraltar 0.7304305 Malaysia 0.6553582 Singapore 0.5360586 Other Latin America 0.5089928 Bulgaria 0.4479618 Greece 0.724964 Malta 0.8340854 Slovak Republic 0.223412 Other Asia 0.3078166 Cambodia 1.0049344 Guatemala 0.3344147 Mexico 0.541285 Slovenia 0.3317589 Cameroon 0.0425357 Haiti 0.3051825 Moldova 0.475568 South Africa 0.8689996 Canada 0.184179 Honduras 0.4132526 Mongolia 0.52331 Spain 0.349794 Chile 0.2942425 Hong Kong, China 0.8546126 Morocco 0.7079012 Sri Lanka 0.3137244 China (including Hong Kong) 0.7883087 Hungary 0.343927 Mozambique 0.0010178 Sudan 0.6139183 Colombia 0.1496172 Iceland 0.000542 Myanmar 0.3382211 Sweden 0.047966 Congo 0.1023289 India 0.9440385 Namibia 0.0756469 Switzerland 0.025723 Democratic Republic of Congo 0.0027816 Indonesia 0.6767253 Nepal 0.0037996 Syria 0.6043992 Costa Rica 0.0473985 Iran 0.5143547 Netherlands 0.394315 Tajikistan 0.0280183 Côte d'Ivoire 0.4362172 Iraq 0.7009096 Netherlands Antilles 0.7170685 Tanzania 0.3155122 Croatia 0.318398 Ireland 0.535333 New Zealand 0.3091 Thailand 0.5109283 Source: World Resources Institute (2009). GHG Protocol tool for stationary combustion. Version 4.1. 32 The Center for Hospitality Research • Cornell University
  • 33.
    Appendix C GWPof common refrigerants Gas or Blend GWP Source Gas or Blend GWP Source CO2 1 IPCC Second Assessment R-410A 1,725 ASHRAE Standard 34 Report (1995) HFC-23 11,700 IPCC Second Assessment R-410B 1,833 ASHRAE Standard 34 Report (1995) HFC-32 650 IPCC Second Assessment R-411A 15 ASHRAE Standard 34 Report (1995) HFC-125 2,800 IPCC Second Assessment R-411B 4 ASHRAE Standard 34 Report (1995) HFC-134a 1,300 IPCC Second Assessment R-412A 350 ASHRAE Standard 34 Report (1995) HFC-143a 3,800 IPCC Second Assessment R-413A 1,774 ASHRAE Standard 34 Report (1995) HFC-152a 140 IPCC Second Assessment R-414A 0 ASHRAE Standard 34 Report (1995) HFC-236fa 6,300 IPCC Second Assessment R-414B 0 ASHRAE Standard 34 Report (1995) R-401A 18 ASHRAE Standard 34 R-415A 25 ASHRAE Standard 34 R-401B 15 ASHRAE Standard 34 R-415B 105 ASHRAE Standard 34 R-401C 21 ASHRAE Standard 34 R-416A 767 ASHRAE Standard 34 R-402A 1,680 ASHRAE Standard 34 R-417A 1,955 ASHRAE Standard 34 R-402B 1,064 ASHRAE Standard 34 R-418A 4 ASHRAE Standard 34 R-403A 1,400 ASHRAE Standard 34 R-419A 2,403 ASHRAE Standard 34 R-403B 2,730 ASHRAE Standard 34 R-420A 1,144 ASHRAE Standard 34 R-404A 3,260 ASHRAE Standard 34 R-500 37 ASHRAE Standard 34 R-406A 0 ASHRAE Standard 34 R-501 0 ASHRAE Standard 34 R-407A 1,770 ASHRAE Standard 34 R-502 0 ASHRAE Standard 34 R-407B 2,285 ASHRAE Standard 34 R-503 4,692 ASHRAE Standard 34 R-407C 1,526 ASHRAE Standard 34 R-504 313 ASHRAE Standard 34 R-407D 1,428 ASHRAE Standard 34 R-505 0 ASHRAE Standard 34 R-407E 1,363 ASHRAE Standard 34 R-506 0 ASHRAE Standard 34 R-408A 1,944 ASHRAE Standard 34 R-507(A) 3,300 ASHRAE Standard 34 R-409A 0 ASHRAE Standard 34 R-508A 10,175 ASHRAE Standard 34 R-409B 0 ASHRAE Standard 34 R-508B 10,350 ASHRAE Standard 34 Adapted from: World Resources Institute, Calculating HFC and PFC Emissions from the Manufacturing, Installation, Operation and Disposal of Refrigeration & Air-conditioning Equipment (Version 1.0): Guide to calculation worksheets (January 2005) Cornell Hospitality Report • July 2011 • www.chr.cornell.edu 33
  • 34.
    Appendix D Resultsfrom data set Profile Data Data Set Mean Min Max Standard Deviation Guestrooms 20 394 56 1,354 343 Gross floor area (Ft.2) 20 378,418 18,899 1,500,000 381,740 Ft.2 total function 6 65,212 1,236 206,154 90,802 space Ft.2 per guestroom 8 601 254 969 250 Heating Degree Days 20 2,053 24 4,352 1,670 Cooling Degree Days 20 3,142 864 6,254 2,185 Rooms Available 20 143,908 20,440 495,040 125,113 Rooms Sold 18 97,024 12,605 340,392 78,227 Occupied Rooms 8 111,948 30,017 344,948 112,716 Comp % Increment 8 0.7% 0.2% 1.5% 0.5% Performance Data Set Mean Min Max Standard Metrics Deviation Total Energy (kWh) 18 10,592,546 353,644 37,650,364 10,801,452 Total Energy PAR 17 64 17 131 31 Total Energy POR 8 85 39 176 42 Total Energy PRS 15 91 28 178 44 Total Energy PSF 17 33 18 97 18 Total Water (M3) 17 97,120 3,672 353,694 94,975 Water LPAR 17 565 52 1,117 333 Water LPOR 8 722 435 1,653 397 Water LPRS 15 846 351 1,673 468 Water L PSF 17 254 31 600 131 Total Waste (Tons) 11 665 42 3,019 888 Total Waste kgPAR 11 4.9 0.7 26.2 7.4 Total Waste kgPOR 4 2.6 1.4 4.6 1.4 Total Waste kgPRS 9 6.4 1.4 33.3 10.2 Total Waste kg PSF 11 2.5 0.4 13.9 4.0 Total Direct GHG (Scope 16 938.10 35.38 2,879.04 1,006 1) % Fugitive of Scope 1 10 0.022% 0.000% 0.140% 0.044% Total GHG Emissions 17 4,919 130 16,067 5,270 (Scope 1 & 2) Total GHG kgPAR 17 28 6 77 18 Total GHG kgPOR 8 35 17 75 18 Total GHG kgPRS 15 39 10 102 25 Total GHG kg PSF 17 14 7 36 8 34 The Center for Hospitality Research • Cornell University
  • 35.
    Appendix D Results from data set (continued) Mean Values by STR Segment Performance Economy Midscale Upper Midscale Upscale Upper Upscale Luxury Metrics Total Energy (kWh) 353,644 1,502,179 13,134,263 7,604,673 21,271,643 19,219,543 Total Energy PAR 17 29 55 73 64 89 Total Energy POR N/A 49 N/A 66 92 132 Total Energy PRS N/A 49 66 102 93 128 Total Energy PSF N/A 18 38 41 27 32 Total Water (M3) N/A 16,887 105,743 72,609 126,709 190,498 Water LPAR 114 335 418 592 355 882 Water LPOR N/A 545 N/A 664 511 1,169 Water LPRS N/A 547 455 910 516 1,247 Water L PSF N/A 214 247 271 145 312 Total Waste (Tons) N/A 42 419 756 948 N/A Total Waste kgPAR 1.3 0.7 2.1 7.3 2.5 N/A Total Waste kgPOR N/A 1.4 N/A 2.0 3.6 N/A Total Waste kgPRS N/A 1.4 3.3 9.2 3.6 N/A Total Waste kg PSF 1.5 0.4 6.5 3.8 1.0 N/A Total Direct GHG 35 96 966 649 1,983 1,511 (Scope 1) % Fugitive of Scope 1 0.0214% 0.0200% 0.0214% N/A N/A 0.0046% Total GHG Emissions 130 675 5,477 4,503 8,150 7,788 (Scope 1 & 2) Total GHG kgPAR 6 13 21 34 24 36 Total GHG kgPOR N/A 22 N/A 26 35 59 Total GHG kgPRS 10 22 22 47 35 53 Total GHG kg PSF 7 8 12 18 10 13 Hotel Locations: USA, 11 properties; United Arab Emirates, 4 properties; UK, 2 properties; China, 2 properties; and Netherlands, 1 property. Energy Source: Natural Gas, 16 hotels, Electricity, 15 hotels, and Propane, LPG, Fuel Oil, and Steam, 1 property each. Cornell Hospitality Report • July 2011 • www.chr.cornell.edu 35
  • 36.
    Appendix E Samplehotel property reference sheet for external stakeholders Performance Metrics [to be filled in per hotel] Boundaries Gross Carbon Footprint PRS [value]kg Data Parameters Included Not Included Gross Carbon Footprint PSF [value]kg Data-as-boundary All operated facilities’ Construction/Renovation Net Carbon Footprint PRS [value]kg utility consumption Net Carbon Footprint PSF [value]kg 2010 calendar year All meeting space Outsourced operations Total Energy PRS [value]kWh Facility-level Fuels Burned (stationary Treatment of wastewater and mobile) Total Energy PSF [value]kWh Self-reported Fugitive Emissions Water purification Water PRS [value]L No weather Purchased Electricity Offsite IT servers Water PSF [value]L normalization No chain scale Purchased Steam Employee commutes/ normalization travel RECs Corporate or regional offices Carbon Offsets Life cycles of materials and supplies Attributes [to be filled in per hotel] Upstream or downstream impacts # Guestrooms [#] Guest travel or STR Segment [list chain scale segment] consumption offsite HDDs [#] CDDs [#] Quantification Methods Function Space [list Square Footage] Source Emission Factor Observation [Included/Not Included] Refrigerants WRI HFC and PFC 100-year GWP cycle Laundry Wash [Included/Not Included] Emissions Version 1.0 Restaurant[s] [Included/Not Included] Natural Gas WRI 4.0 Stationary HHV, Global Factor, Site Swimming Pool [Included/Not Included] Combustion Energy Spa [Included/Not Included] Propane EPA Emissions from HHV, Country Factor, Site Stationary Combustion Energy Fitness Center [Included/Not Included] LPG WRI 4.0 Stationary HHV, Global Factor, Site Retail Outlets [Included/Not Included] Combustion Energy Business Center [Included/Not Included] Fuel Oil WRI 4.0 Stationary HHV, Global Factor, Site Combustion Energy Electricity WRI 4.1 Stationary HHV, Country Factor, Site Combustion, EPA eGRID Energy (USA) Steam EIA (USA) Country Factor, Site Energy Chilled Water EIA (USA) Country Factor, Site Energy 36 The Center for Hospitality Research • Cornell University
  • 37.
    Appendix F DIrectand indirect linkages to indicators developed through the measurement framework Linkages Performance Green Seal LEED Indicator (Total, ISO GS-33 5th EB: AHLA Green PRS, or PSF/PSM) Description GRI 3.1 CDP 2011 26000 GSTC Green Key Ed. O&M Guidelines Scope 1 GHG EN16 8.2, 13.4 6.7.5.2, D.2.1 Engineering & EA GHGa emissions 6.5.5.2 Maintenance 2 Credit 6 Scope 2 GHG EN16 8.3, 13.4 6.7.5.2, D.2.1 Engineering & EA GHGb emissions 6.5.5.2 Maintenance 2 Credit 6 Gross carbon EN16 11.2, 6.7.5.2, D.2.1 Engineering & EA GHGc footprint 13.4, 6.5.5.2 Maintenance 2 Credit SM4 6 GHGd Net carbon EN16, 14.2a, 6.7.5.2, D.2.1 Engineering & 3.8.4 footprint EN18 SM4 6.5.5.2 Maintenance 2 Direct energy EN3 12.2 6.5.3.2, D.1.3 Engineering & EA Guideline ENERGYa usage 6.5.4.2, Maintenance 1, Credit 2 6.7.5.2 60 3.2, 3.3 Indirect EN4 12.2 6.5.3.2, D.1.3 Engineering & EA Guideline ENERGYb energy usage 6.5.4.2, Maintenance 1, Credit 2 6.7.5.2 60 3.2, 3.3 Total energy 6.5.3.2, D.1.3 Engineering & EA Guideline ENERGYc usage 6.5.4.2, Maintenance 1, Credit 2 6.7.5.2 60 3.2, 3.3 Total water EN8 9.2 6.5.3.2, D.1.4 3.8.7 WE Guideline WATERc usage (Water) 6.5.4.2, Credit 2 6.7.5.2 1 Cornell Hospitality Report • July 2011 • www.chr.cornell.edu 37
  • 38.
    Appendix G Sample of GHG emissions from air travel between selected cities Orlando San Francisco Dallas Boston Phoenix San Diego Amsterdam Chicago Dubai London Shanghai New York Las Vegas Orlando 4,876 1,928 2,242 3,686 4,576 9,054 2,008 15,964 8,682 16,604 1,868 4,066 ROUNDTRIP AIR DISTANCES (miles) San Francisco 627 2,956 5,392 1,298 894 10,910 3,682 16,168 10,702 12,266 5,156 824 Dallas 326 394 3,102 1,764 2,366 9,806 1,602 16,370 9,466 15,222 2,758 2,140 ROUNDTRIP GHG EMISSIONS (kg) Boston 356 694 391 4,590 5,160 6,888 1,728 13,332 6,508 17,658 374 4,748 Phoenix 397 213 296 594 604 11,588 2,876 18,326 10,512 13,564 4,296 510 San Diego 720 176 410 666 126 11,648 3,438 18,928 11,758 13,160 4,876 516 Amsterdam 1,168 1,280 936 771 1,433 1,397 8,210 6,416 460 11,064 7,262 11,788 Chicago 293 466 237 247 390 422 975 15,272 7,878 14,074 1,474 3,022 Dubai 2,163 1,640 1,687 1,365 2,422 2,555 615 2,096 6,824 8,010 13,660 17,112 London 967 1,028 1,099 776 1,472 1,257 120 870 589 11,474 6,882 11,366 Shanghai 2,085 1,410 1,804 2,104 1,623 1,586 1,671 1,748 783 1,112 14,746 13,090 New York 259 638 397 115 456 579 858 246 1,253 678 1,735 4,484 Las Vegas 650 167 309 611 149 155 1,452 392 1,924 1,211 1,577 533 Notes: Calculated using TRX Air Emissions Calculator. http://carbon.trx.com Assumptions • Best performing airline used in each instance • Economy class seating • Statute miles • Direct flights where routing available, comparable two-segment flight routes where direct flights not available • Radiative forcing included (factor of 2.7) 38 The Center for Hospitality Research • Cornell University
  • 39.
    Advancing Business and Personal Success Explore, develop and apply ideas with global hospitality leaders and expert Cornell professors. Professionals from around the world are invited to attend 3-day, 10-day or online courses at the world’s leading institute for hospitality management education in: • Strategic Leadership • Marketing • Finance • Operations • Foodservice • Real Estate • Human Resources Visit our website to apply. The Executive Path Hospitality Leadership Through Learning Complete program information and applications available online: Cornell Hospitality Report • July 2011 • www.chr.cornell.edu www.hotelschool.cornell.edu/execed 39 Phone + 1 607 255 4919 Email exec_ed_hotel@cornell.edu
  • 40.
    Cornell Center forHospitality Research Publication Index www.chr.cornell.edu Cornell Hospitality Quarterly Vol. 3 No. 2 The Challenge of Hotel and Vol. 11 No. 2 Positioning a Place: Restaurant Sustainability: Finding Profit in http://cqx.sagepub.com/ Developing a Compelling Destination “Being Green,” by Glenn Withiam Brand, by Robert J. Kwortnik, Ph.D., and 2011 Reports Ethan Hawkes, M.B.A. Vol. 3 No. 1 Cautious Optimism: CHRS Examines Hospitality Industry Vol. 11, No. 11 Customer Loyalty: Vol. 11 No. 1 The Impact of Health Trends, by Glenn Withiam A New Look at the Benefits of Improving Insurance on Employee Job Anxiety, Segmentation Efforts with Rewards Programs, by Clay Voorhees, Ph.D., Withdrawal Behaviors, and Task 2010 Reports Performance`, by Sean Way, Ph.D., Bill Vol. 10 No. 18 How Travelers Use Michael McCall, Ph.D., and Roger Carroll, Ph.D., Alex Susskind, Ph.D., and Online and Social Media Channels to Calantone, Ph.D. Joe C.Y. Leng Make Hotel-choice Decisions, by Laura Vol. 11, No. 10 Customer Perceptions of McCarthy, Debra Stock, and Rohit Verma, Electronic Food Ordering, 2011 Hospitality Tools Ph.D. by Sheryl E. Kimes Vol. 2 No. 1 The Game Has Changed: A New Paradigm for Stakeholder Vol. 10 No. 17 Public or Private? The Vol. 11, No. 9 2011 Travel Industry Engagement, by Mary Beth McEuen Hospitality Investment Decision, by Benchmarking: Status of Senior Qingzhong Ma, Ph.D. and Athena Wei Destination and Lodging Marketing 2011 Industry Perspectives Zhang, Ph.D. Executives, by Rohit Verma, Ph.D., and Ken McGill No. 7 MegaTips 2: Twenty Tested Vol. 10 No. 16 Best Practices in Search Techniques for Increasing Your Tips, by Engine Marketing and Optimization: Vol 11 No 8 Search, OTAs, and Online Michael Lynn The Case of the St. James Hotel, by Greg Booking: An Expanded Analysis of the Bodenlcos, Victor Bogert, Dan Gordon, Billboard Effect, by Chris Anderson Ph.D. 2011 Proceedings Carter Hearne, and Chris K. Anderson, Vol 3, No. 7 Improving the Guest Ph.D. Vol. 11 No. 7 Online, Mobile, and Text Experience through Service Innovation: Food Ordering in the U.S. Restaurant Ideas and Principles for the Hospitality Vol. 10 No. 15 The Impact of Prix Fixe Industry, by Sheryl E. Kimes, Ph.D., and Industry, by Cathy A. Enz, Ph.D. Menu Price Formats on Guests’ Deal Philipp F. Laqué Perception, by Shuo Wang and Michael Vol 3, No. 6 Hospitality Brand Lynn, Ph.D. Vol. 11 No. 6 Hotel Guests’ Reactions to Management Roundtable: Fresh Thinking Guest Room Sustainability Initiatives, by about the Box, by Chekitan S. Dev and Vol. 10 No. 14 The Future of Hotel Alex Susskind, Ph.D. and Rohit Verma, Glenn Withiam Revenue Management, by Sheryl Kimes, Ph.D. Ph.D. Vol 3, No. 5 Building Brands in the Vol. 11, No. 5 The Impact of Terrorism Internet Age: Analytics, Loyalty, and Vol. 10, No. 13 Making the Most of and Economic Shocks on U.S. Hotels, by Communication, by Glenn Withiam Priceline’s Name-Your-Own-Price Cathy A. Enz, Renáta Kosová, and Mark Channel, by Chris Anderson, Ph.D., and Lomanno Vol. 3, No. 4 Brave New World: Online Radium Yan, D.B.A Hotel Distribution, by Glenn Withiam Vol. 11 No. 4 Implementing Human Vol. 10, No. 12 Cases in Innovative Resource Innovations: Three Success Vol. 3, No. 3 Social Media and the Practices in Hospitality and Related Stories from the Service Industry, by Justin Hospitality Industry: Holding the Tiger by Services, Set 4, by Cathy A. Enz, Ph.D., Sun and Kate Walsh, Ph.D. the Tail, by Glenn Withiam Rohit Verma, Ph.D., Kate Walsh, Ph.D. Sheryl E. Kimes, Ph.D., and Judy A. Vol. 11 No. 3 Compendium 2011 Siguaw, D.B.A
  • 41.
    Cornell Center forHospitality Research Publication Index Vol. 10, No. 4 Cases in Innovative 2009 Reports Vol. 10, No. 11 Who’s Next? An Analysis Practices in Hospitality and Related of Lodging Industry Acquisitions, by Services, Set 2: Brewerkz, ComfortDelgro Vol. 9, No. 18 Hospitality Managers and Qingzhong Ma, Ph.D. and Peng Liu, Ph.D. Taxi, DinnerBroker.com, Iggy’s, Jumbo Communication Technologies: Challenges Seafood, OpenTable.com, PriceYourMeal. and Solutions, by Judi Brownell, Ph.D., Vol. 10, No. 10 Cases in Innovative com, Sakae Sushi, Shangri-La Singapore, and Amy Newman Practices in Hospitality and Related and Stevens Pass, by Sheryl E. Kimes, Services, Set 3: Cayuga Sustainable Ph.D., Cathy A. Enz, Ph.D., Judy A. Vol. 9, No. 17 Cases in Innovative Hospitality, Chic & Basic, JetBlue Airlines Siguaw, D.B.A., Rohit Verma, Ph.D., and Practices in Hospitality and Related Jumeirah Essex House, The Ritz-Carlton Kate Walsh, Ph.D. Services, Set 1: Aqua by Grandstand, Hotel Company, Runtriz, The Seaport Brand Karma, Capella Hotels & Resorts, Hotel, Thayer Lodging, TripTelevision, and Vol. 10, No. 3 Customer Preferences EnTrip, Hotels.com Visualiser, Luggage Xsense Experiential Design Consulting, by for Restaurant Brands, Cuisine, and Club, Royal Plaza on Scotts, Tastings, Cathy A. Enz, Ph.D., Rohit Verma, Ph.D., Food Court Configurations in Shopping Tune Hotels, and VisitBritain.com, by Judy Kate Walsh, Ph.D. Sheryl E. Kimes, Ph.D., Centers, by Wayne J. Taylor and Rohit A. Siguaw, D.B.A., Cathy A. Enz, Ph.D., and Judy A. Siguaw, D.B.A. Verma, Ph.D. Sheryl E. Kimes, Ph.D., Rohit Verma, Ph.D., and Kate Walsh, Ph.D Vol. 10, No. 9 Building Customer Loyalty: Vol. 10, No. 2 How Hotel Guests Perceive Ten Principles for Designing an Effective the Fairness of Differential Room Pricing, Vol 9 No 16 The Billboard Effect: Customer Reward Program, by Michael by Wayne J. Taylor and Sheryl E. Kimes, Online Travel Agent Impact on Non- McCall, Ph.D., Clay Voorhees, Ph.D., and Ph.D. OTA Reservation Volume, by Chris K. Roger Calantone, Ph.D. Anderson, Ph.D. Vol. 10, No. 1 Compendium 2010 Vol. 10, No. 8 Developing Measures for Vol 9 No 15 Operational Hedging and Environmental Sustainability in Hotels: 2010 Roundtable Retrospectives Exchange Rate Risk: A Cross-sectional An Exploratory Study, by Jie J. Zhang, Examination of Canada’s Hotel Industry, Vol. 2, No. 1 Sustainability Roundtable by Charles Chang, Ph.D., and Liya Ma Nitin Joglekar, Ph.D., and Rohit Verma, 2009: The Hotel Industry Seeks the Elusive Ph.D. Vol 9 No 14 Product Tiers and ADR “Green Bullet.” Clusters: Integrating Two Methods for Vol. 10, No. 7 Successful Tactics for Determining Hotel Competitive Sets, by Surviving an Economic Downturn: 2010 Industry Perspectives Jin-Young Kim and Linda Canina, Ph.D. Results of an International Study, by No. 6 The Future of Meetings: The Case Sheryl E. Kimes, Ph.D for Face-to-Face, by Christine Duffy and Vol 9, No. 13 Safety and Security in U.S. Mary Beth McEuen Hotels, by Cathy A. Enz, Ph.D Vol. 10, No. 6 Integrating Self-service Kiosks in a Customer-service System, No. 5 Making Customer Satisfaction Pay: Vol 9, No. 12 Hotel Revenue Management byTsz-Wai (Iris) Lui, Ph.D., and Gabriele Connecting Survey Data to Financial in an Economic Downturn: Piccoli, Ph.D. Outcomes in the Hotel Industry, by Gina Results of an International Study, by Pingitore, Ph.D., Dan Seldin, Ph.D., and Sheryl E. Kimes, Ph.D Vol. 10, No. 5 Strategic Pricing in Arianne Walker, Ph.D. European Hotels, 2006–2009, by Cathy Vol 9, No. 11 Wine-list Characteristics A. Enz, Ph.D., Linda Canina, Ph.D., and No. 4 Hospitality Business Models Associated with Greater Wine Sales, by Mark Lomanno Confront the Future of Meetings, by Sybil S. Yang and Michael Lynn, Ph.D. Howard Lock and James Macaulay Vol 9, No. 10 Competitive Hotel Pricing in Uncertain Times, by Cathy A. Enz, Ph.D., Linda Canina, Ph.D., and Mark Lomanno
  • 42.
    w w w.c hr.cornell.edu