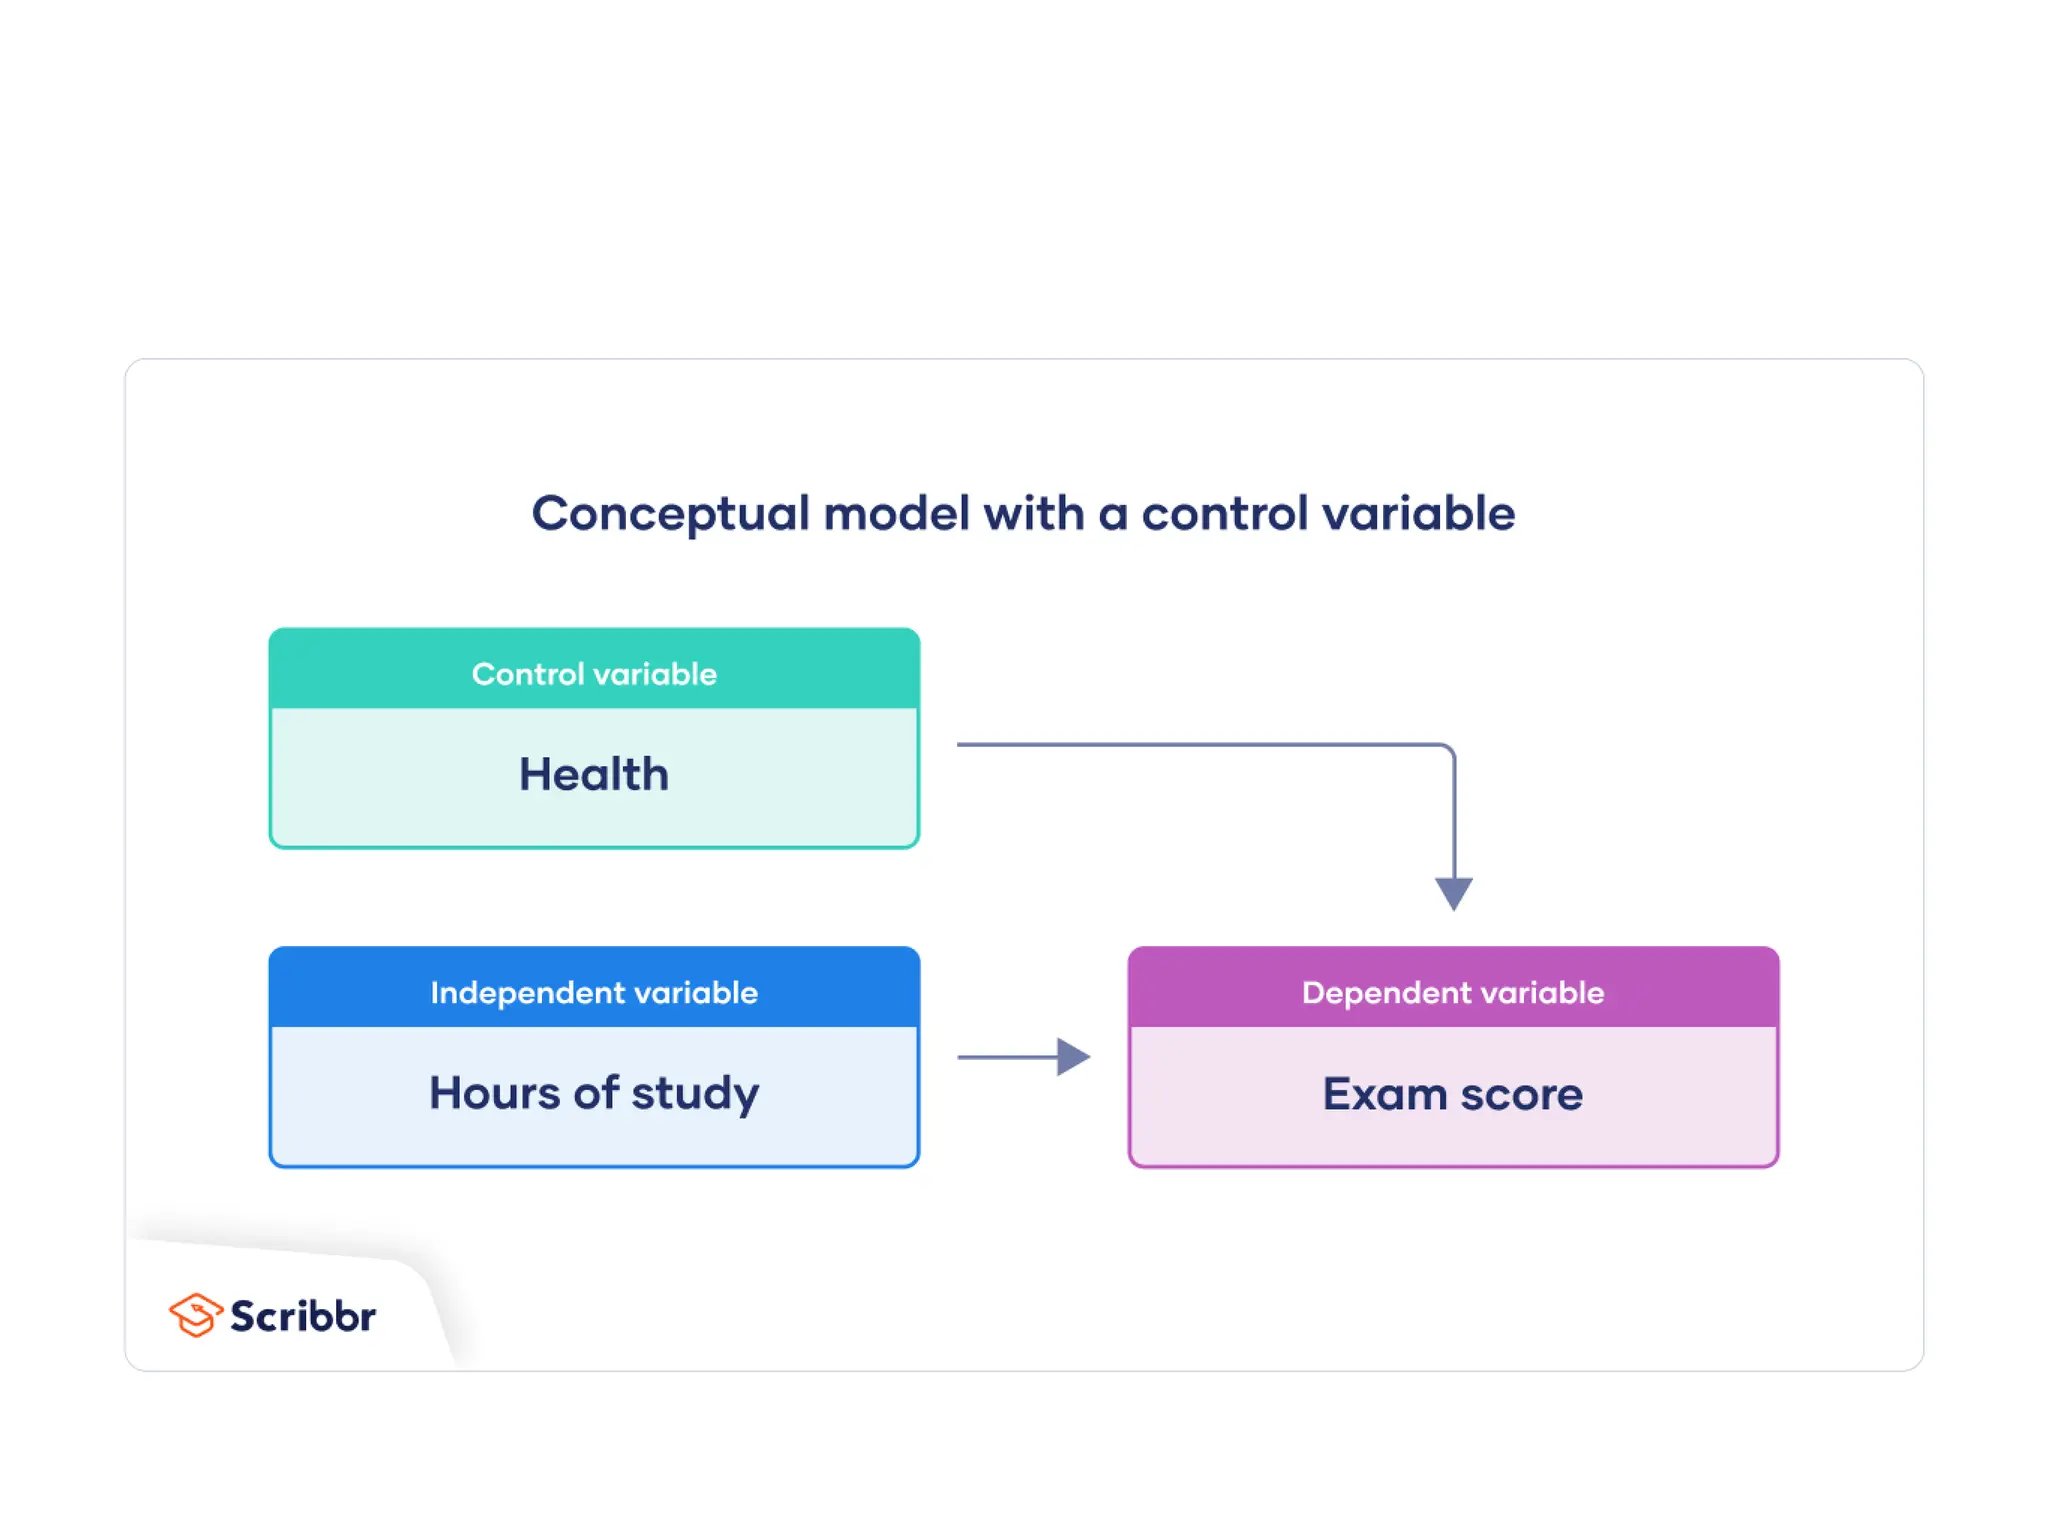
Developing a Conceptual
Framework for Research
• A conceptual framework illustrates what you
expect to find through your research. It
defines the relevant variables for your study
and maps out how they might relate to each
other.
• You should construct a conceptual framework
before you begin collecting data. It is often
represented in a visual format.
Independent and dependent variables
• If we want to test a cause-and-effect relationship, we need
to identify at least two key variables: the independent
variable and the dependent variable.
In our example:
• the expected cause, “hours of study,” is the independent
variable
• the expected effect, “exam score,” is the dependent
variable
• In other words, “exam score” depends on “hours of study.”
• Our hypothesis is that the more hours a student studies,
the better they will do on the exam.
• Causal relationships often involve several independent
variables that affect the dependent variable.
• However, to keep things simple, we’ll work with just
one independent variable, namely “hours of study.”
• To visualize our expected cause-and-effect
relationship, we will use the basic design components
of boxes and arrows.
• Each variable appears in a box. To indicate a causal
relationship, each arrow should start from the
independent variable (the cause) and point to the
dependent variable (the effect).
Moderating variables
• Now we’ll expand the framework by adding a moderating variable.
A moderator alters the effect that an independent variable has on
a dependent variable.
• In our example, we expect that the number of hours a student
studies is related to their exam score: the more you prepare, the
higher your score will be.
• Now we add the moderator “IQ.” A student’s IQ level changes the
effect that the variable “hours of study” has on the exam score: the
higher your IQ, the fewer hours of study you must put in to do well
on the exam.
• In other words, the “IQ” moderator moderates the effect that the
number of study hours has on the exam score.
• Let’s take a look at how this might work. The
graph shows how the number of hours spent
studying affects exam score.
• The more hours you study, the better your
results. A student who studies for 20 hours
will get a perfect score.
• But the graph looks different when we add an
“IQ” moderator of 120.
• A student with this IQ will already achieve a
perfect score after just 15 hours of study.
Mediating variables
Now we’ll expand the framework by adding a
mediating variable. In a cause-and-effect
relationship, a mediating variable is a variable
that links the independent and dependent
variables, allowing the relationship between
them to be better explained.
• the mediating variable of “number of practice
problems completed” comes between the
independent and dependent variables. The hours of
study impacts the number of practice problems, which
in turn impacts the exam score.
• In this case, the mediator helps explain why studying
more hours leads to a higher exam score. The more
hours a student studies, the more practice problems
they will complete; the more practice problems
completed, the higher the student’s exam score will be.
Moderator vs mediator
• A mediating variable is affected by the
independent variable, and it affects the
dependent variable. Therefore, it links the two
variables and helps explain the relationship
between them.
• A moderating variable is not affected by the
independent variable, even though affects the
dependent variable. For example, no matter how
many hours you study (the independent
variable), your IQ will not get higher.
Control variables
• These are control variables—variables that are
held constant so that they don’t interfere with
the results.
• For example, it is likely that if a student feels
ill, they will get a lower score on the exam.
Therefore, we’ll add “health” as a control
variable.
Developing a Conceptual Framework for Research (1).pptx

Developing a Conceptual Framework for Research (1).pptx

  • 1.
  • 2.
    • A conceptualframework illustrates what you expect to find through your research. It defines the relevant variables for your study and maps out how they might relate to each other. • You should construct a conceptual framework before you begin collecting data. It is often represented in a visual format.
  • 4.
    Independent and dependentvariables • If we want to test a cause-and-effect relationship, we need to identify at least two key variables: the independent variable and the dependent variable. In our example: • the expected cause, “hours of study,” is the independent variable • the expected effect, “exam score,” is the dependent variable • In other words, “exam score” depends on “hours of study.” • Our hypothesis is that the more hours a student studies, the better they will do on the exam.
  • 5.
    • Causal relationshipsoften involve several independent variables that affect the dependent variable. • However, to keep things simple, we’ll work with just one independent variable, namely “hours of study.” • To visualize our expected cause-and-effect relationship, we will use the basic design components of boxes and arrows. • Each variable appears in a box. To indicate a causal relationship, each arrow should start from the independent variable (the cause) and point to the dependent variable (the effect).
  • 7.
    Moderating variables • Nowwe’ll expand the framework by adding a moderating variable. A moderator alters the effect that an independent variable has on a dependent variable. • In our example, we expect that the number of hours a student studies is related to their exam score: the more you prepare, the higher your score will be. • Now we add the moderator “IQ.” A student’s IQ level changes the effect that the variable “hours of study” has on the exam score: the higher your IQ, the fewer hours of study you must put in to do well on the exam. • In other words, the “IQ” moderator moderates the effect that the number of study hours has on the exam score.
  • 9.
    • Let’s takea look at how this might work. The graph shows how the number of hours spent studying affects exam score. • The more hours you study, the better your results. A student who studies for 20 hours will get a perfect score.
  • 11.
    • But thegraph looks different when we add an “IQ” moderator of 120. • A student with this IQ will already achieve a perfect score after just 15 hours of study.
  • 13.
    Mediating variables Now we’llexpand the framework by adding a mediating variable. In a cause-and-effect relationship, a mediating variable is a variable that links the independent and dependent variables, allowing the relationship between them to be better explained.
  • 14.
    • the mediatingvariable of “number of practice problems completed” comes between the independent and dependent variables. The hours of study impacts the number of practice problems, which in turn impacts the exam score. • In this case, the mediator helps explain why studying more hours leads to a higher exam score. The more hours a student studies, the more practice problems they will complete; the more practice problems completed, the higher the student’s exam score will be.
  • 15.
    Moderator vs mediator •A mediating variable is affected by the independent variable, and it affects the dependent variable. Therefore, it links the two variables and helps explain the relationship between them. • A moderating variable is not affected by the independent variable, even though affects the dependent variable. For example, no matter how many hours you study (the independent variable), your IQ will not get higher.
  • 16.
    Control variables • Theseare control variables—variables that are held constant so that they don’t interfere with the results. • For example, it is likely that if a student feels ill, they will get a lower score on the exam. Therefore, we’ll add “health” as a control variable.