This document provides an overview of the hospitality industry in India. It discusses the nature of the industry, key players such as Taj, Leela, Oberoi, and ITC hotels. It analyzes the industry structure and discusses topics like geographical spread of major players, demand-supply dynamics, branding and pricing strategies. It also provides details on market capitalization of top hotel companies and profiles of promoters and management groups of some major Indian hotel brands.
![Capt. Chittarath Poovakkatt Krishnan Nair (February 9, 1922) is an Indian businessman, who
founded Leela Lace Ltd., a textile company in 1957 and later became the Founder-Chairman of
the Leela Group of Hotels, established in 1986.[2][3][4] and a 2010 recipient of the Padma
Bhushan, given by Government of India. He served in the Indian National Army under Netaji
Subhash Chandra Bose. In 1950, he married Leela, the daughter of a handloom owner from
Kannur, subsequently, he started helping his father-in-law in the latter's garment export business,
eventually taking it over and developing export markets, becoming one of the pioneers of
the Bleeding Madras fabric, which became much popular in the 1960s. By 1980s his textile
business, called "Leela Lace" after his wife, was flourishing and had built textile factory in North
Mumbai
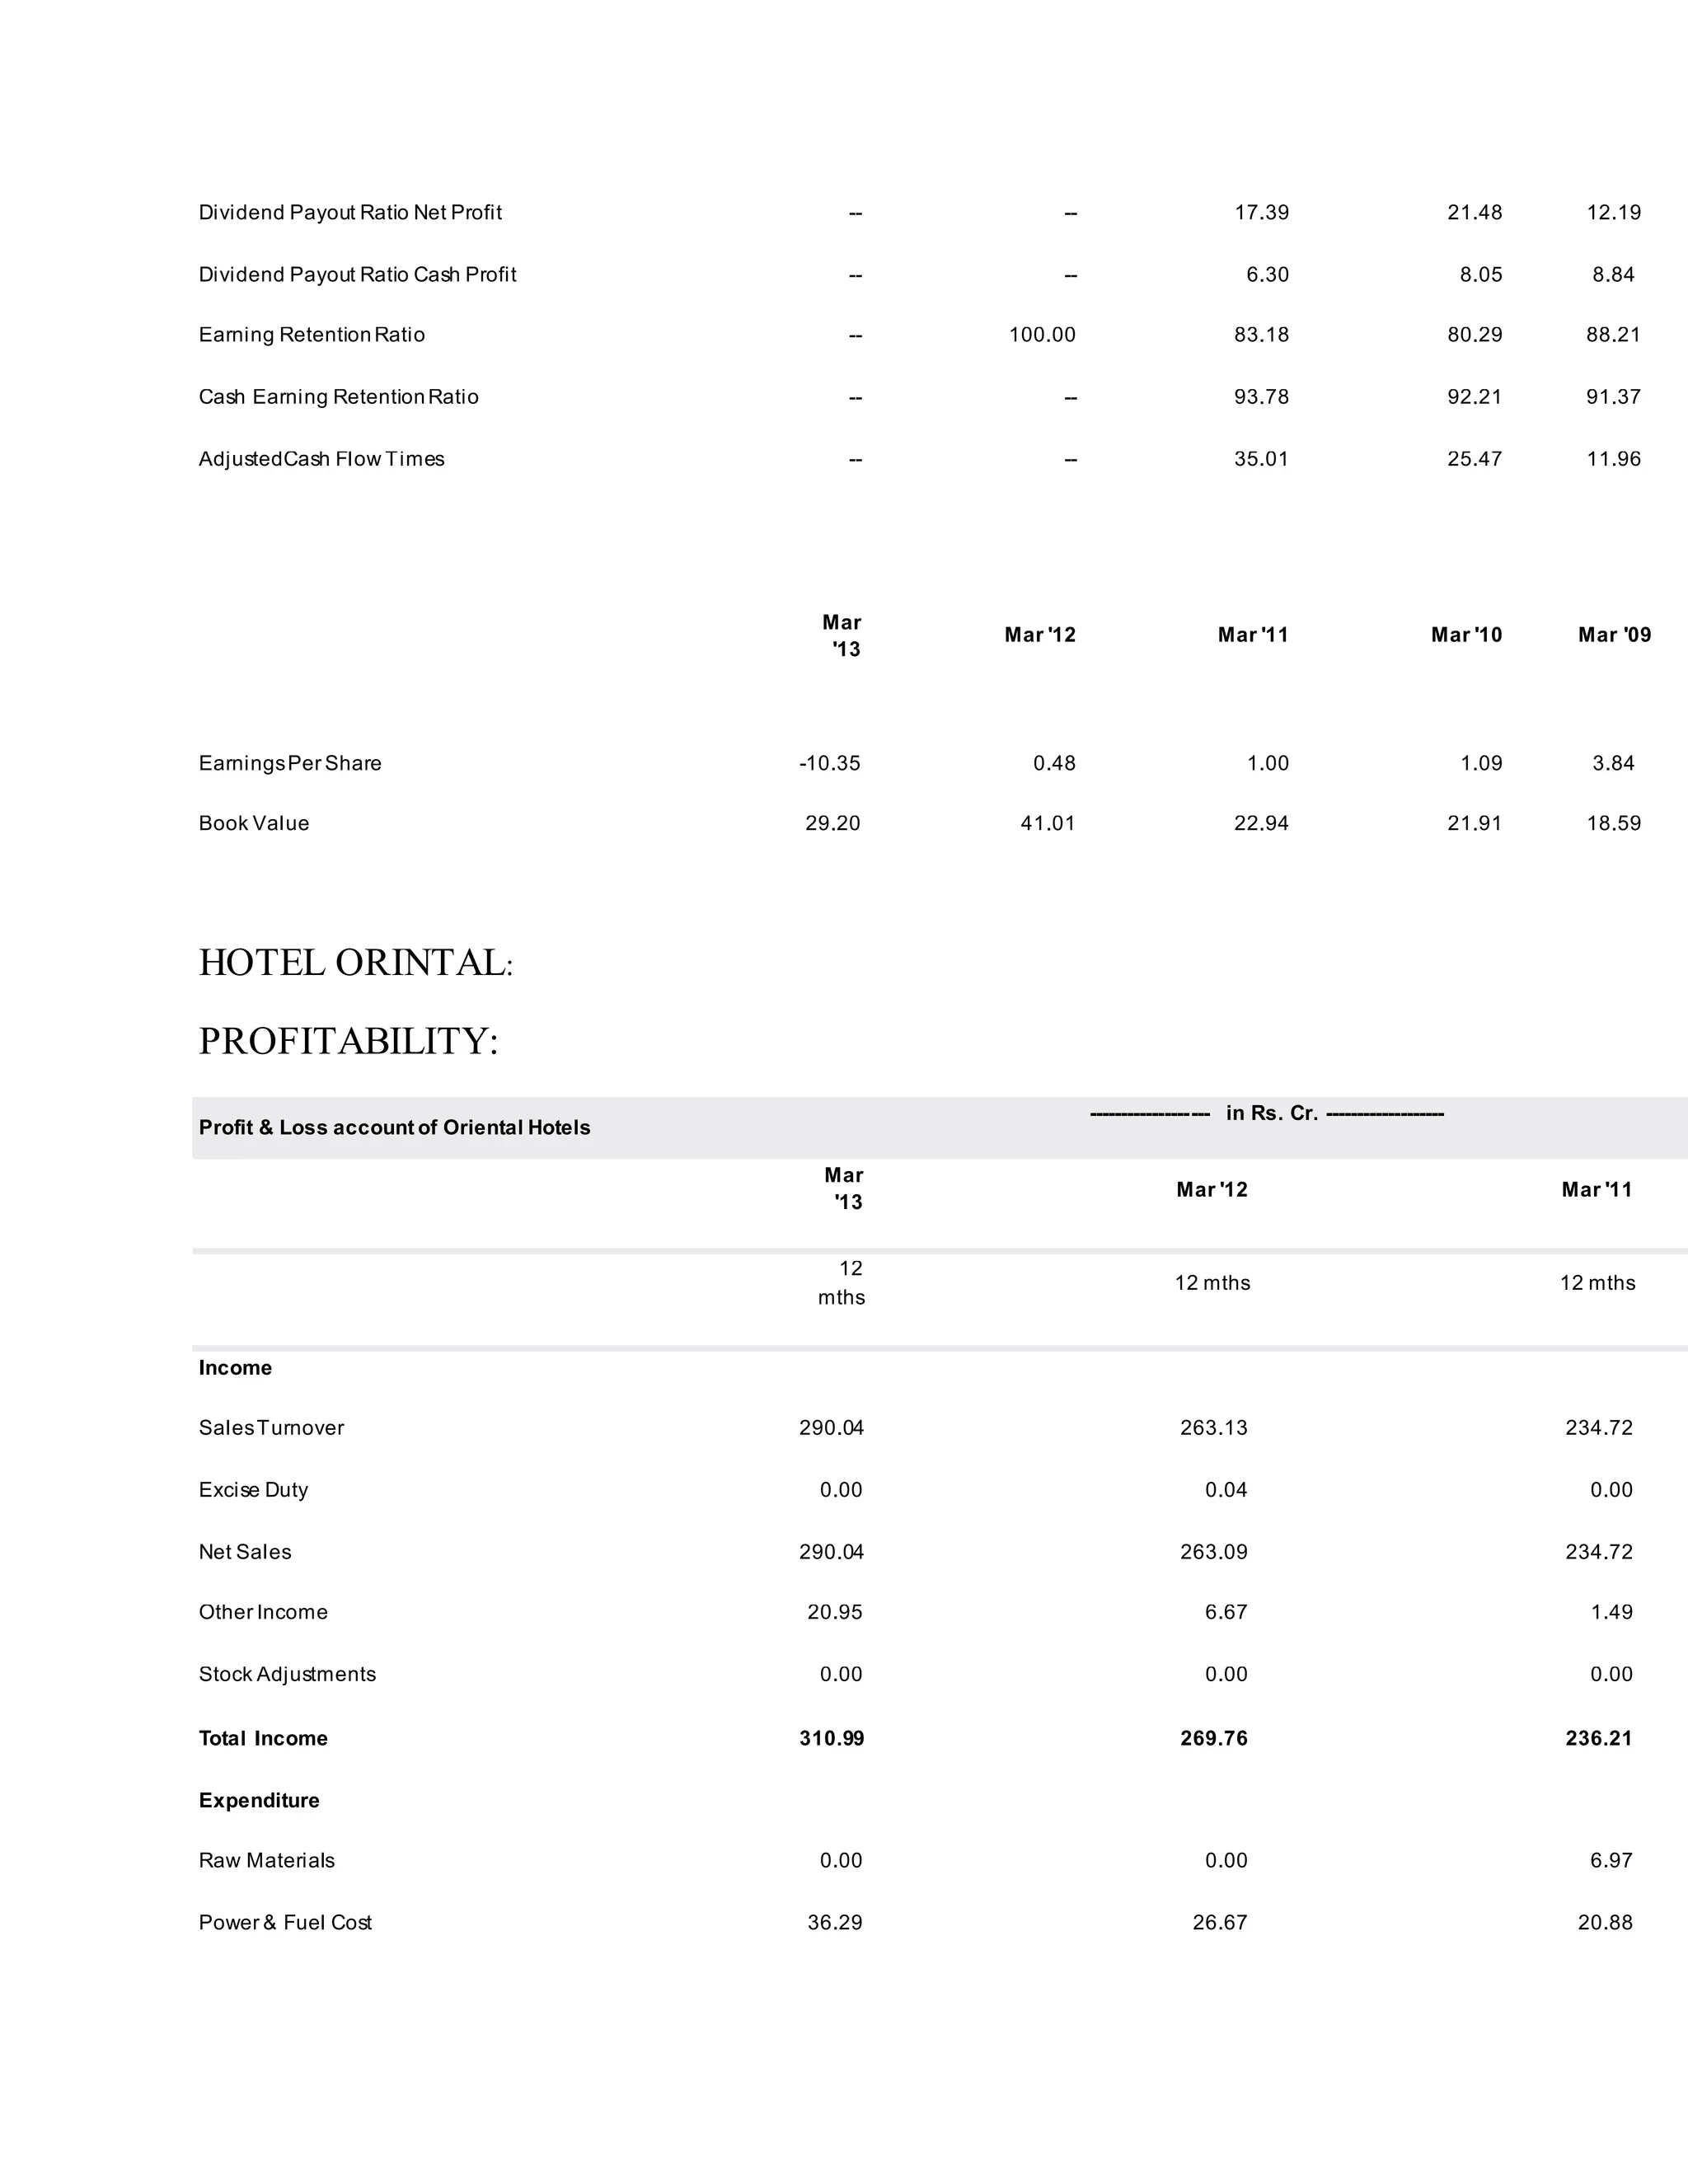
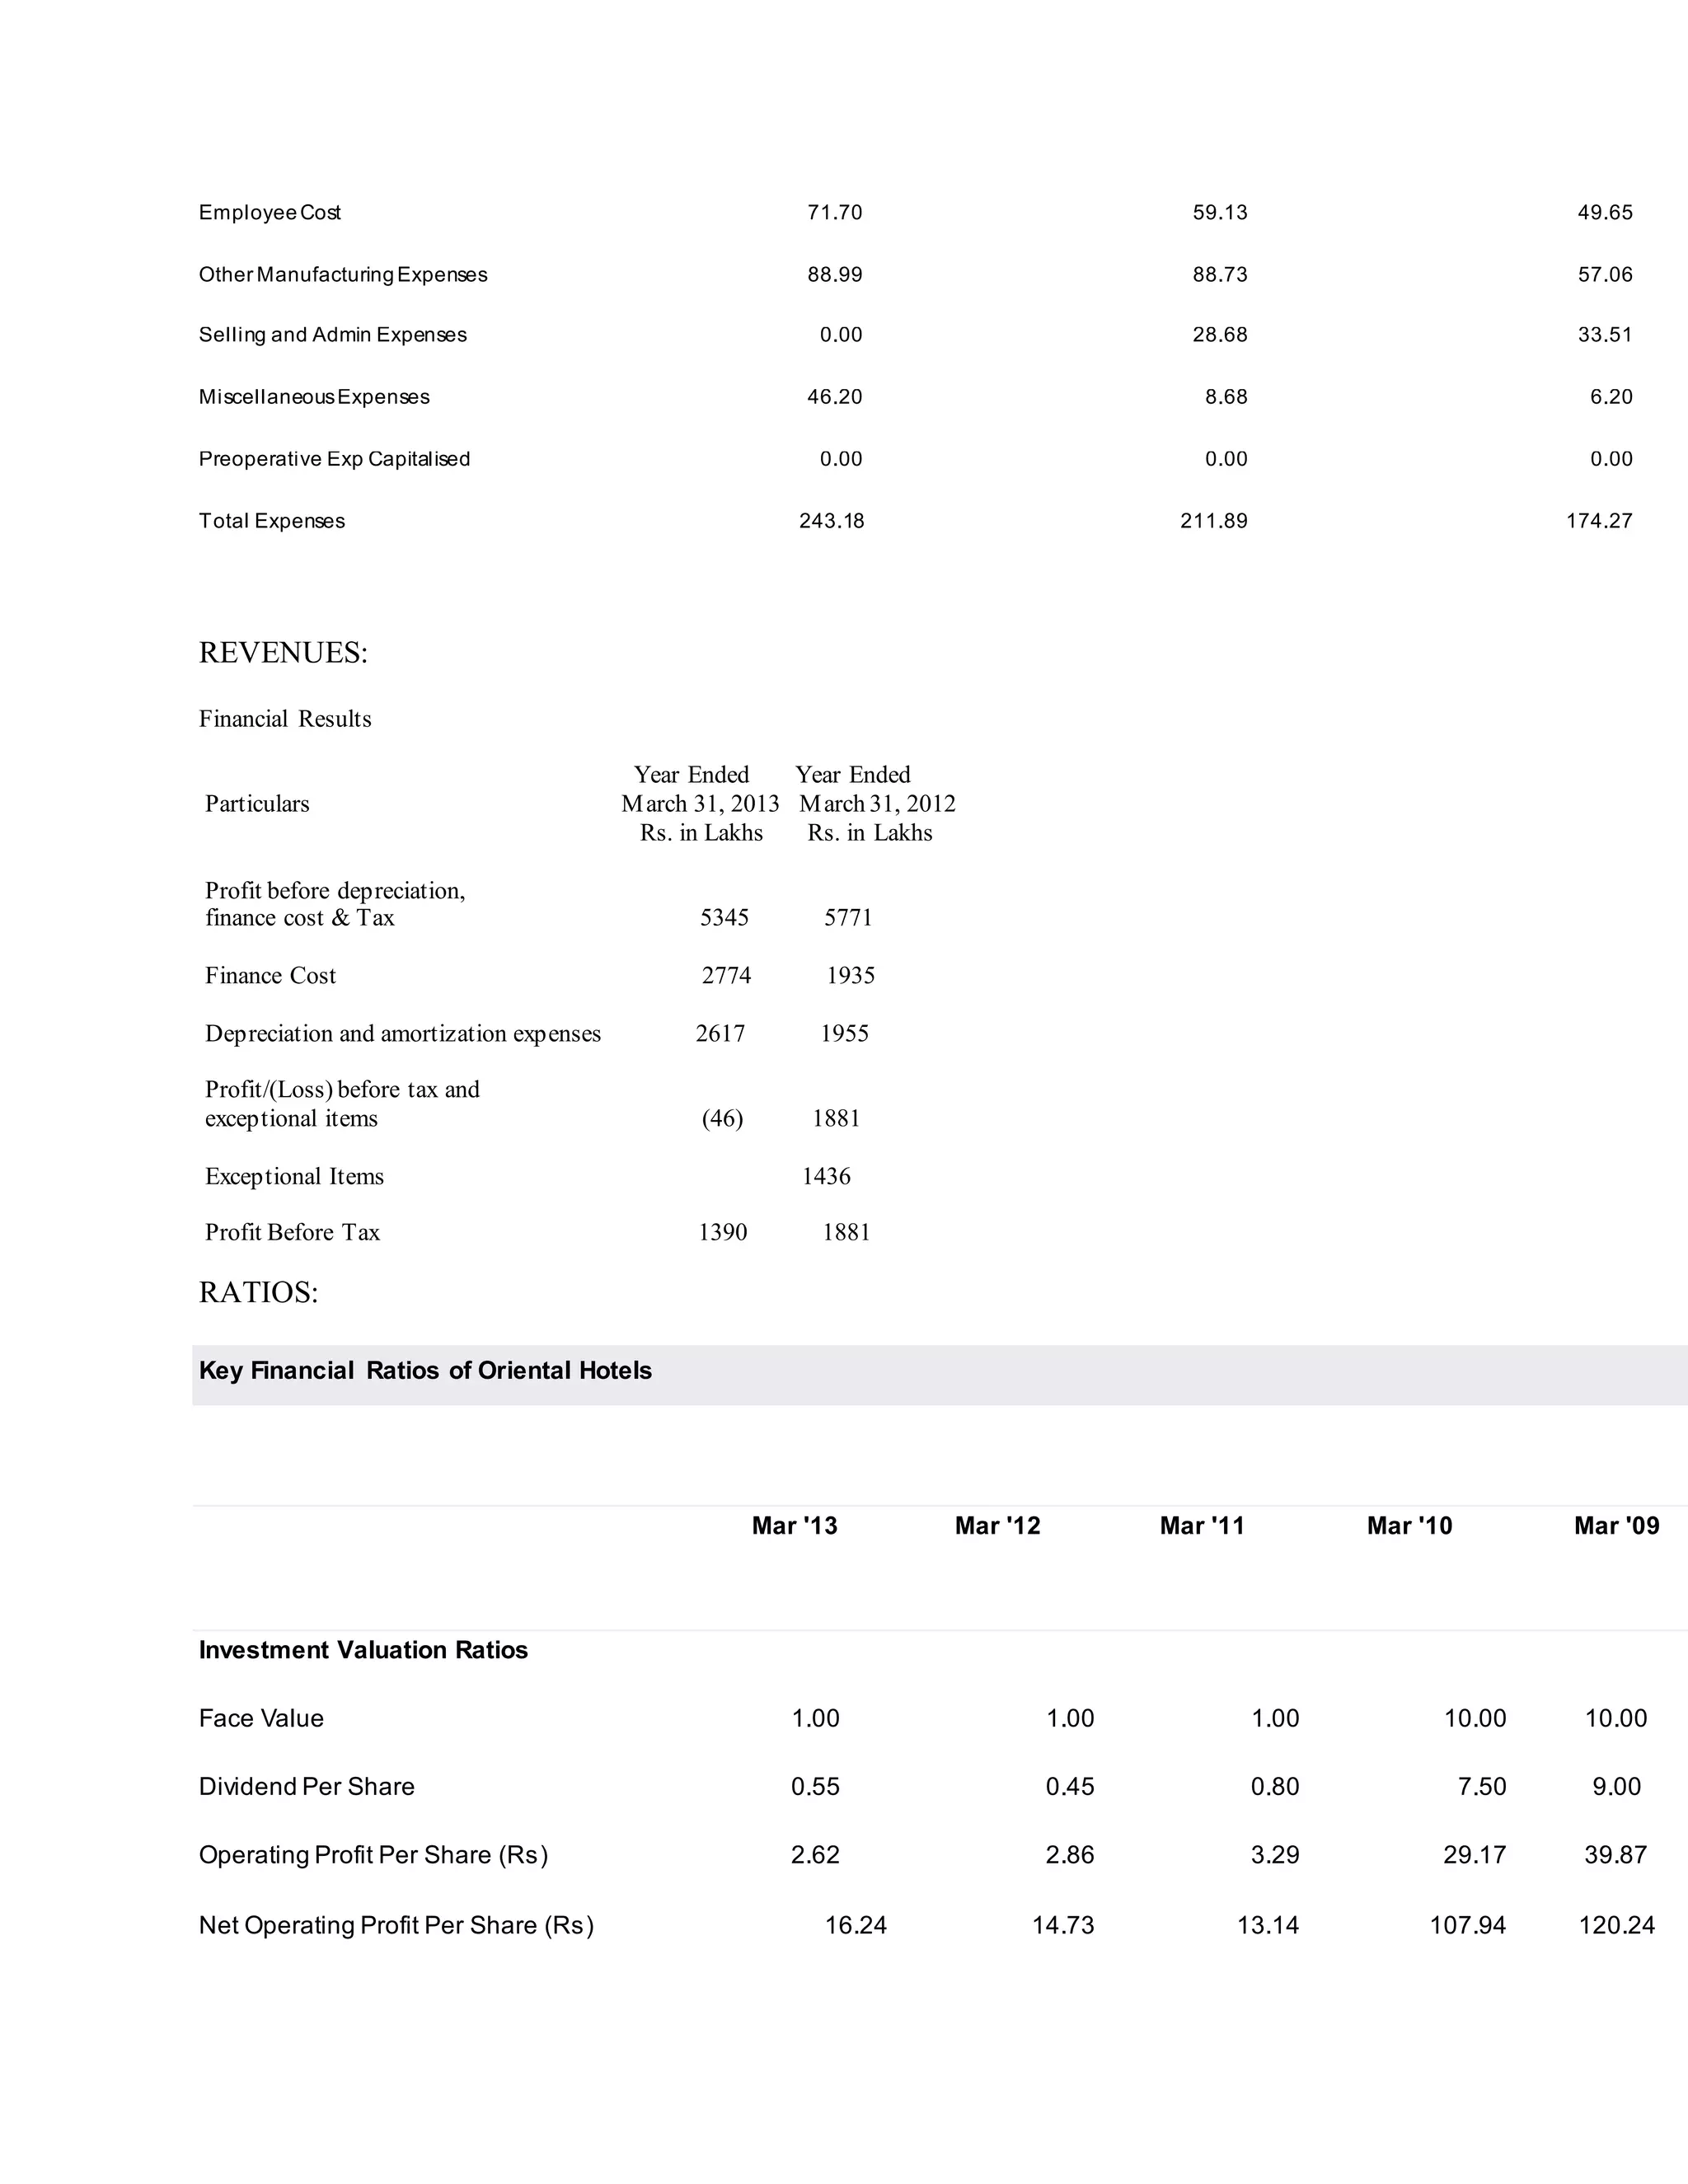
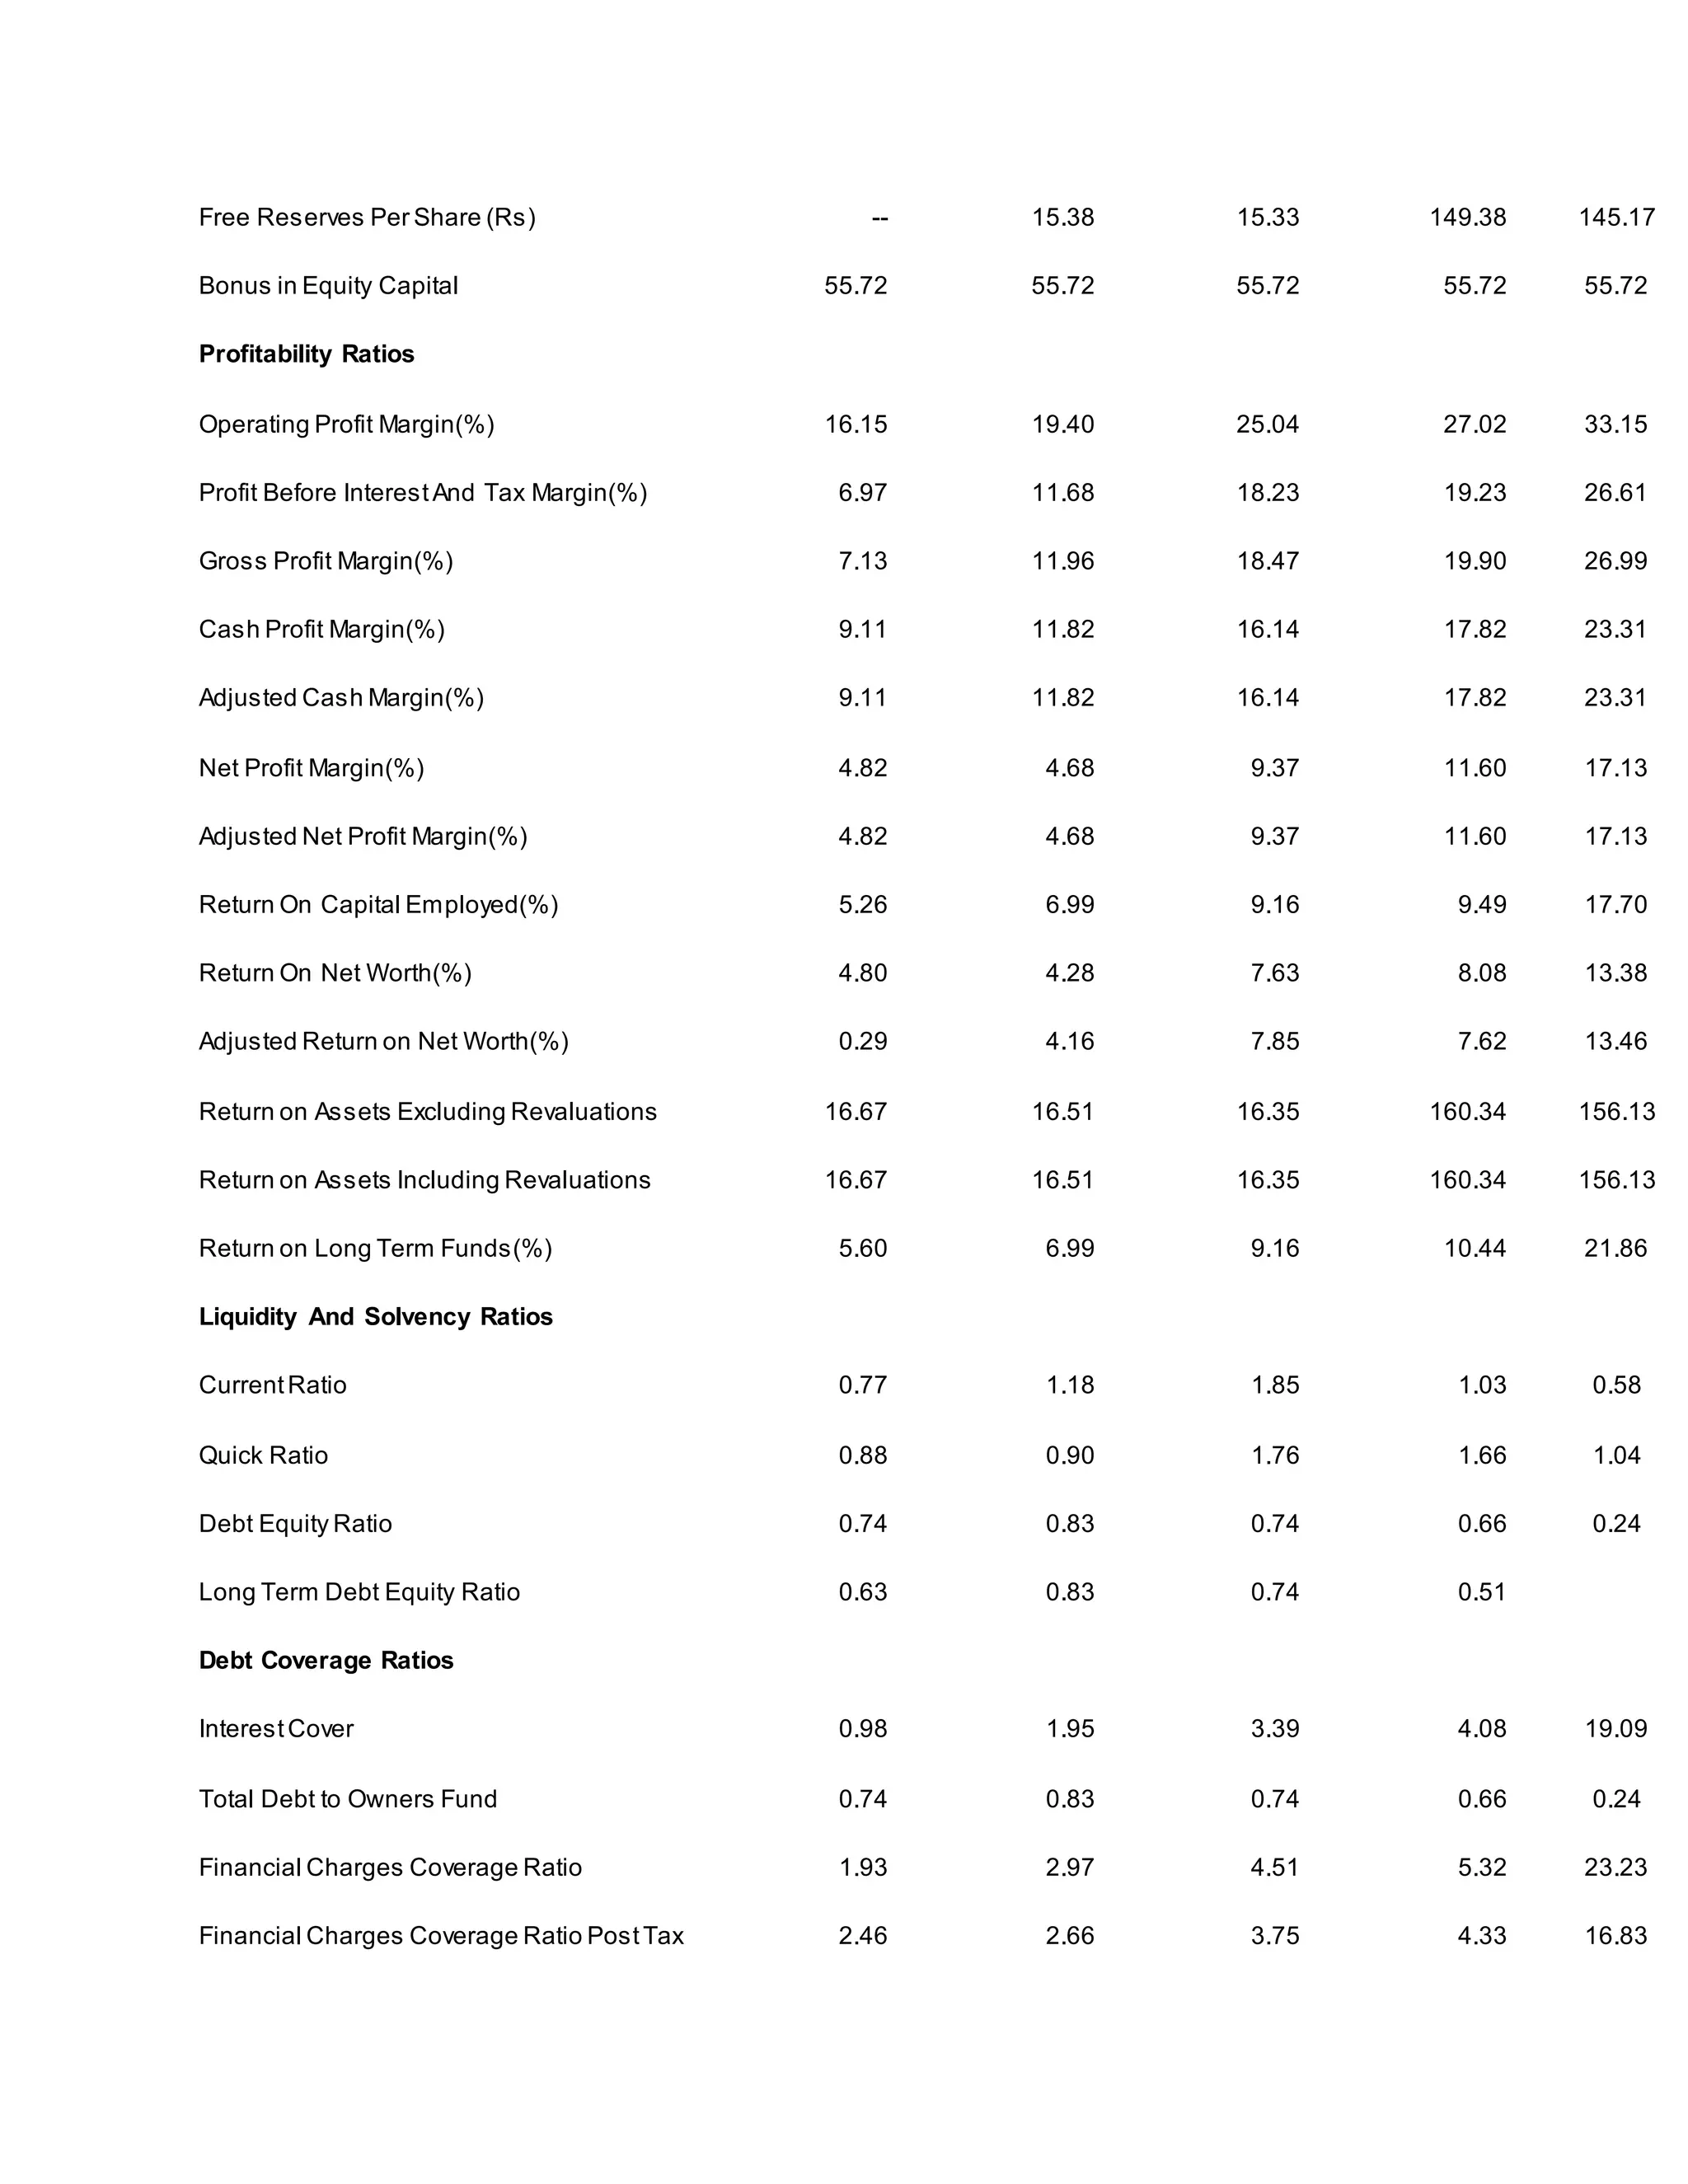
HOTEL ORIENTAL
SimonKeswick ,ChairmanEdouard Ettedgui, Group Chief Executive;Stuart Dickie, Chief
Financial OfficerMichael Hobson, Sales and Marketing Director; Terry Stinson, Development
Director and President, The Americas.
Simon Lindley Keswick (born 20 May 1942) is a Scottish businessman and the younger brother
of Sir Chips Keswick and Sir Henry Keswick.
He is a director of Matheson & Co. (owned by Jardine Matheson Holdings), Fleming Mercantile
Investment Trust, Hanson plc, Jardine Lloyd Thompson Group plc. and theMandarin Oriental
Hotel Group. He was previously Chairman of the Kwik Save Group plc
CORPORATE SOCIAL RESPONSIBILITY
The Tata Group has always held that what comes from the society, must, in reasonable measure,
go back to it. The Taj is proud to be a part of this legacy, and is deeply committed to serve the
community. We recognize that the community is not just another stakeholder in our businesses,
but serving the community, especially the underprivileged sections, is central to our core values.
We further believe that serving people in the form of corporate volunteering has positive spin-offs
by way of reviving a sense of bonding and the spirit of learning in our employees.
CORPORATE GOVERNANCE
The Indian Hotels Company Limited (“the Company”) has been practicing good Corporate
Governance even before Securities Exchange Board of India (SEBI) made it a mandatory](https://image.slidesharecdn.com/deskreportnew-140912112352-phpapp01/75/Desk-report-new-11-2048.jpg)


![Hospitality-Frankfinn [jaifar]](https://cdn.slidesharecdn.com/ss_thumbnails/hospitality-110218113505-phpapp02-thumbnail.jpg?width=640&height=640&fit=bounds)


![[DSC Europe 25] Dobrica Cosic - From Electrons to Innovation: How Granular Da...](https://cdn.slidesharecdn.com/ss_thumbnails/h4qk69zereaumbceubgr-dobrica-cosic-from-electrons-to-innovation-how-granular-data-and-analytics-are--251218085301-b982fb14-thumbnail.jpg?width=640&height=640&fit=bounds)
![[DSC Europe 25] Mathias Halkjær Petersen - The AI workforce revolution.pptx](https://cdn.slidesharecdn.com/ss_thumbnails/3xviexv7q5gojhdsyvat-the-ai-workforce-revolution-251218084820-f3c286ed-thumbnail.jpg?width=640&height=640&fit=bounds)


![[DSC Europe 25] Jakub Stech - AI for Public Good: How Data and AI Can Transfo...](https://cdn.slidesharecdn.com/ss_thumbnails/ayuupcru6ggr9f7vbp0q-1-251215095918-7b7334a3-thumbnail.jpg?width=640&height=640&fit=bounds)


![[DSC Europe 25] Jean Del Rosario - How to Reduce GenAI Costs up to 73.45%.pptx](https://cdn.slidesharecdn.com/ss_thumbnails/zjehcwqsiwjisav1znml-5-251217093201-eae4440a-thumbnail.jpg?width=640&height=640&fit=bounds)
![[DSC Europe 25] Miodrag Pesovic & Vladislav Radonjic - Federated Data Archite...](https://cdn.slidesharecdn.com/ss_thumbnails/gsbe3y5it5uhndi4e08e-1-251212103249-f1008e0c-thumbnail.jpg?width=640&height=640&fit=bounds)


![[DSC Europe 25] Ivan Peric - Intelligence Swarm Logic and Techno-Functional M...](https://cdn.slidesharecdn.com/ss_thumbnails/7my7c97fsduiccadgavw-2-251212103249-5a03f7c6-thumbnail.jpg?width=640&height=640&fit=bounds)


