Download to read offline
![N what weight of sample should be taken from a larger
mass of ore, so that the FSE will not exceed a specified
variance
N what is the possible FSE when a sample of a given
weight is obtained from a larger lot
N before a sample of given weight is drawn from a larger
lot, what is the degree of crushing or grinding required
to lower error to a specified FSE.
The FSE is a loss function during sampling (Pitard, 1993).
The higher the FSE, the greater the likely financial loss.
For any process where the FSE escalates, there is an
associated loss due to uncertainty.
A number of difficulties have been encountered in the
practical application of the FSE equation to gold deposits
(François-Bongarçon, 1993, 1998; François-Bongarçon
and Gy, 2002; Dominy, 2007; Minnitt and Assibey-
Bonsu, 2009; Dominy et al., 2010a). These include:
N ease with which inconsistency in equation parameter
units can yield erroneous results
N difficulty in understanding the nature and meaning of
the various parameters and how to adequately set/
model their values
N difficulty in designing and performing the calibration
and characterisation experiments required to custo-
mise the key parameters.
A key technical issue with the use of the FSE equation is
the numerical value of the power in the liberation factor.
Gy (1979) proposed the value of 0?5 as a general case only
for all minerals. This value gives reasonable results for
various types of ore and at different grades; however, it
often gives unrealistic values when applied to low-grade
ores such as gold. François-Bongarçon and Gy (2002)
quote an example where an optimum sample mass of
13?9 t of blast-hole cuttings was required for a fine-
grained gold ore, clearly an unrealistically large sample.
Appropriate application of the FSE equation lies in
estimating the theoretical FSE made at successive mass
reduction stages. They may not be correct in absolute
terms, but are to some extent comparable and selection
stages introducing large errors can be improved and
redundant stages (i.e. those with minor errors) can be
eliminated.
We assert that proper ore characterisation is critical to
the application of the FSE equation and of the wider TOS
to ensure reality and practicability come together (Dominy
and Platten, 2007; Dominy et al., 2010c; Dominy et al.,
2008a, 2008b; Dominy et al., 2011b). There are instances
where impractical protocols are required to achieve correct
sampling particularly in the presence of coarse gold
(Dominy et al., 2000; Dominy and Petersen, 2005;
Johansen and Dominy, 2005; Cintra et al., 2007).
Further discourse of the TOS and FSE equation is
given in Gy (1979, 1992, 1998), François-Bongarçon
(1993), Pitard (1993, 2005), Frempong (1999), Minnitt
(2007) and Dominy et al. (2010a).
Defining the liberation diameter
The part of the FSE equation that reflects the nature and
heterogeneity of the ore type in question is the sampling
constant (K). It is dependent on the microscopic
geostatistical properties of the minerals, and varies with
gold grade and liberation size. As liberation size reduces,
so the value of K reduces; conversely, as grade reduces,
K gets larger. Large K values are related to samples with
a greater liberation size and low grade.
A key problem of defining K and applying the FSE
equation is the determination of the liberation diameter
(dL: Gy, 1979; Pitard, 1993; François-Bongarçon and Gy,
2002; Dominy, 2007; Minnitt and Assibey-Bonsu, 2009;
Dominy et al., 2010a). Using the original definition of dL
(Gy, 1979), very low sampling constant values are
generally defined for gold ores. Thus for gold deposits,
the dL value should be re-defined as dLmax to represent the
coarse most influential fraction. This is effectively the
screen size that retains 5% of gold given a theoretical
amount of liberated gold.
Approaches to dLmax characterisation range from
guesswork to the implementation of HT or DSA. The
results of both HT and DSA can be used to calibrate the
FSE equation, effectively defining dL through estimating
K (Gy, 1979; François-Bongarçon, 1993; Pitard, 1993;
Minnitt et al., 2007; Minnitt and Assibey-Bonsu, 2009).
The HT is most commonly applied calibration
method in the mining industry. The DSA approach is
both complex and time consuming to apply, so relatively
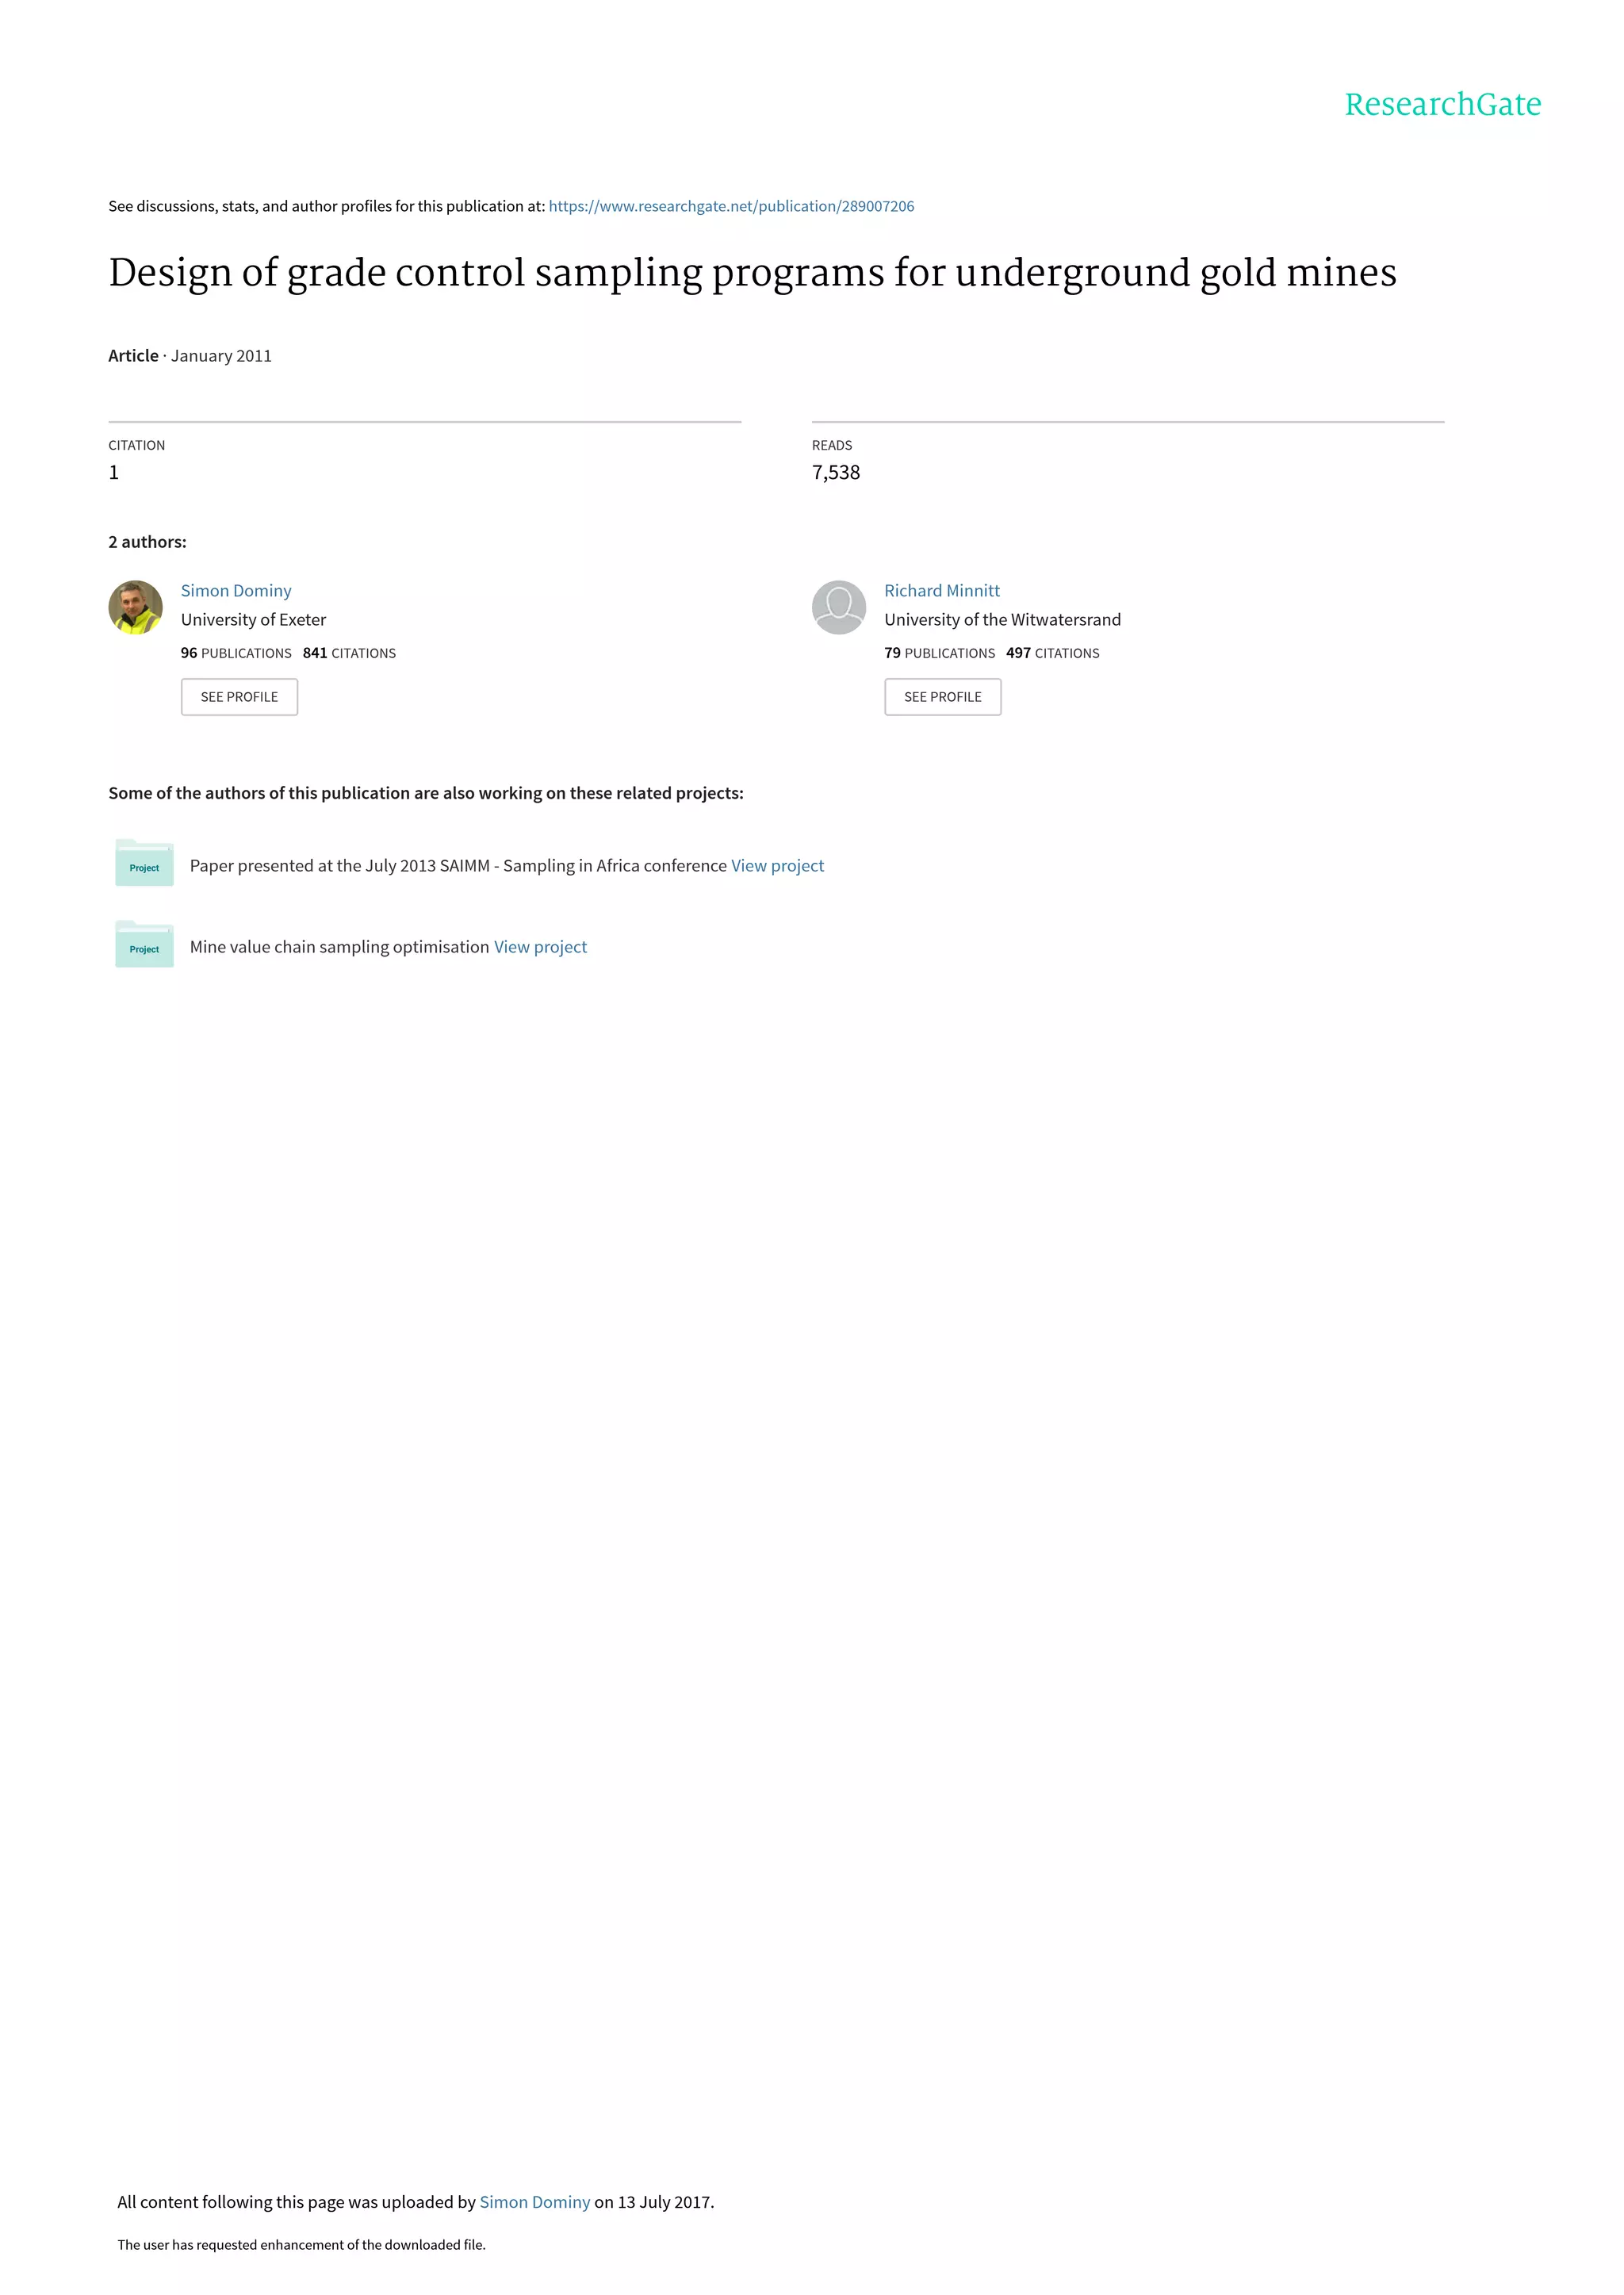
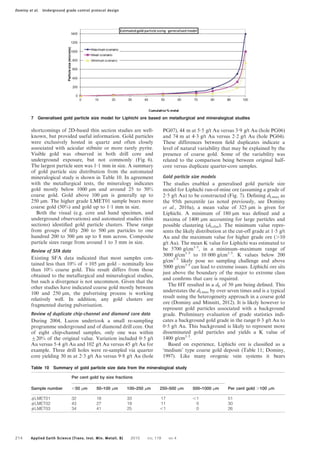
Table 6 Typical studies and outcomes from a ‘sampling’ characterisation programme (after Dominy et al., 2010c).
Outcomes from Stages 1 to 3 contribute to metallurgical characterisation. Multiple samples will provide a clearer
understanding of all outcomes and potential grade and spatial variability
Stage Study Outcomes
1 Geology and mineralogy [in situ and sample
studies – rock and core samples]
N Geological context of sample(s)
N Gold deportment and mineralogy (free gold
versus gold in sulphides)
N In situ gold particle size range and distribution
N Proportion of coarse versus fine gold
N Clustering effects
2 Metallurgical testing N Sample head grade
[bulk samples of .50 kg each] N GRG
[note does not include comminution studies] N Leach (gold in tailings/potential refractory gold)
N Partitioning between free gold and refractory gold
N Mineralogy of concentrate and tails
3 Coarse gold determination N Coarse gold particle size and abundance
[same sample as Stage 2 and based on gold
liberated during that stage]
4 Data integration N Gold particle size curve(s)
N Liberation diameters and variability
N Degree and impact of clustering
Dominy et al. Underground grade control protocol design
208 Applied Earth Science (Trans. Inst. Min. Metall. B) 2010 VOL 119 NO 4](https://image.slidesharecdn.com/2011detalugcgdesignliphichicaseaesb-210921030048/85/Design-grade-control-5-320.jpg)

![moderate quantities (25 to 50%) of 100 to 300 mm gold.
In addition, there is likely to be some pseudo-coarse gold
effect where finer gold particles are in clusters. This is in
contrast to the Bendigo system which classifies as an
‘extreme’ coarse gold ore. At Bendigo, diamond drilling,
120 t development bulk sampling and 100 kg mini-bulk
samples were used during feasibility (Johansen and
Dominy, 2005) to assess grade. A proxy-based system
was developed for grade control (Dominy et al., 2009;
Dominy et al., 2010b).
Sample mass requirements
Based on the identification of coarse gold in Liphichi
ores, the Poisson approach was used to estimate likely
sample mass requirements (Dominy et al., 2010c).
Sample mass expectations based on various grade-gold
liberation diameter scenarios are in Table 12. The ROM
grade mass to achieve ¡20% precision is 16 kg. This is
considered a maximum mass value.
Existing underground sampling programme
Overview
During 2005 to 2006, the sampling strategy at Liphichi
involved collection of face (linear chip-channel), muck
‘grab’ pile (blasted development rounds) and NQ-sized
core samples. Every development face was chip sampled
and muck-pile sampled. Core samples were taken as 1 m
composites in mineralised zones. A two to three man
team using lump hammers and chisels cut an even
channel for face samples. Chippings from each channel
fall onto a tarpaulin and are bulked together to form a
total sample. The total sample of around 30 kg was then
reduced in size by so-called ‘fractional shovelling’ to
produce a final sample of 15 kg for laboratory submis-
sion. Muck pile samples were taken as a series of cuts
across the pile as the broken rock is bogged by hand.
Approximately 15 kg was submitted to the laboratory.
NQ drill core was logged and mineralised sections cut in
half on approximately 1 m lengths and submitted to the
laboratory (2 to 3 kg).
All samples were submitted to a commercial labora-
tory in Bolivia. On arrival, samples were dried, weighed
and crushed in one pass to P70 1?7 mm using a Rhino
crusher. After crushing, all samples were reduced to a
mass of 1 kg by riffle splitting and then pulverised to P90
150 mm prior to screening and fire assay. The screen
undersize was triplicate fire assayed. All items of
equipment were compressed air-blast cleaned between
samples and the pulveriser bowl cleaned using silica
sand. All sub-samples were shipped to North America
for fire assay.
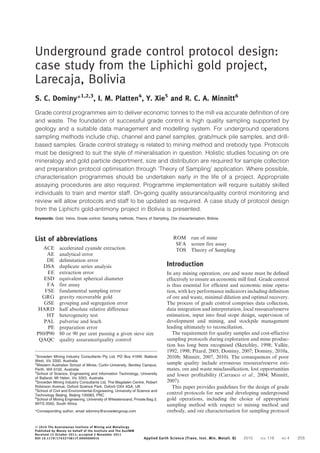
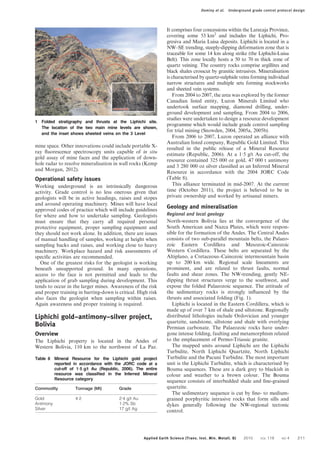
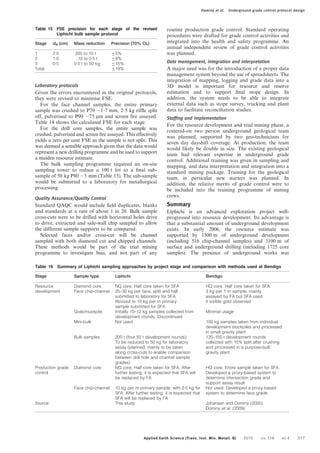
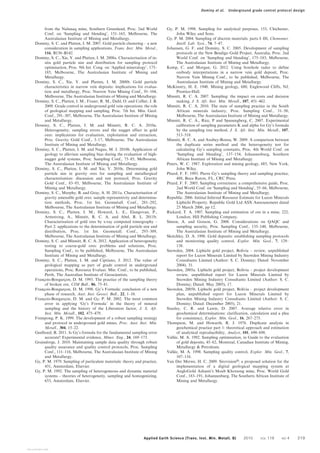
Table 12 Indicative in situ sample size requirement for Liphichi ore based on different scenarios. Estimated using the
Poisson method – mass calculated to precision of ¡20% at 95% confidence limits
Grade (g/t Au)
Liberation diameter
(dLmax or dLclus) (mm)
Indicated sample
mass (kg) Comment
2 1000 435 ROM ore assuming clustered particles
with composite size to 1 mm
2 325 16 ROM grade ore
0.3–0.5 50 1 Background grade material with fine-gold liberation diameter
Table 11 Key results from the characterisation study of Liphichi ore and comparison to Bendigo ore
Characteristic Liphichi Bendigo
Gold particle size dLmax: 325 mm dLmax: 10 000 mm
.100 mm: 40%; .1000 mm: ,1%;
.10 000 mm: 0%
.100 mm: 90%; .1000 mm: 60%;
.10 000 mm: 5%
Distribution As isolated particles and clusters.
More coarse gold and clustering in
higher grade ore
As isolated particles and clusters.
More coarse gold and clustering
in higher grade ore
Clustering observed, up to dLclus:
1400 mm
Clustering observed, up to dLclus:
10 000 mm
Deportment Free gold in quartz and locally
associated with stibnite
Free gold in quartz and locally
associated with arsenopyrite
and/or other sulphides
Grade ROM grade of around 2–2.5 g/t Au ROM grade of around 6–8 g/t Au
Sampling constant (K) 5700 g/cm1?5
[dLclus: 40 000 g/cm1?5
] 200 000 g/cm1?5
[dLmax and dLclus]
GRG .30% .65%
Indicative in situ
sample size
ROM: 16 kg [Clustered: 1.2 t] ROM: 22 t
Background grade Around 0.3 g/t Au and dominated
by ,100 mm particles
Around 1.2 g/t Au and dominated by
,100 mm particles
HT results 40 piece test 50 piece test
ESD58.3 cm; K5145 g/cm1?5
;
dL550 mm
ESD519.4 cm; K5350 g/cm1?5
;
dL5500 mm
Visible gold Observed up to 1 mm in size as
individual particles and clusters up
to 2 mm in (composite) size
Observed up to 10 mm in size as
individual particles and clusters up
to 10 mm in (composite) size
Comment Moderate-nugget (around 50–60%)
moderate-coarse gold system
Extreme-nugget (.90%) extreme-coarse
gold system
Sampling difficulty Low-moderate High-extreme
Source This study Johansen and Dominy (2005)
Dominy et al. Underground grade control protocol design
Applied Earth Science (Trans. Inst. Min. Metall. B) 2010 VOL 119 NO 4 215](https://image.slidesharecdn.com/2011detalugcgdesignliphichicaseaesb-210921030048/85/Design-grade-control-12-320.jpg)

This document discusses considerations for designing grade control sampling programs for underground gold mines. It describes common sampling methods like chip, channel, and drill-based samples. The optimal sampling strategy depends on the mining method and orebody characteristics. Proper characterization of the ore mineralogy and gold particle distribution is important for designing sampling and sample preparation protocols. A case study of protocol design from the Liphichi gold project in Bolivia is presented to illustrate these concepts. Geological mapping also supports effective grade control by aiding orebody definition and stope design. Quality assurance measures are necessary to ensure sampling programs provide accurate grade information over the mine life.


![Research Design [Creswell]](https://cdn.slidesharecdn.com/ss_thumbnails/eng60115jan2013-1-130115121702-phpapp01-thumbnail.jpg?width=640&height=640&fit=bounds)


