MEASURES OF CENTRALTENDENCY
LESSON OUTLINE
THE ARITHMETIC MEAN
THE MEDIAN
THE MODE
THE WEIGHTED MEAN
7.
INTRODUCTION
- Statistics involvesthe
collection, organization
summarization,
presentation, and
interpretation of data.
- One of the most basic
concepts involves finding
measures of central
tendency of a set of
numerical data.
8.
2 BRANCH OF
STATICS:
DescriptiveStatistics
• -statistics the involves the
collection, organization,
summarization, and
presentation of data.
Inferential Statistics
• -branch of statistics that
interpret and draws
conclusion from the data.
Is the mostcommonly used measures of central
tendency.
The Arithmetic Mean of a set of numbers is often
referred to as simply the mean or“average”.
To find the mean for a set of data, find the sum of
the data values and divide by the number of data
values.
THE ARITHMETIC MEAN
11.
EXAMPLE:
❑ Suppose Sheenais a senior at a university. In a few
months she plans to graduate and start a career as a
landscape architect. A survey of five landscape
architects from the last year’s senior class shows that
they received job offers with the following monthly
salaries.
₧43,750 ₧39,500 ₧38,000 ₧41,250 ₧44,000
12.
Before Sheena
interviews fora job,
she wishes to
determine an
average of these 5
salaries.
This average should
be a “ central”
number around
which the salaries
cluster.
Continuation of Example:
₧43,750 ₧39,500 ₧38,000 ₧41,250 ₧44,000
13.
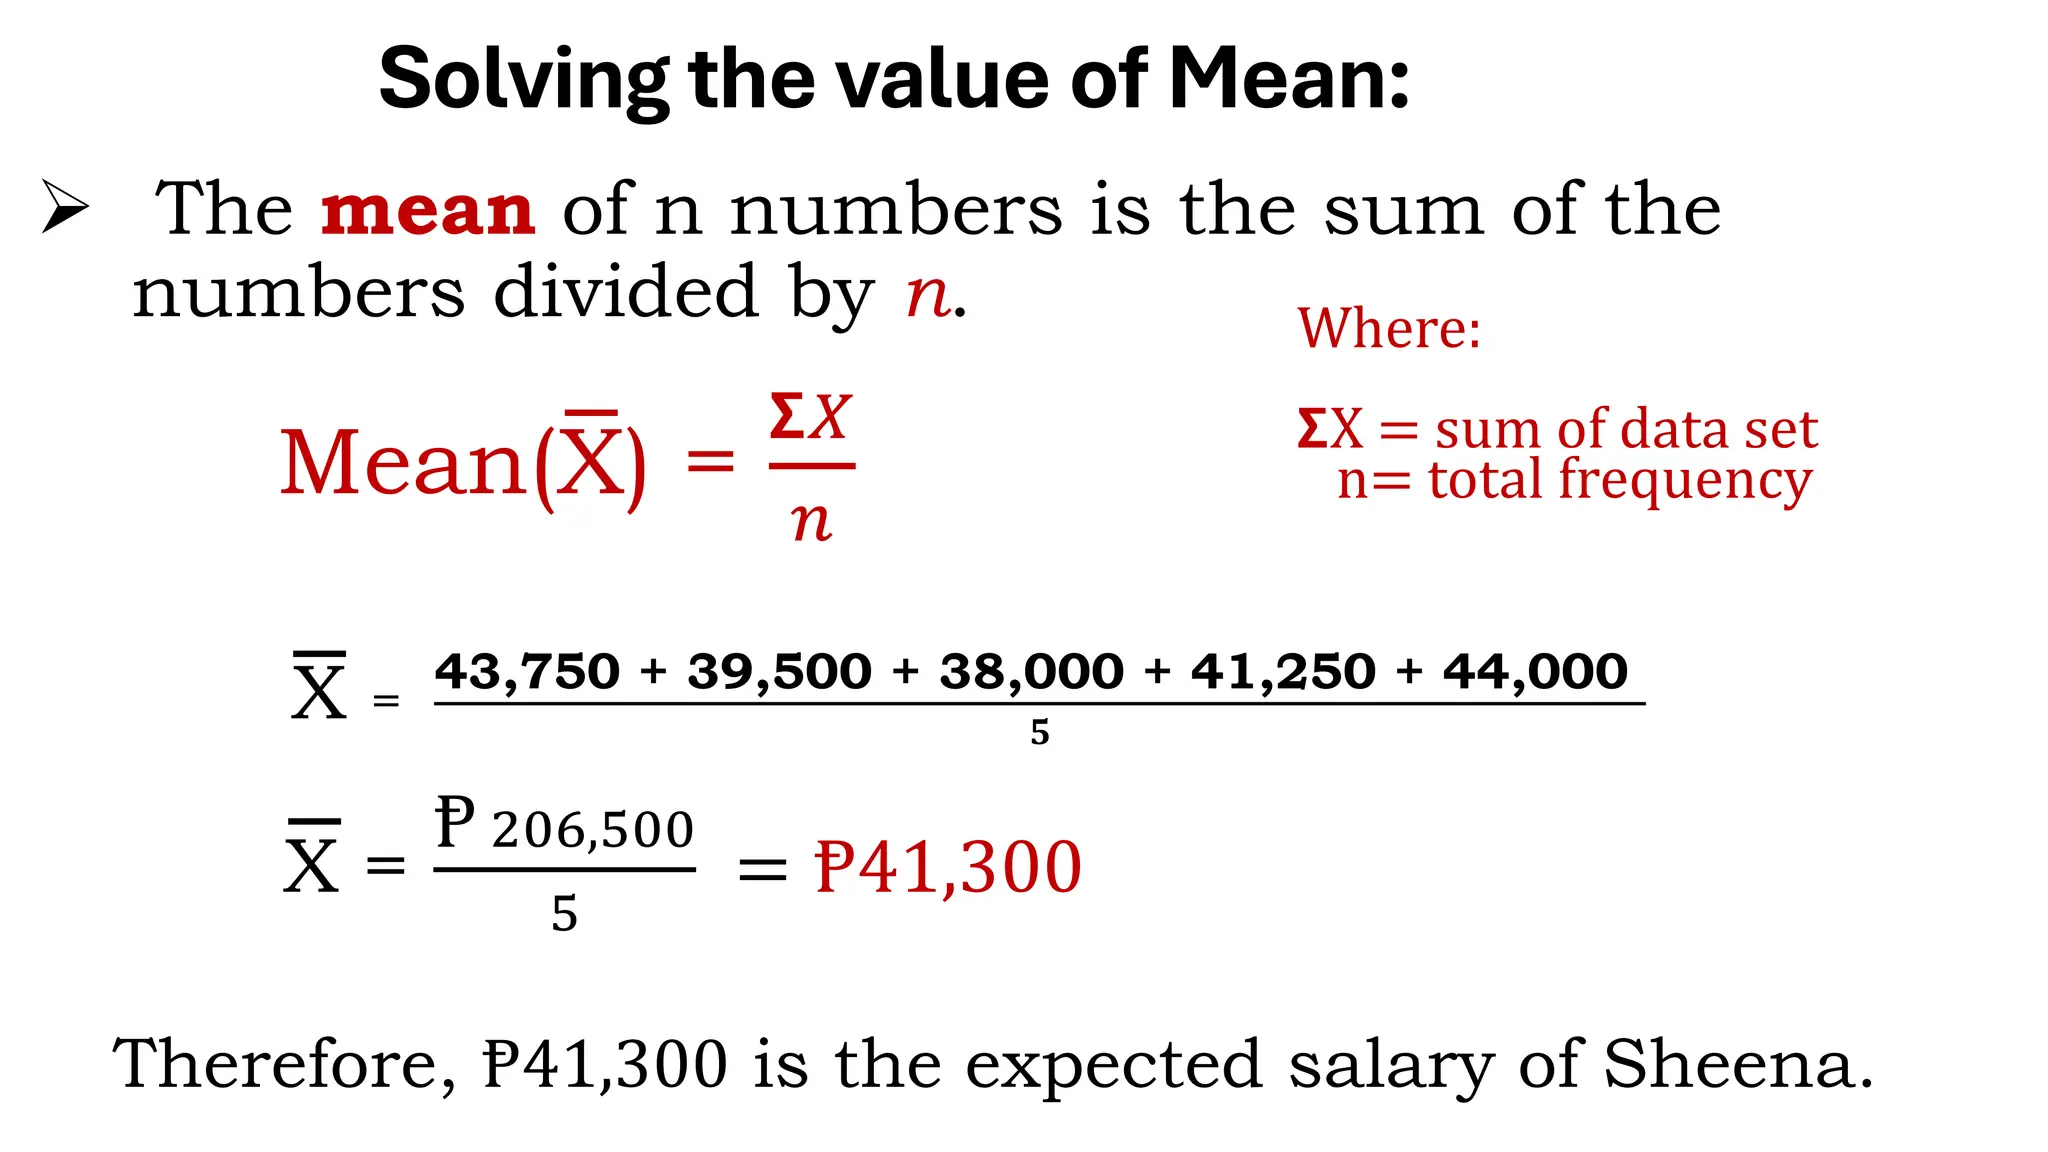
Solving the valueof Mean:
Mean(X) =
𝝨𝑋
𝑛
➢ The mean of n numbers is the sum of the
numbers divided by n.
X =
43,750 + 39,500 + 38,000 + 41,250 + 44,000
𝟓
X =
Ᵽ 206,500
5
= Ᵽ41,300
Where:
𝝨X = sum of data set
n= total frequency
Therefore, Ᵽ41,300 is the expected salary of Sheena.
14.
THE MEDIAN
Another
type of
averageis
the
median.
The median is the middle
number or the mean of the
two middle numbers in a list
of numbers that have been
arranged in numerical order
from smallest to largest or
largest to smallest.
15.
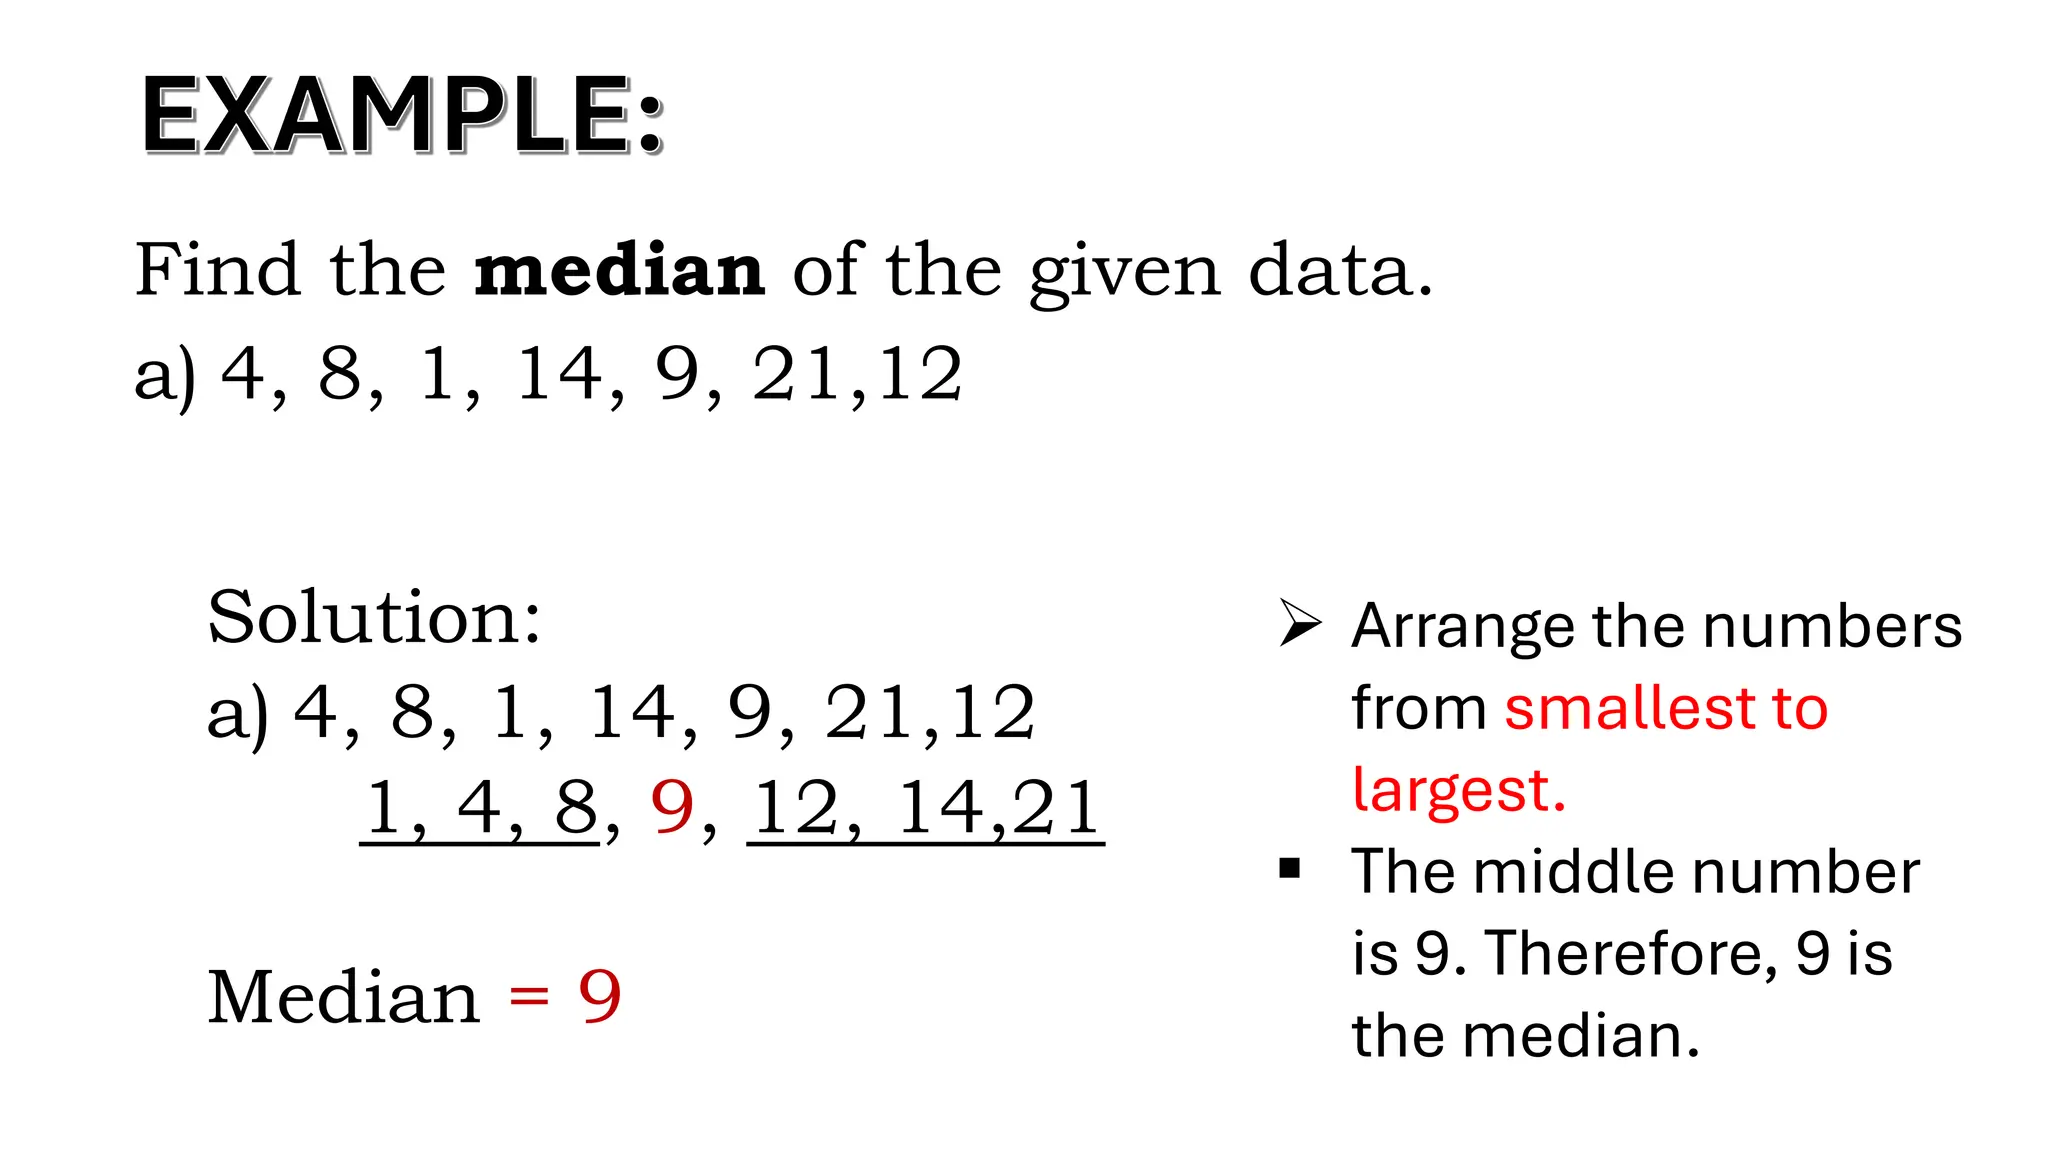
Find the medianof the given data.
a) 4, 8, 1, 14, 9, 21,12
EXAMPLE:
Solution:
a) 4, 8, 1, 14, 9, 21,12
1, 4, 8, 9, 12, 14,21
Median = 9
➢ Arrange the numbers
from smallest to
largest.
▪ The middle number
is 9. Therefore, 9 is
the median.
16.
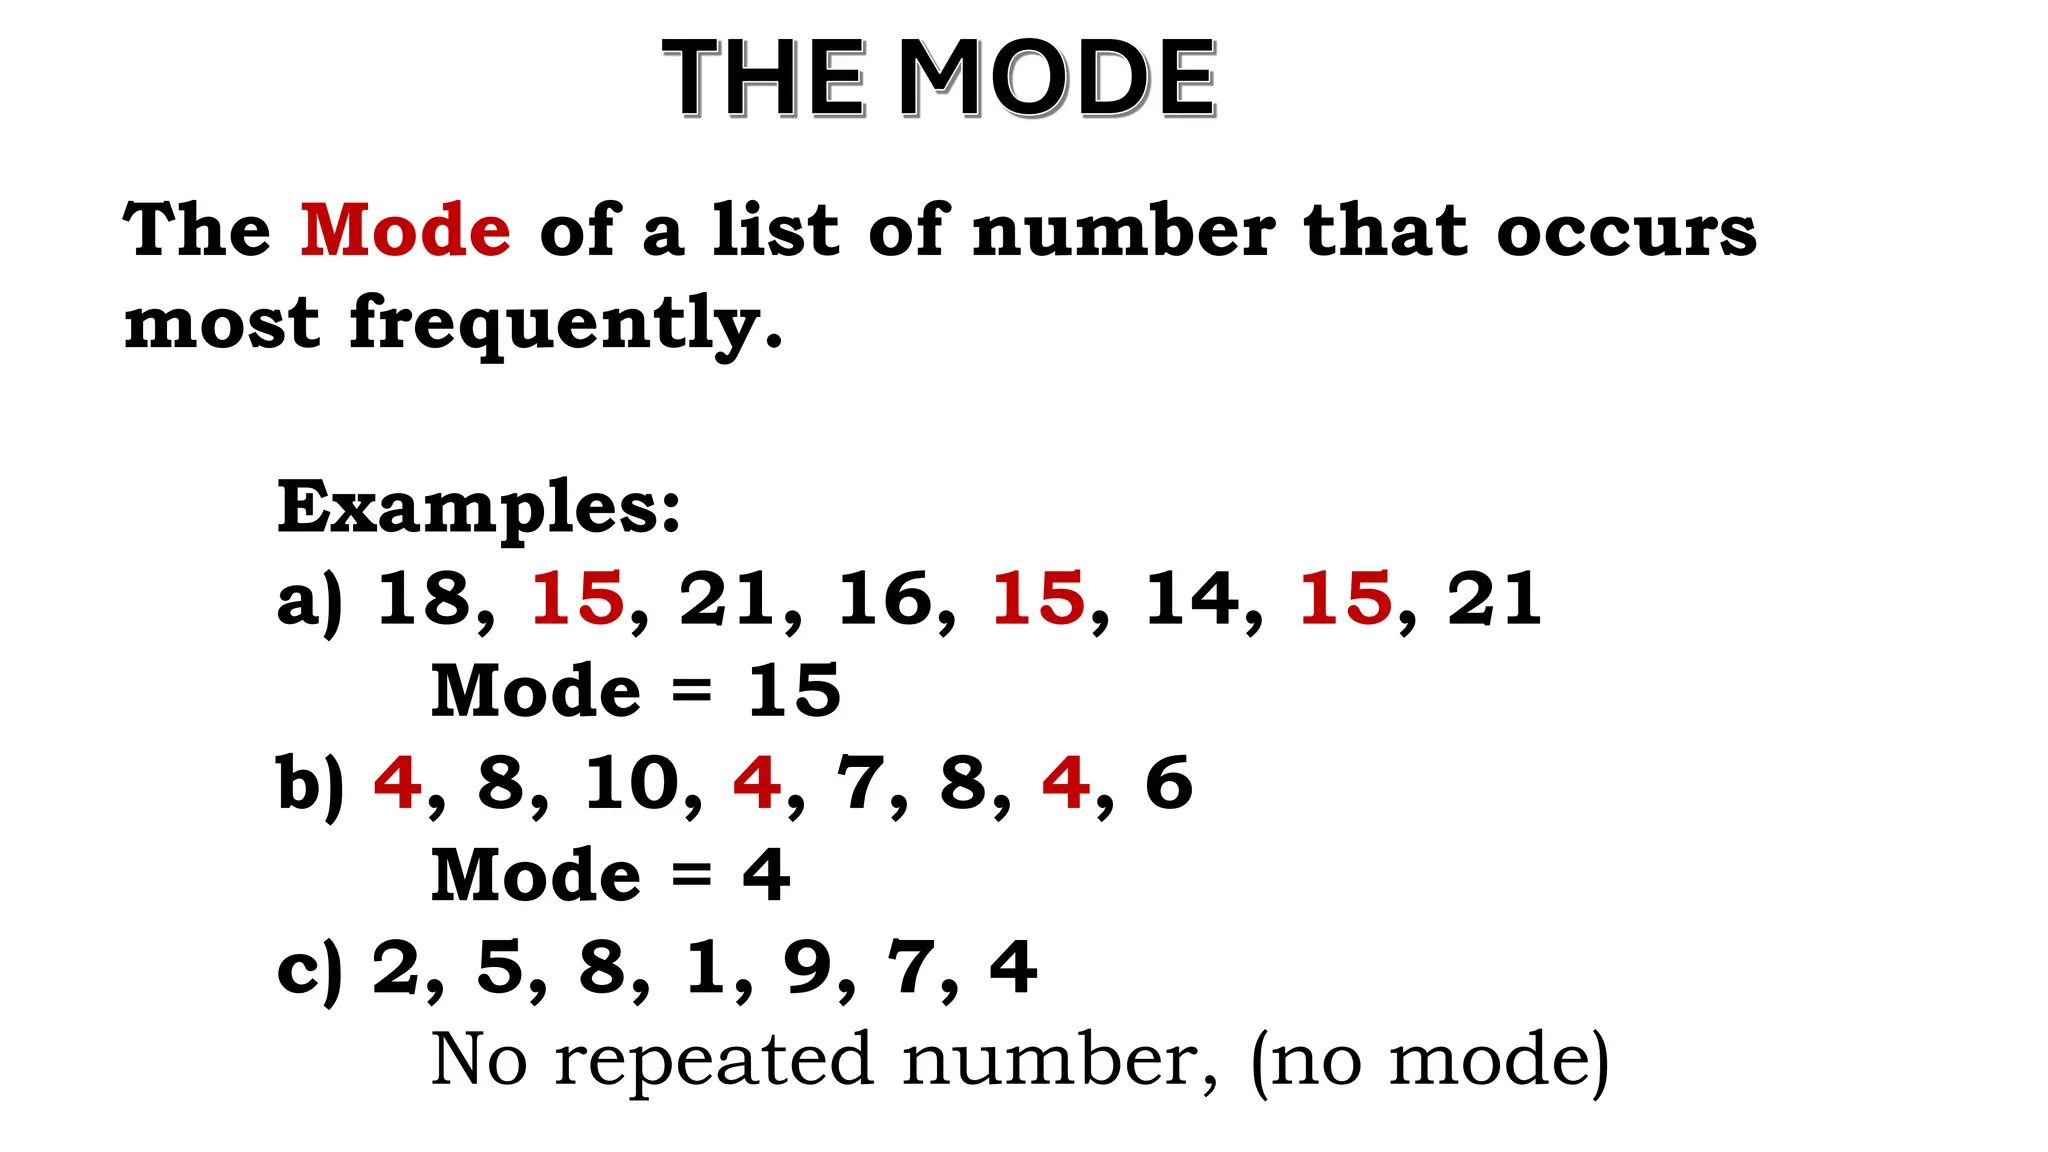
THE MODE
The Modeof a list of number that occurs
most frequently.
Examples:
a) 18, 15, 21, 16, 15, 14, 15, 21
Mode = 15
b) 4, 8, 10, 4, 7, 8, 4, 6
Mode = 4
c) 2, 5, 8, 1, 9, 7, 4
No repeated number, (no mode)
17.
THE WEIGHTED MEAN
➢Theweighted mean is a type of average
where some values contribute more to the
final result than others.
➢Unlike a simple average, where all values
are treated equally, the weighted mean
assigns a weight to each value based on its
importance or relevance.
18.
1) Calculate theweighted mean of the sample of
numbers shown below:
16, 20, 12, 16, 16, 10, 16, 20, 24, 20
a) Try to solve first using the Mean formula and check
if the solution is the same with the weighted
mean.
b) Solve the given data using the weighted mean
formula.
EXAMPLE 1:
19.
1) Calculate theweighted mean of the sample of numbers
shown below:
16, 20, 12, 16, 16, 10, 16, 20, 24, 20
SOLUTION FOR EXAMPLE 1:
Mean(X) =
𝝨𝑋
𝑛
X =
16 + 20 + 12 +16 +16 + 10+ 16 + 20 +24 +20
𝟏𝟎
X =
170
𝟏𝟎
= 𝟏𝟕
Xw =
𝝨𝑤𝑥
𝝨𝑤 =
1(10) + 1(12) + 4(16) + 3(20) + 1(24)
𝟏+𝟏+𝟒+𝟑+𝟏
Xw =
170
𝟏𝟎
= 𝟏𝟕
Solving using the weighted mean formula
Solving using the mean
formula
20.
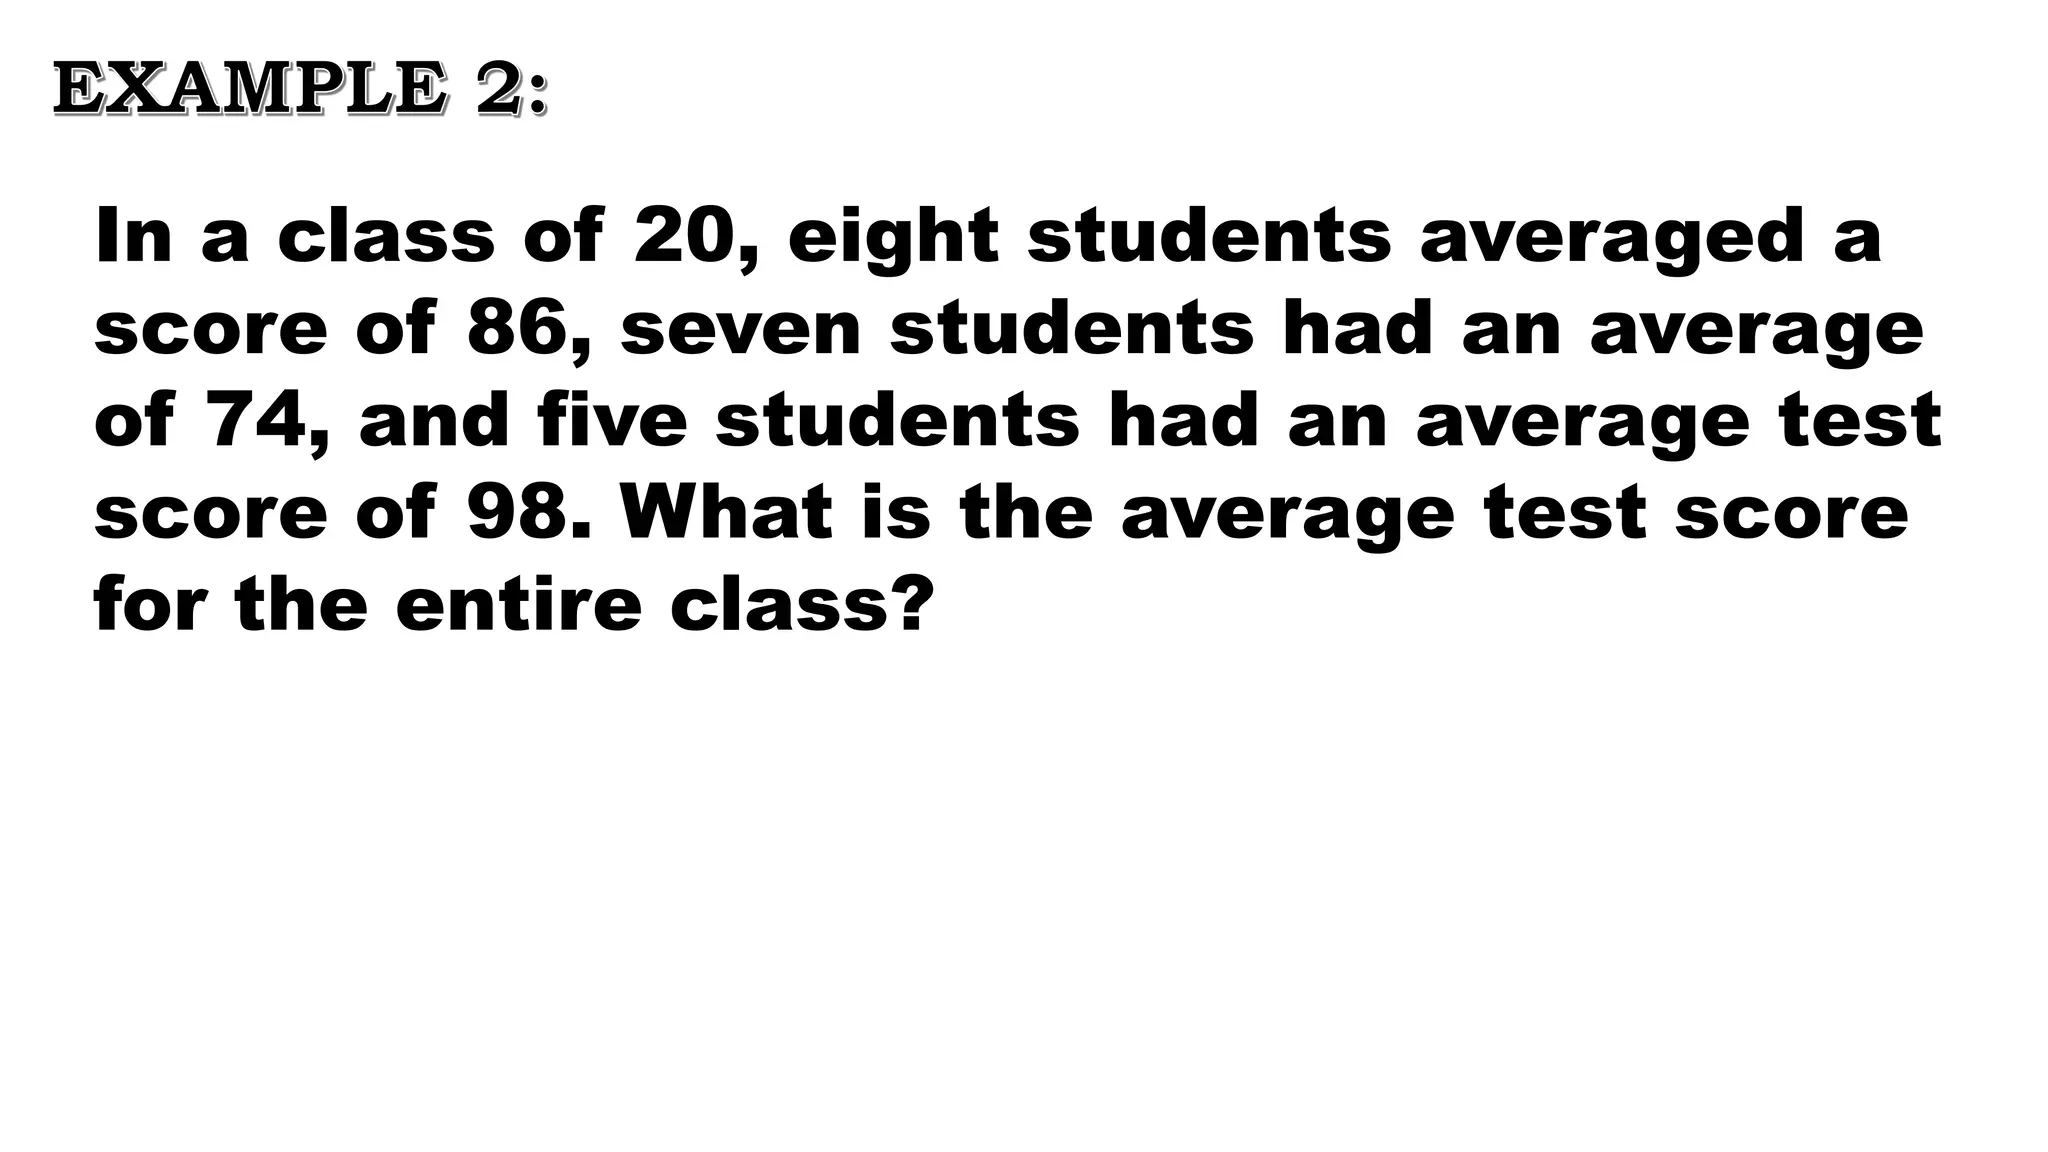
EXAMPLE 2:
In aclass of 20, eight students averaged a
score of 86, seven students had an average
of 74, and five students had an average test
score of 98. What is the average test score
for the entire class?
21.
SOLUTION FOR EXAMPLE#2:
Ina class of 20, eight students averaged a score of 86,
seven students had an average of 74, and five students
had an average test score of 98. What is the average test
score for the entire class?
Xw =
𝝨𝑤𝑥
𝝨𝑤
=
8(86) + 7(74) + 5(98)
𝟖+𝟕+𝟓
=
1696
20
= 𝟖𝟒. 𝟖
Xw
22.
3. In acertain college, 20% of students
have an average weight of 140lbs, 35%
of students have an average weight of
160lbs, 30% of students have an average
weight of 175lbs, and 15% of students
have an average weight of 195lbs. Based
on this data, what is the average weight
of all students in this college?
EXAMPLE 3:
23.
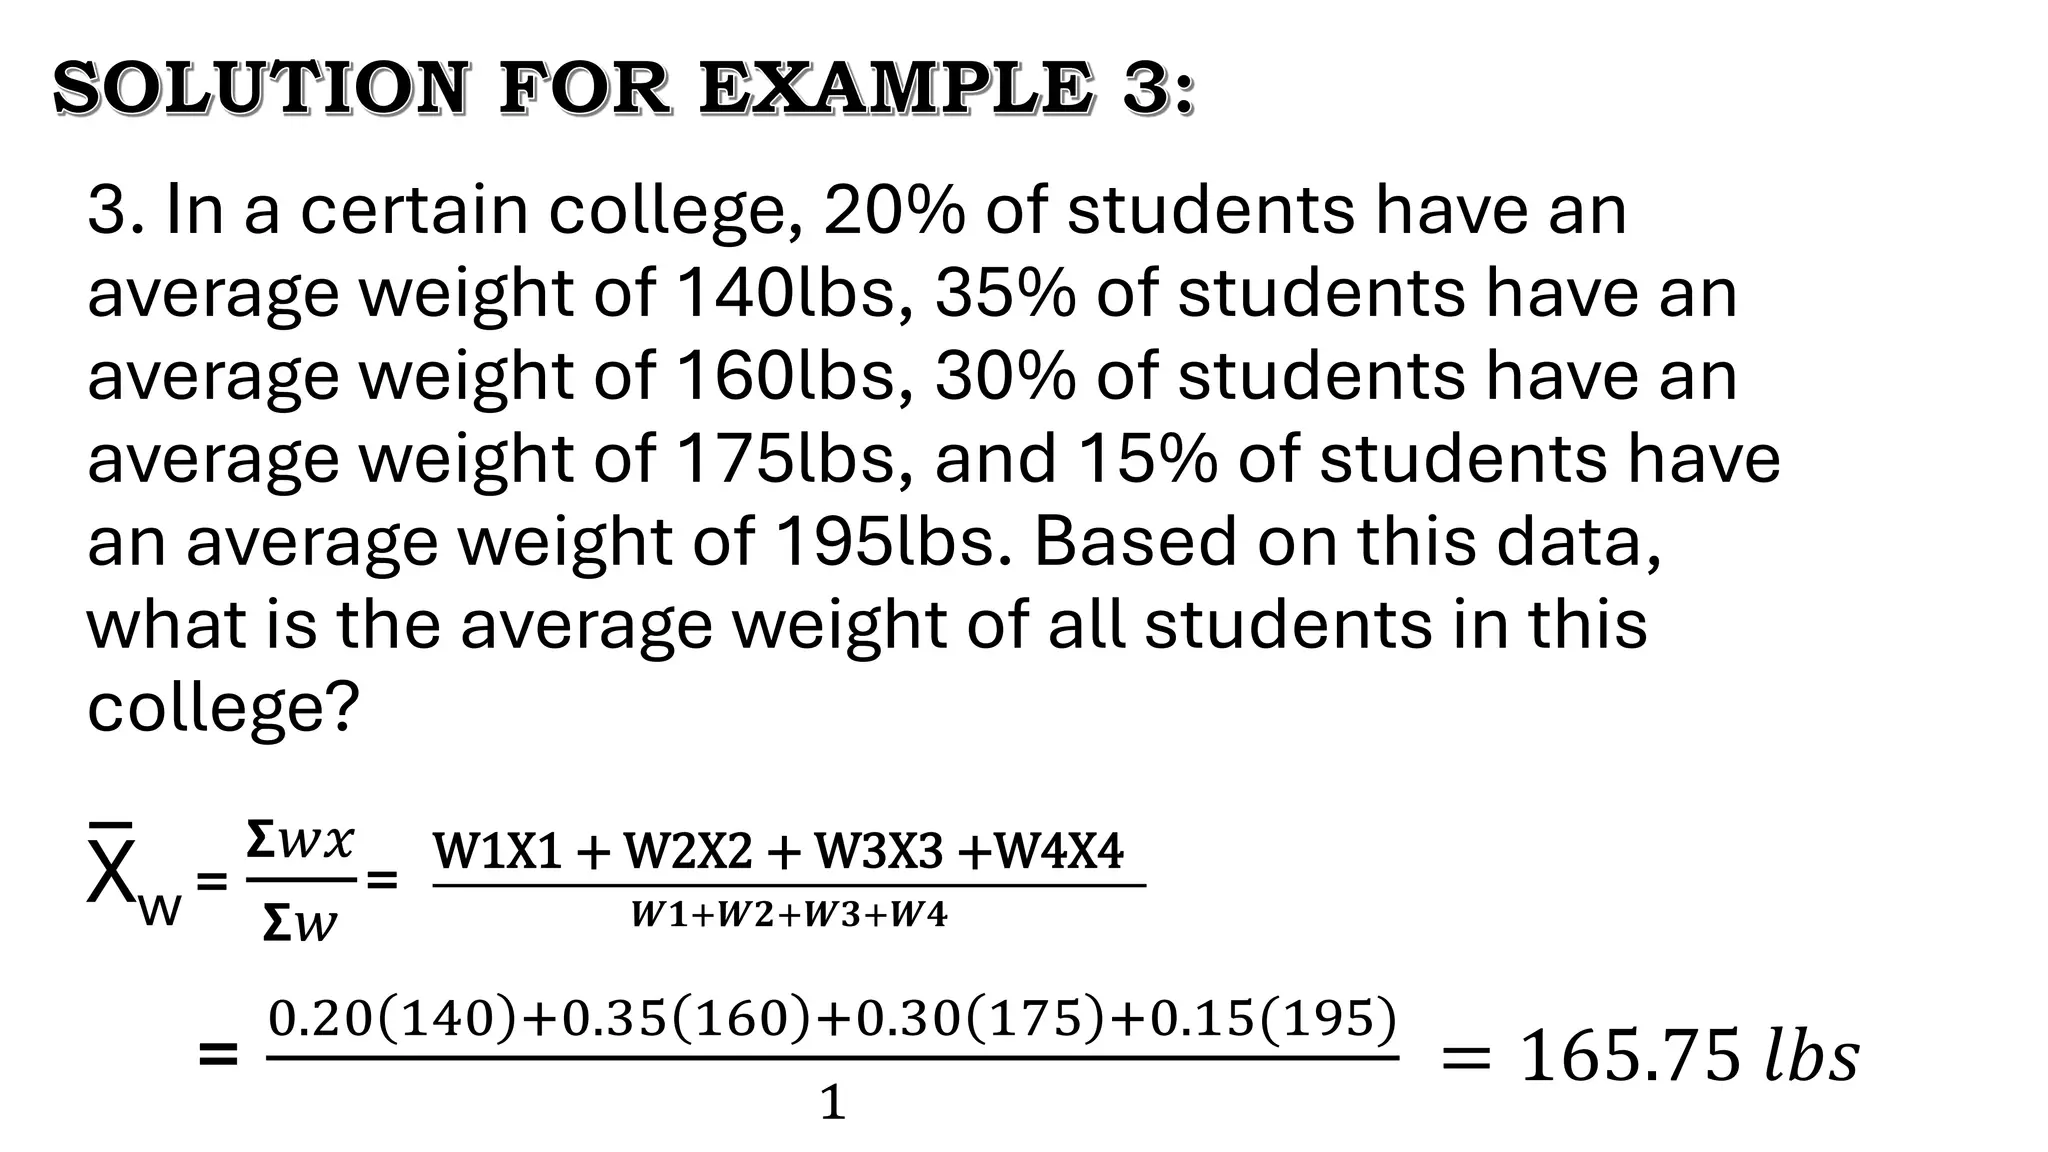
3. In acertain college, 20% of students have an
average weight of 140lbs, 35% of students have an
average weight of 160lbs, 30% of students have an
average weight of 175lbs, and 15% of students have
an average weight of 195lbs. Based on this data,
what is the average weight of all students in this
college?
SOLUTION FOR EXAMPLE 3:
Xw =
𝝨𝑤𝑥
𝝨𝑤
=
W1X1 + W2X2 + W3X3 +W4X4
𝑾𝟏+𝑾𝟐+𝑾𝟑+𝑾𝟒
=
0.20 140 +0.35 160 +0.30 175 +0.15(195)
1
= 165.75 𝑙𝑏𝑠
24.
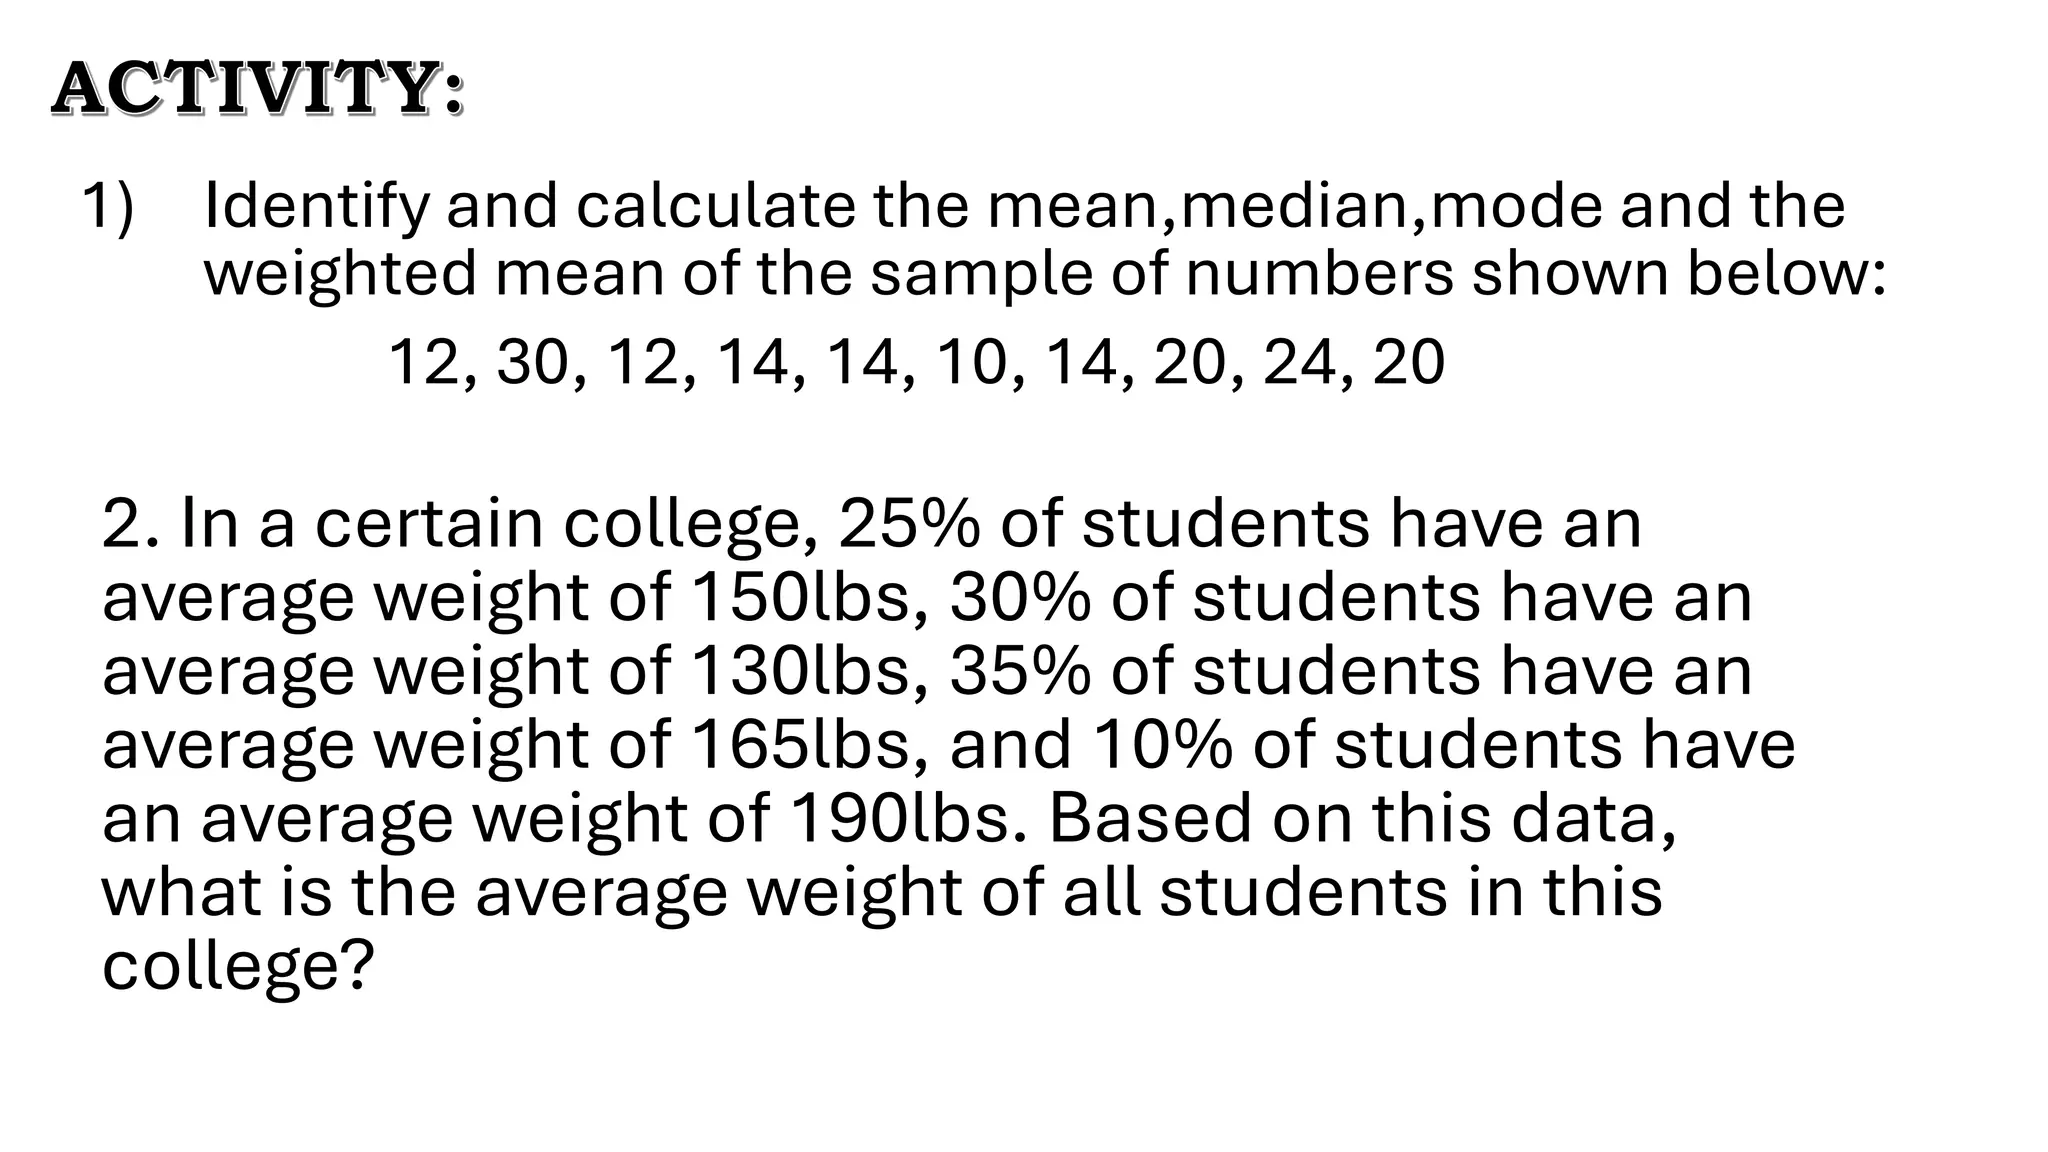
1) Identify andcalculate the mean,median,mode and the
weighted mean of the sample of numbers shown below:
12, 30, 12, 14, 14, 10, 14, 20, 24, 20
ACTIVITY:
2. In a certain college, 25% of students have an
average weight of 150lbs, 30% of students have an
average weight of 130lbs, 35% of students have an
average weight of 165lbs, and 10% of students have
an average weight of 190lbs. Based on this data,
what is the average weight of all students in this
college?
25.
ACTIVITY:
3) Using theinformation shown below, calculate the
weighted mean or final semester grade of Argel and Sheena.
Homework 15%
Quiz 10%
Lab 20%
Test 25%
Final Test 30%
Homework 92
Quiz 74
Lab 83
Test 76
Final Test 88
Homework 100
Quiz 82
Lab 95
Test 70
Final Test 76
Weighted Values Argel’s Record Sheena’s Record
26.
3. Using theinformation shown below, calculate the
final semester grade of Argel and Sheena.
Homework 15%
Quiz 10%
Lab 20%
Test 25%
Final Test 30%
Homework 92
Quiz 74
Lab 83
Test 76
Final Test 88
Homework 100
Quiz 82
Lab 95
Test 70
Final Test 76
Weighted Values Argel’s Record Sheena’s Record
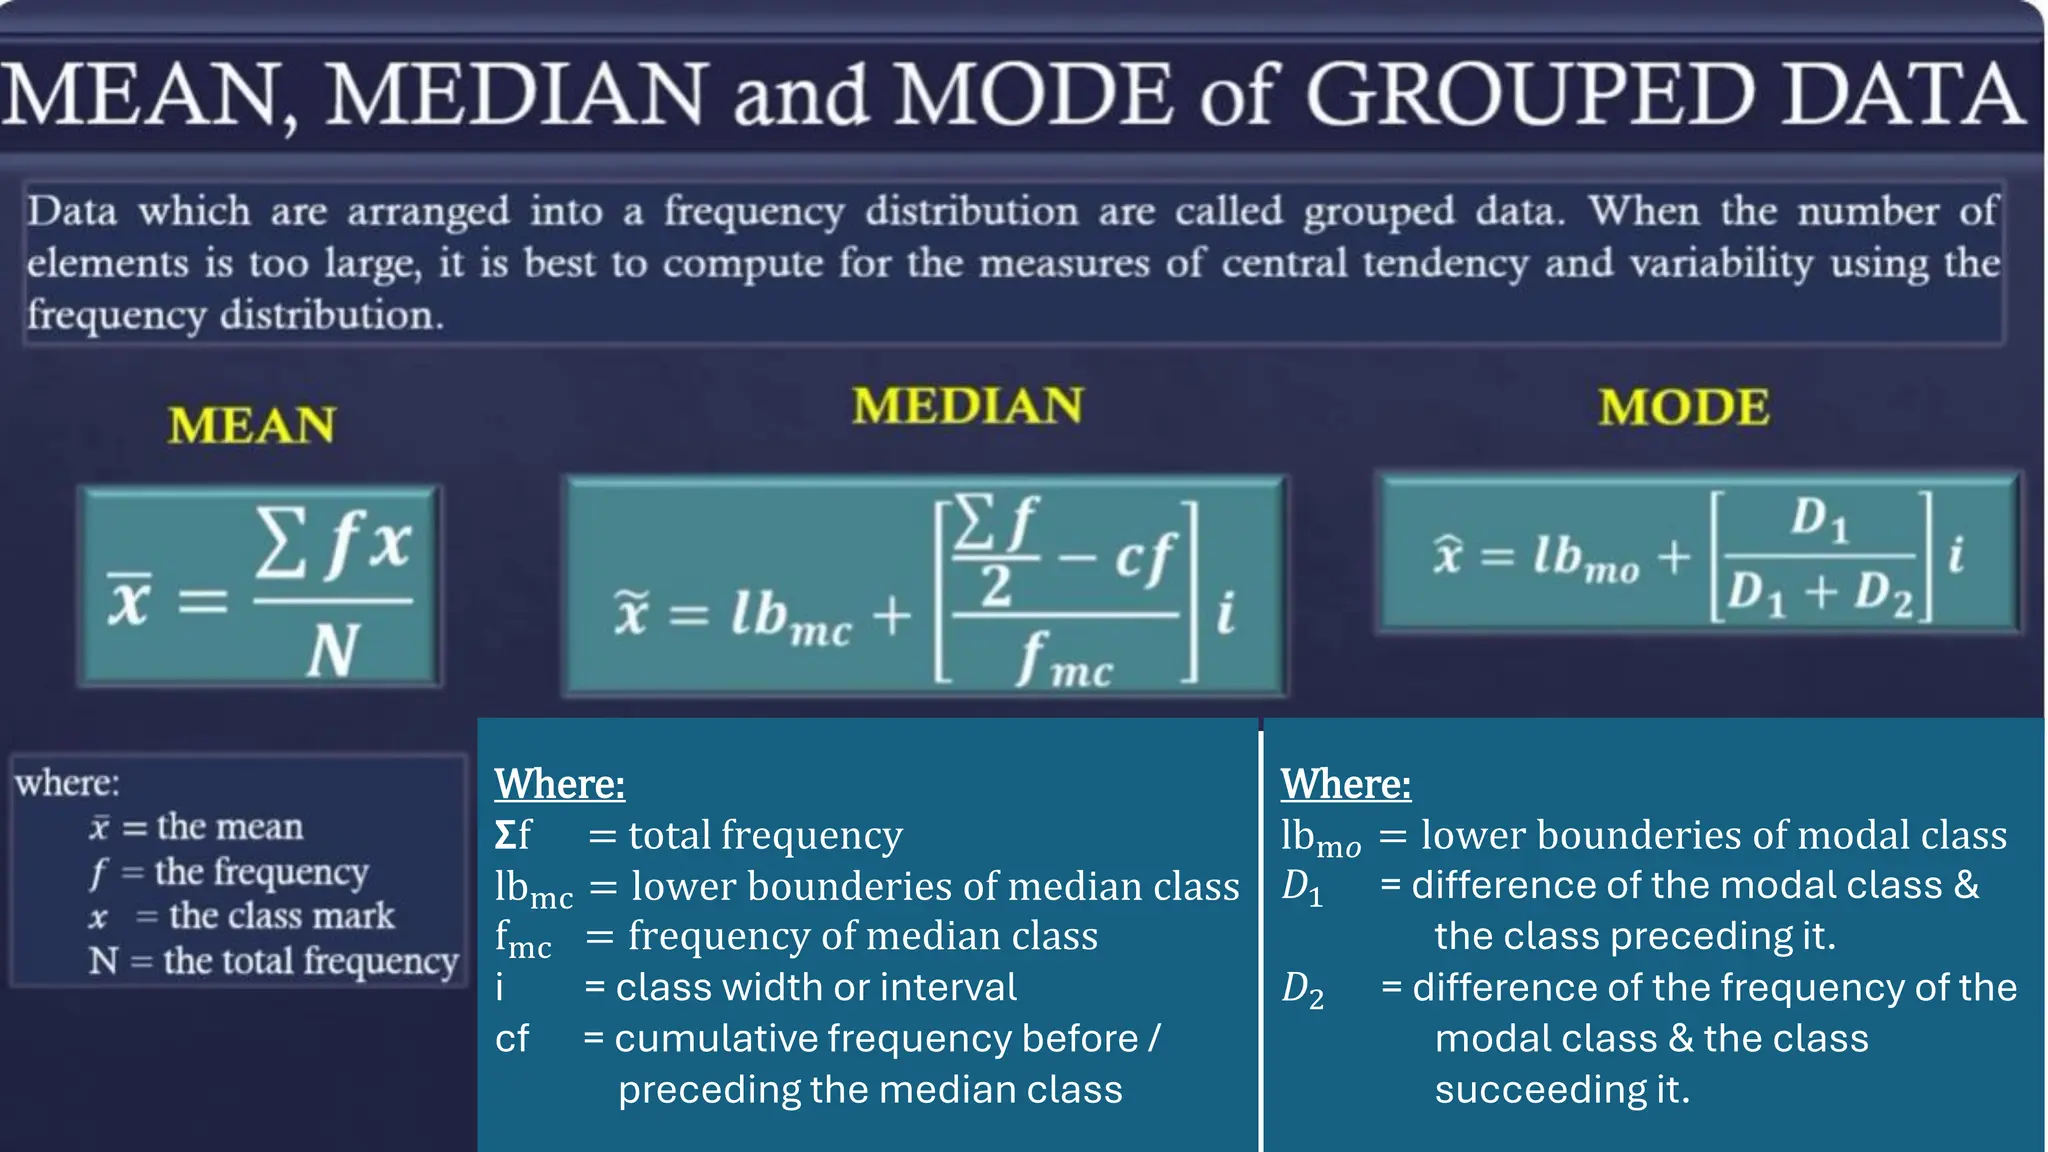
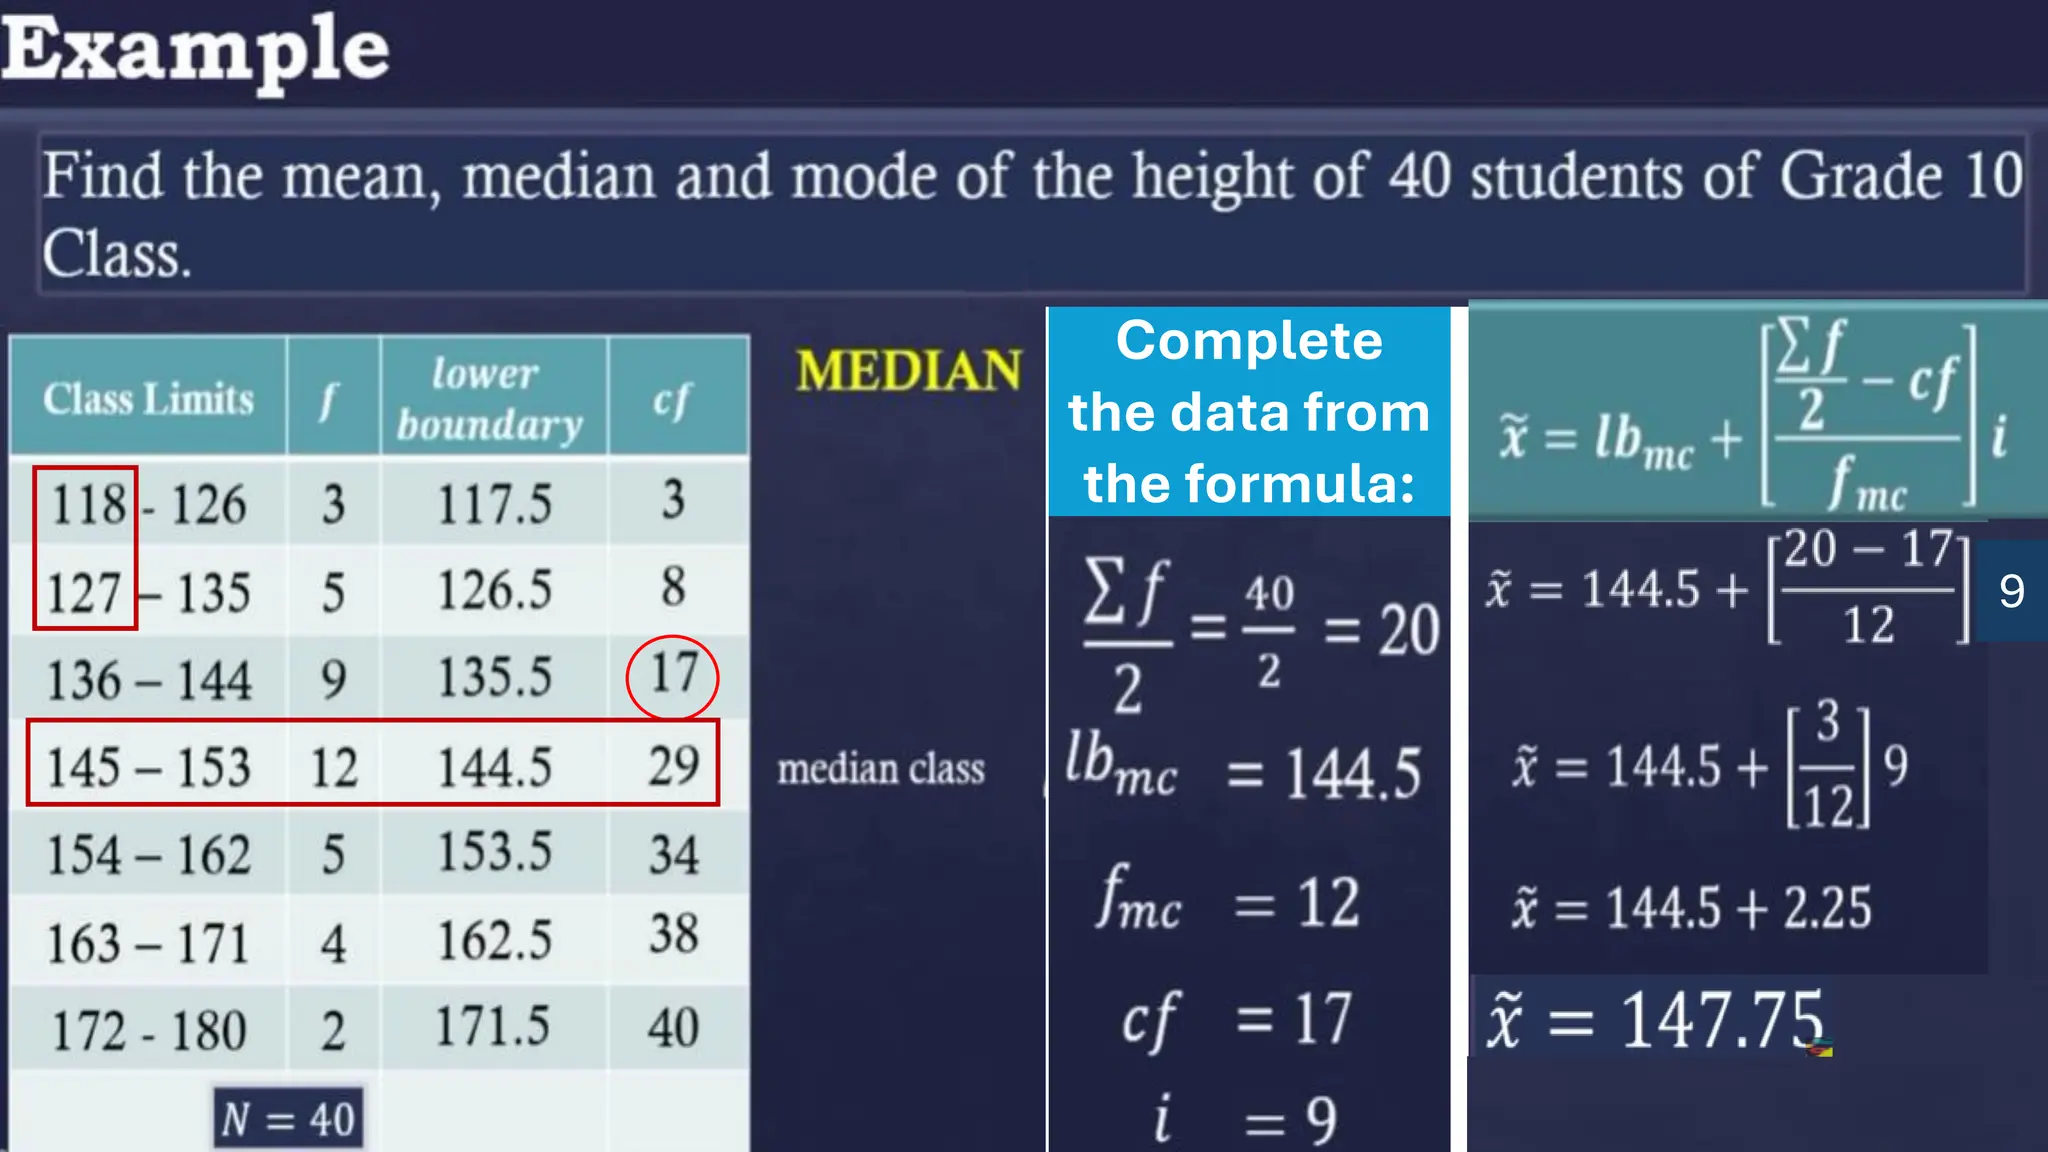
Where:
𝝨f = totalfrequency
lbmc = lower bounderies of median class
fmc = frequency of median class
i = class width or interval
cf = cumulative frequency before /
preceding the median class
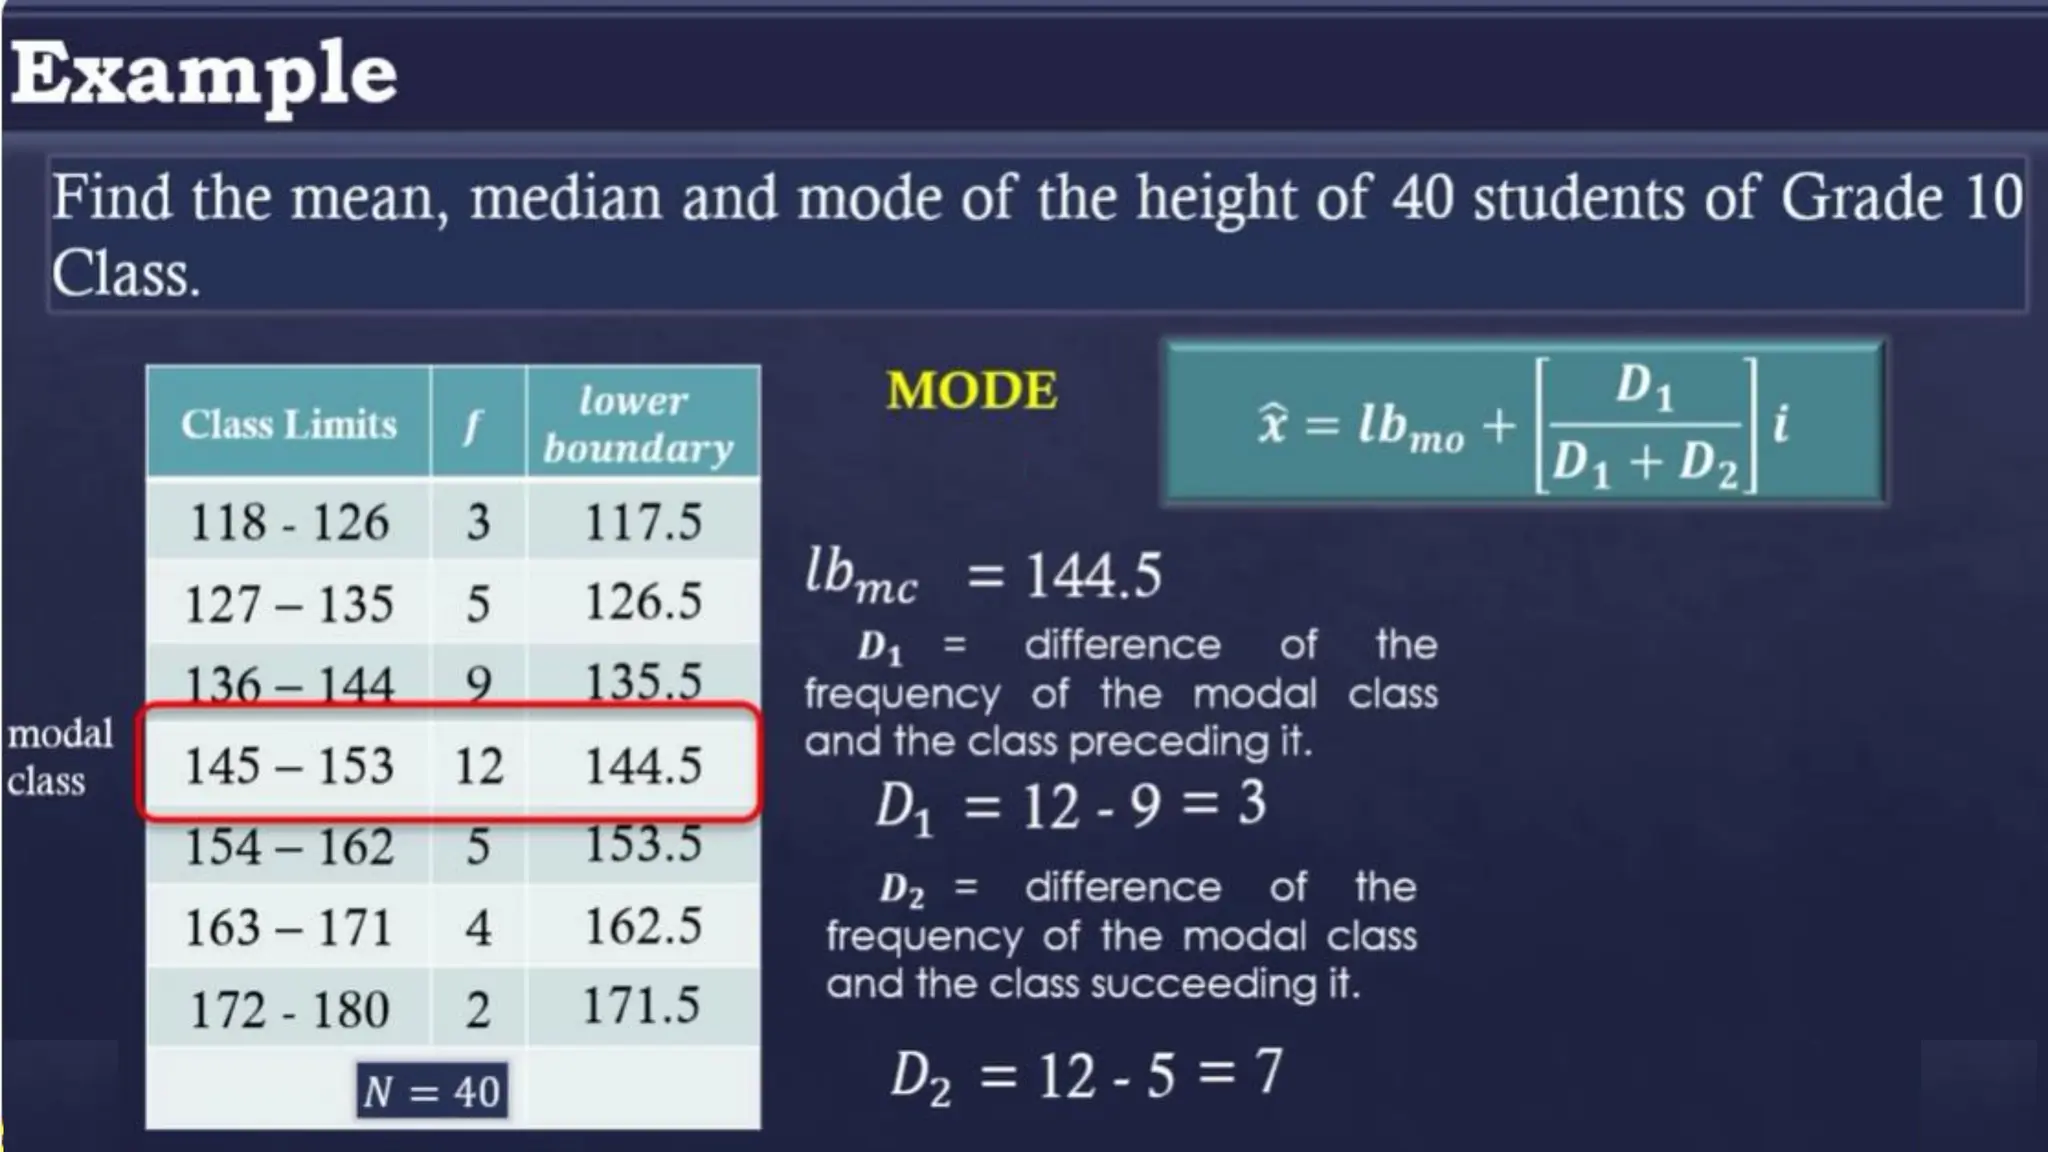
Where:
lbm𝑜 = lower bounderies of modal class
𝐷1 = difference of the modal class &
the class preceding it.
𝐷2 = difference of the frequency of the
modal class & the class
succeeding it.
29.
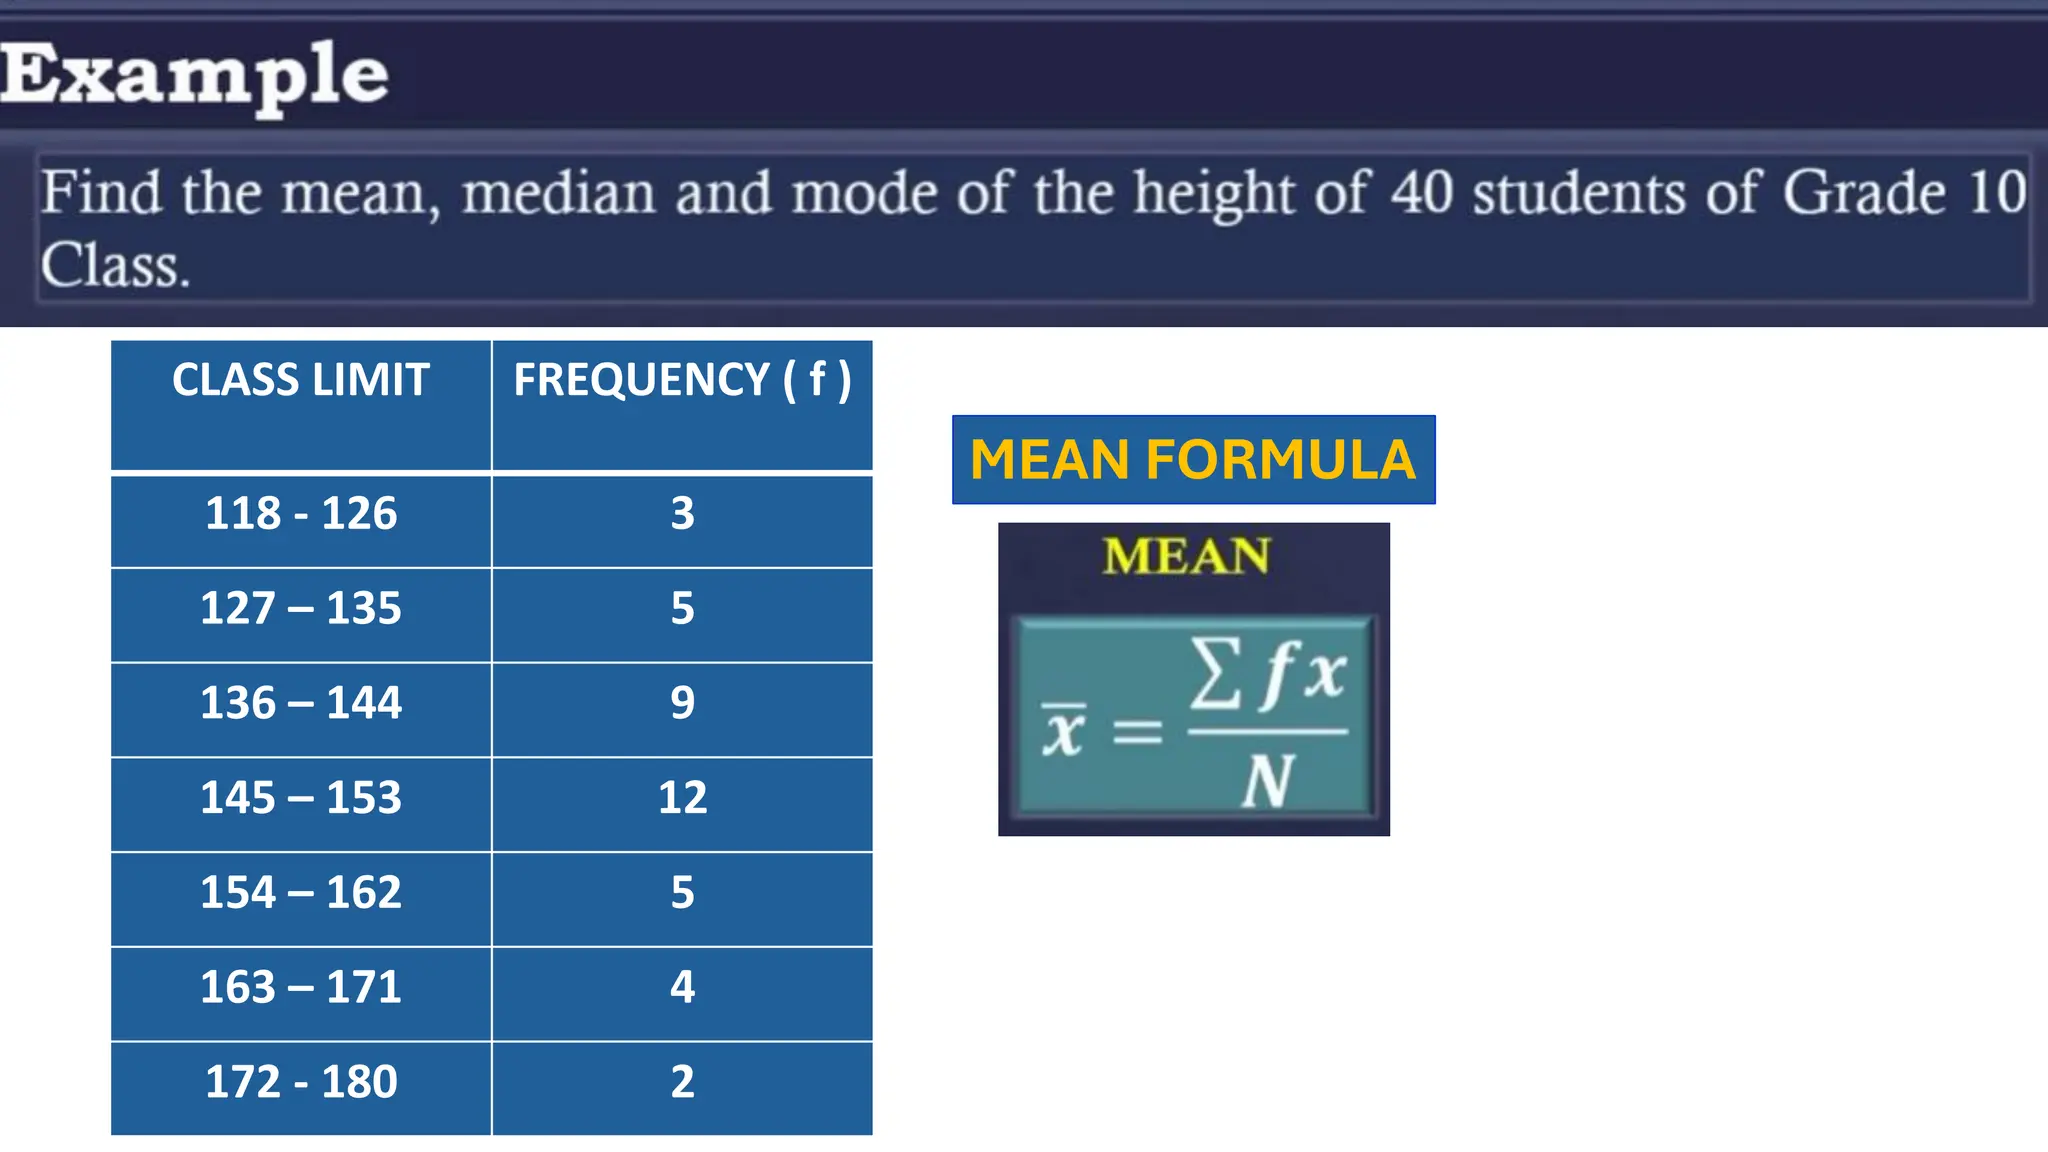
CLASS LIMIT FREQUENCY( f )
118 - 126 3
127 – 135 5
136 – 144 9
145 – 153 12
154 – 162 5
163 – 171 4
172 - 180 2
MEAN FORMULA
30.
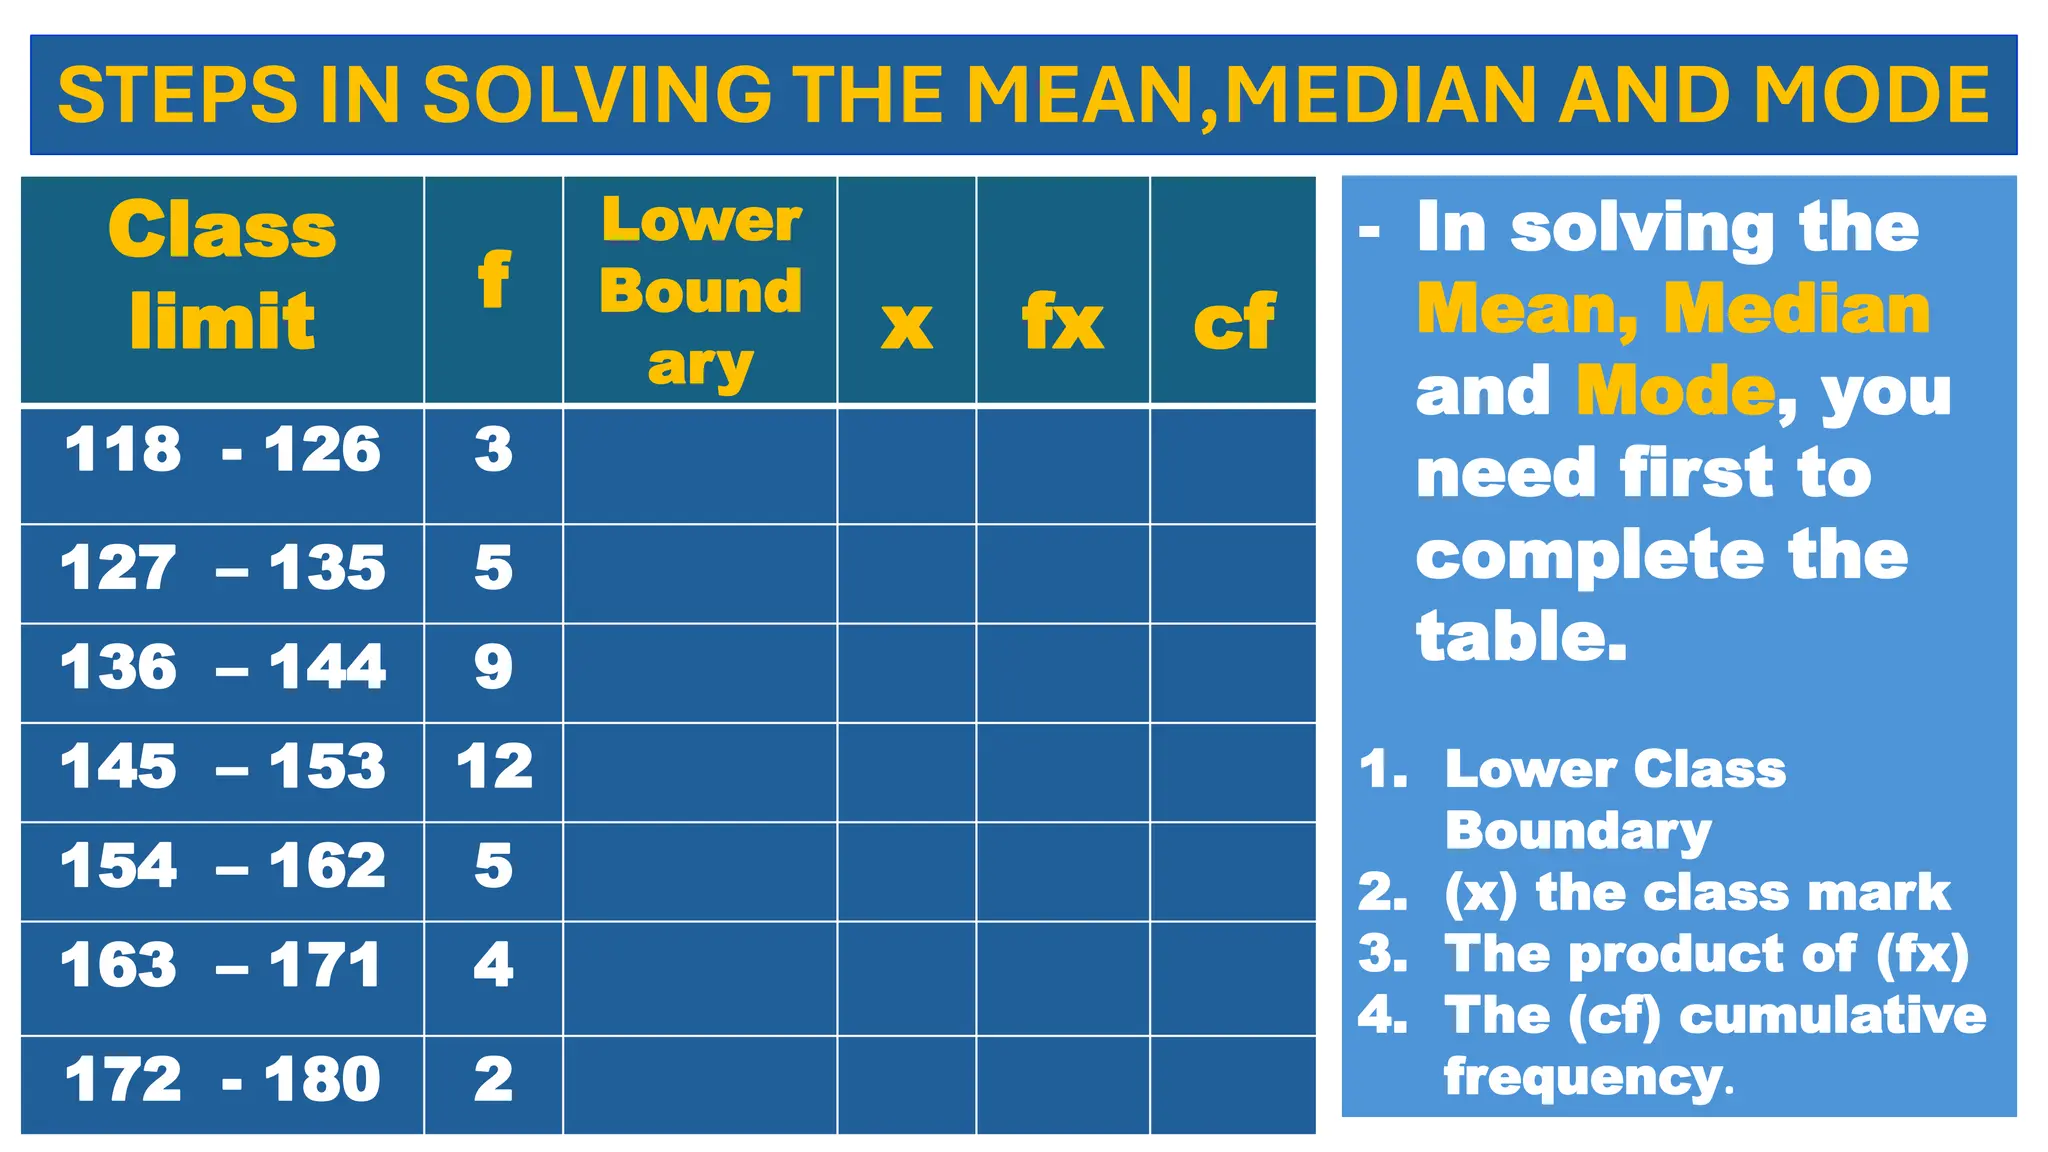
Class
limit
f
Lower
Bound
ary
x fx cf
118- 126 3
127 – 135 5
136 – 144 9
145 – 153 12
154 – 162 5
163 – 171 4
172 - 180 2
STEPS IN SOLVING THE MEAN,MEDIAN AND MODE
- In solving the
Mean, Median
and Mode, you
need first to
complete the
table.
1. Lower Class
Boundary
2. (x) the class mark
3. The product of (fx)
4. The (cf) cumulative
frequency.
31.
Class
limit f
Lower
bounda
ry
x fxcf
118 - 126 3 117.5
127 – 135 5 126.5
136 – 144 9 135.5
145 – 153 12 144.5
154 – 162 5 153.5
163 – 171 4 162.5
172 - 180 2 171.5
STEP 1:
(Solve the lower
boundary)
118 - 0.5 = 117.5
127 - 0.5 = 126.5
136 - 0.5 = 135.5
145 - 0.5 = 144.5
154 - 0.5 = 153.5
163 - 0.5 = 162.5
172 - 0.5 = 171.5
STEP 2 :
(Solve for the total (N)frequency )
3 + 5 + 9 + 12 + 5 + 4 + 2 = 40
N = 40
N = 40
SOLUTION FOR MEAN
32.
CLASS
LIMITS
f
Lower
bounda
ry
x fx cf
118- 126 3 117.5 122 366
127 – 135 5 126.5 131 655
136 – 144 9 135.5 140 1260
145 – 153 12 144.5 149 1788
154 – 162 5 153.5 158 790
163 – 171 4 162.5 167 668
172 - 180 2 171.5 176 352
SOLUTION FOR MEAN
STEP 3:
Solve the class mark ( X ) :
a) For class limit ( 118 – 126)
X =
𝟏𝟏𝟖+𝟏𝟐𝟔
2
= 122
b)Continue to solve the value
of ( x ) until ( 172 – 180 ).
STEP 4 :
Solve the value of ( fx ) :
3 x 122 = 366
5 x 131 = 655
9 x 140 = 1260
12 x 149 = 1788
5 x 158 = 790
4 x 167 = 668
2 x 176 = 352
N = 40
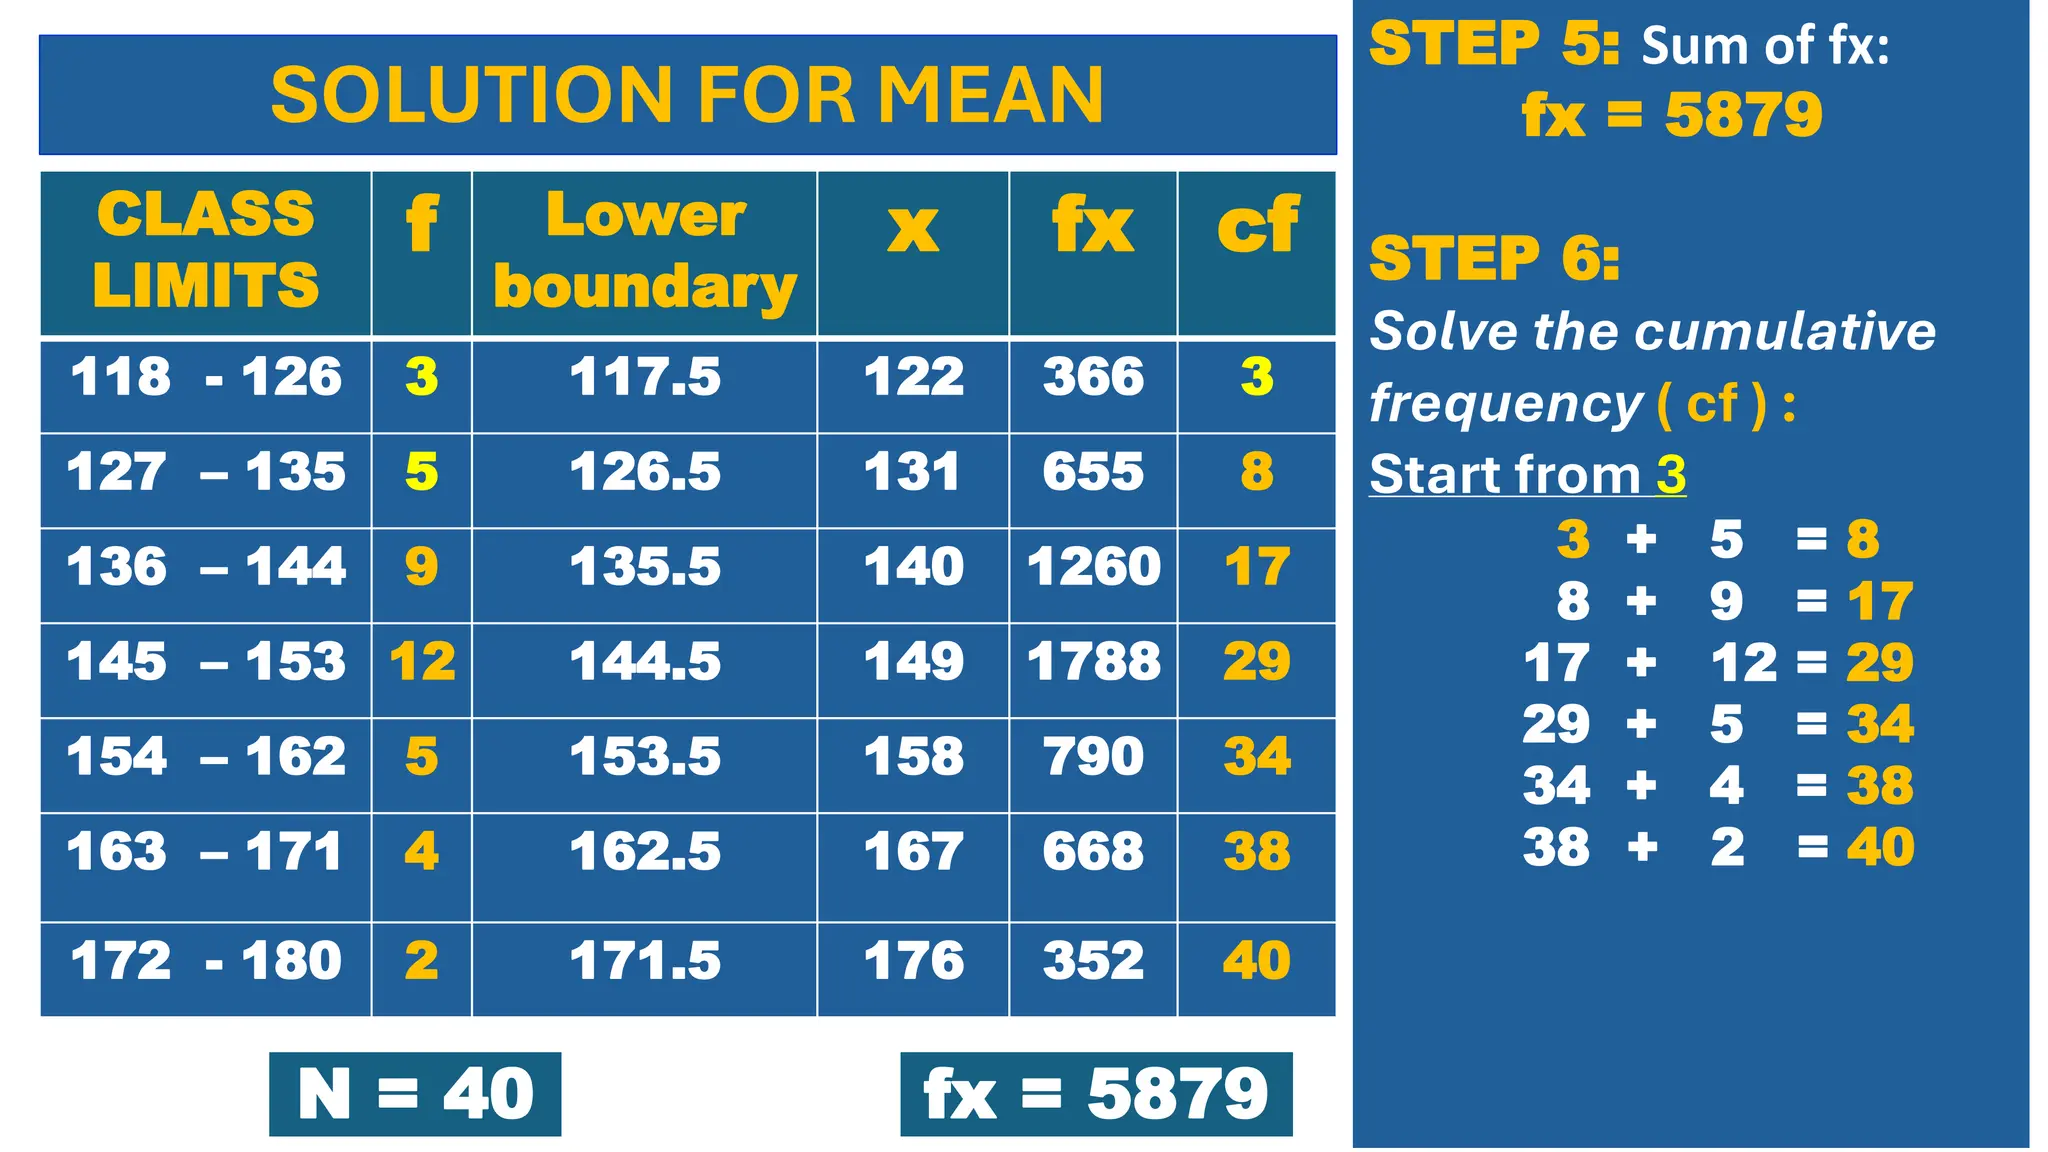
33.
CLASS
LIMITS
f Lower
boundary
x fxcf
118 - 126 3 117.5 122 366 3
127 – 135 5 126.5 131 655 8
136 – 144 9 135.5 140 1260 17
145 – 153 12 144.5 149 1788 29
154 – 162 5 153.5 158 790 34
163 – 171 4 162.5 167 668 38
172 - 180 2 171.5 176 352 40
SOLUTION FOR MEAN
STEP 5: Sum of fx:
fx = 5879
STEP 6:
Solve the cumulative
frequency ( cf ) :
Start from 3
3 + 5 = 8
8 + 9 = 17
17 + 12 = 29
29 + 5 = 34
34 + 4 = 38
38 + 2 = 40
N = 40 fx = 5879
34.
CLASS
LIMITS f
Lower
boundar
y
x fxcf
118 - 126 3 117.5 122 366 3
127 – 135 5 126.5 131 655 8
136 – 144 9 135.5 140 1260 17
145 – 153 12 144.5 149 1788 29
154 – 162 5 153.5 158 790 34
163 – 171 4 162.5 167 668 38
172 - 180 2 171.5 176 352 40
SOLUTION FOR MEAN STEP 7:
Use the Mean formula
and substitute the value.
N = 40 fx = 5879
35.
Recall:
• 𝝨f =total frequency
• lbmc = lower bounderies of median class
• fmc = frequency of median class
• i = class width or interval
• cf = cumulative frequency before /
preceding the median class
𝝨f = 40 cf = 5879
CLASS
LIMITS
f Lower
Boundary
cf
118 - 126 3 117.5 3
127 – 135 5 126.5 8
136 – 144 9 135.5 17
145 – 153 12 144.5 29
154 – 162 5 153.5 34
163 – 171 4 162.5 38
172 - 180 2 171.5 40
36.
𝝨f = 40
CLASS
LIMITS
fLower
Boundary
cf
118 - 126 3 117.5 3
127 – 135 5 126.5 8
136 – 144 9 135.5 17
145 – 153 12 144.5 29
154 – 162 5 153.5 34
163 – 171 4 162.5 38
172 - 180 2 171.5 40
STEPS: Identify first all the
data from the formula.
Cf = 17
= get the cf
before the
median class.
i = 127 - 118
= 9 (interval)
Median Class
1) Identify andcalculate the mean,median,mode and
the weighted mean of the sample of numbers shown
below:
44, 20, 12, 17, 14, 10, 17, 20, 24, 20,15, 25
2) In a certain University, 15% of students have an
average weight of 110lbs, 30% of students have an
average weight of 120lbs, 15% of students have an
average weight of 150lbs, and 40% of students have
an average weight of 125lbs. Based on this data,
what is the average weight of all students in this
college?
QUIZ # 1
42.
3) Using theinformation shown below, calculate the
weighted mean or final semester grade of Gio and Rey.
Homework 15%
Quiz 10%
Lab 20%
Test 25%
Final Test 30%
Homework 98
Quiz 81
Lab 78
Test 83
Final Test 87
Homework 99
Quiz 88
Lab 97
Test 76
Final Test 77
Weighted Values Gio’s Record Rey’s Record
QUIZ # 1
43.
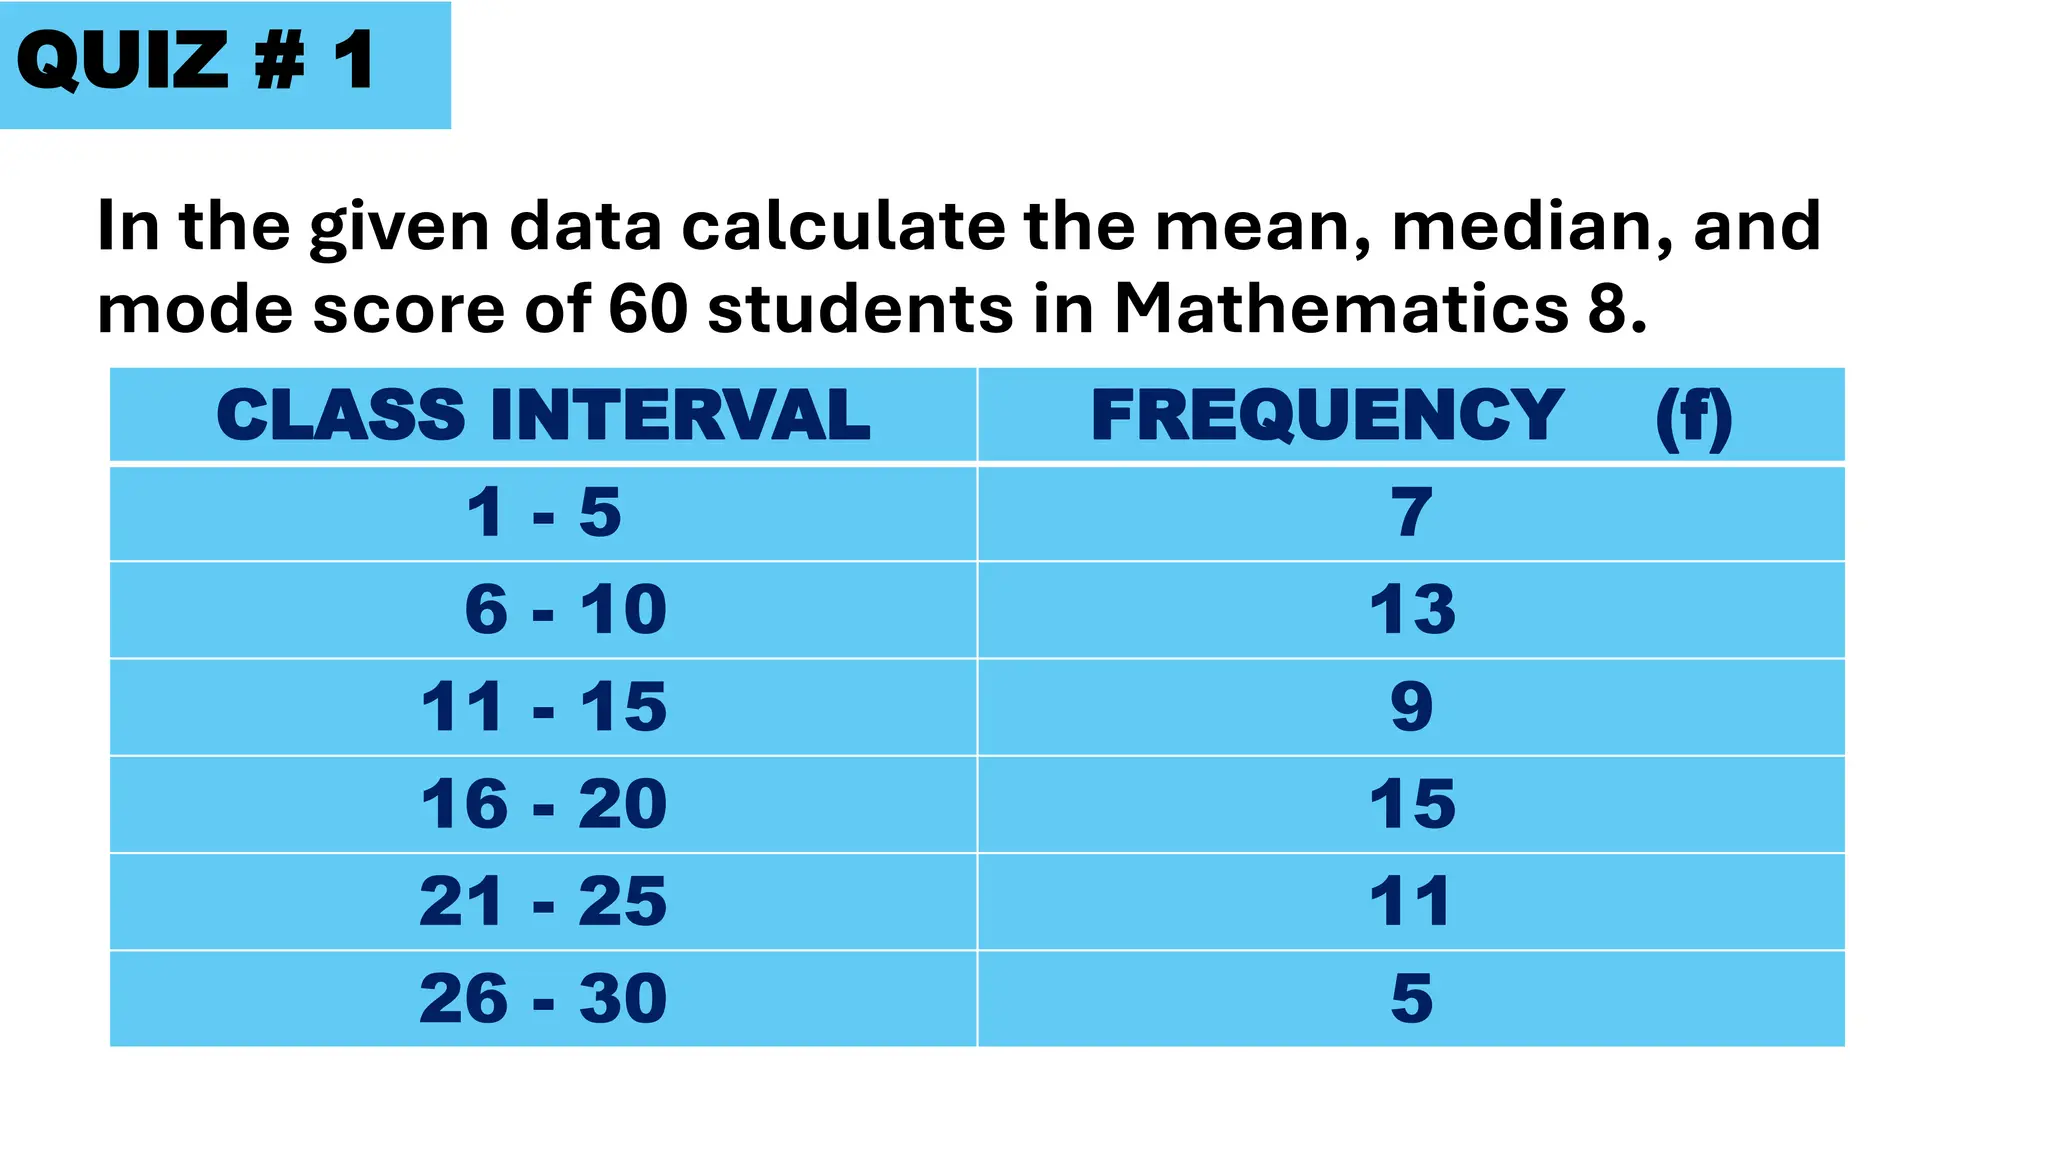
QUIZ # 1
Inthe given data calculate the mean, median, and
mode score of 60 students in Mathematics 8.
CLASS INTERVAL FREQUENCY (f)
1 - 5 7
6 - 10 13
11 - 15 9
16 - 20 15
21 - 25 11
26 - 30 5
44.
QUIZ # 1
Inthe given age of 30 students,
calculate the mean, median, and mode.
AGE INTERVAL FREQUENCY (f)
10 – 12 5
13 – 15 8
16 – 18 5
19 – 21 10
22 - 24 2


![MEASURES-OF-CENTRAL-TENDENCIES-1[1] [Autosaved].pptx](https://cdn.slidesharecdn.com/ss_thumbnails/measures-of-central-tendencies-11autosaved-220906145428-d730d0eb-thumbnail.jpg?width=640&height=640&fit=bounds)


