Download to read offline


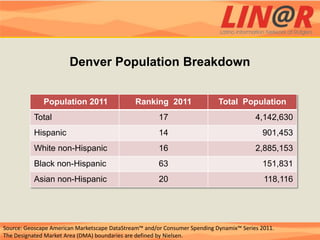
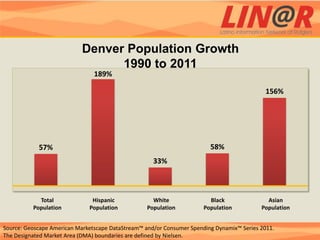
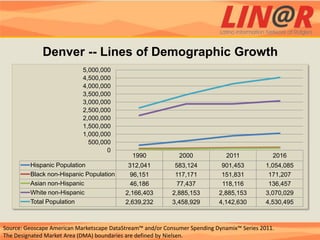
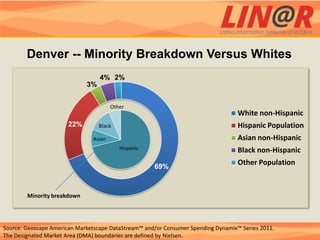

The Denver DMA had a population of over 4 million in 2011, making it the 17th largest market. Denver's population has grown significantly since 1990, with the Hispanic population increasing by 189% between 1990 and 2011. Denver's economy benefits from its central location and transportation infrastructure, which have made it a hub for storage and distribution of goods throughout the western US.


