Download to read offline

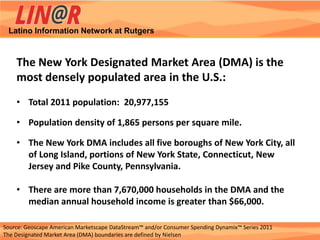
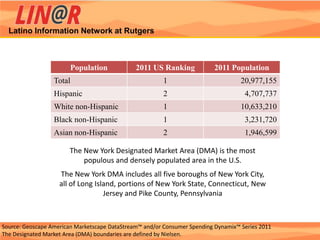
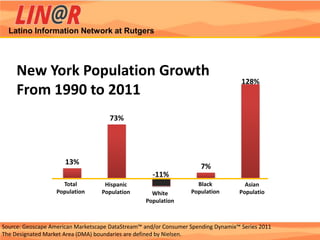
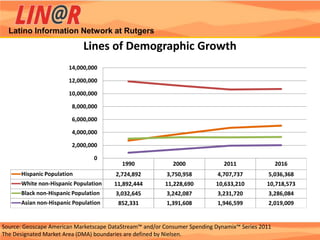
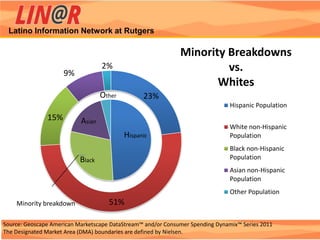
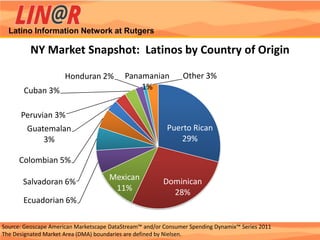

The New York DMA is the most populous area in the U.S., with over 20 million people in 2011. It has seen significant population growth since 1990, especially among Hispanic (73% increase) and Asian (128% increase) populations. The racial composition is complex and becoming more diverse, with whites soon making up less than half of residents and Hispanics growing to over 29% of the population, mainly comprising Puerto Ricans, Dominicans, Mexicans, and other Central and South American nationalities.


