Download to read offline

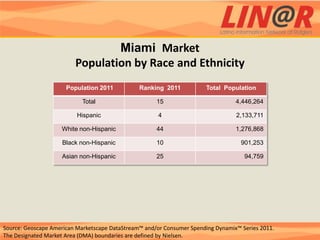
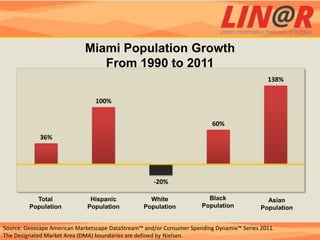
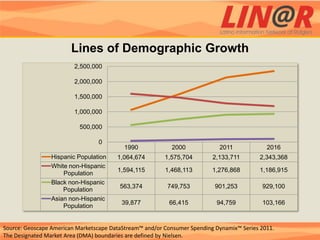
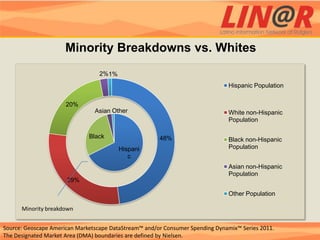
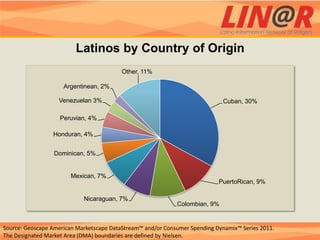

The Miami DMA has a culturally diverse population that is becoming more so each day. It is home to many Latin American and Caribbean migrants as well as migrants from other US states. The Hispanic population, led by Cubans, has grown significantly, though the African American and Asian populations have also increased in recent years. Miami's entertainment and tourism industries shape its identity as a festive metropolitan area.


