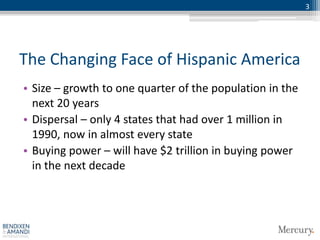
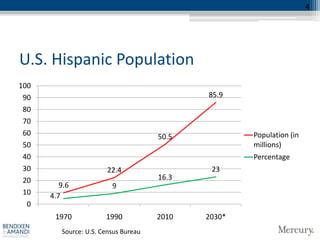
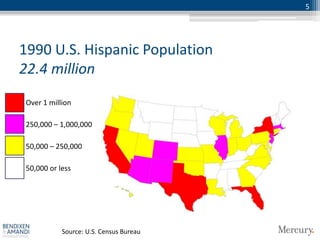
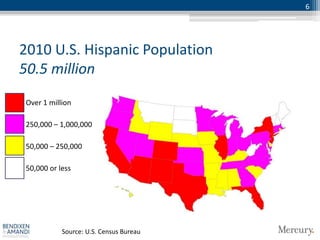
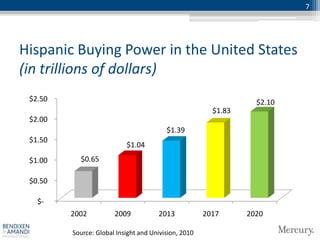
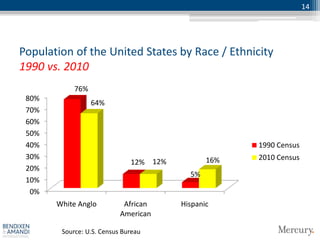
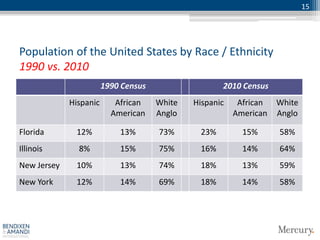
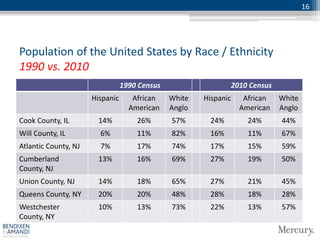
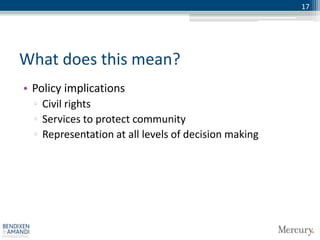
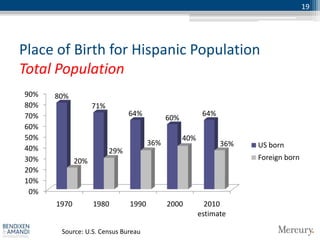
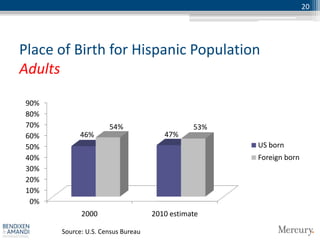
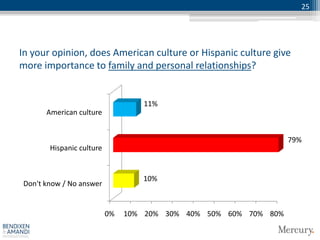
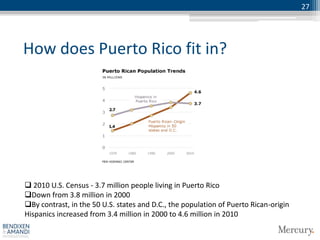
The 2010 Census:
The Changing Face of Hispanic America
November 11, 2011
Caribbean Business and New York City Hispanic Chamber of Commerce
Intercontinental Hotel San Juan, Puerto Rico

Fernando Ferrer, Co-Chairman
2


This is
• A High Stakes Public Strategy Firm
• Understanding and Anticipating Our Clients Needs
• Interpreting Market and Consumer Data and Trends
• Helping Our Clients Understand and Successfully
  Navigate Their Business and Regulatory
  Environments
• Connecting Clients to Business Opportunities
3


The Changing Face of Hispanic America
• Size – growth to one quarter of the population in the
  next 20 years
• Dispersal – only 4 states that had over 1 million in
  1990, now in almost every state
• Buying power – will have $2 trillion in buying power
  in the next decade
4


U.S. Hispanic Population
100
 90                                          85.9
 80
 70
 60                                   50.5           Population (in
 50                                                  millions)
 40                                                  Percentage
 30                     22.4                  23
 20                                   16.3
         9.6             9
 10   4.7
  0
       1970            1990           2010   2030*
         Source: U.S. Census Bureau
5


1990 U.S. Hispanic Population
22.4 million
• Over 1 million

• 250,000 – 1,000,000

• 50,000 – 250,000

• 50,000 or less


             Source: U.S. Census Bureau
6


2010 U.S. Hispanic Population
50.5 million
• Over 1 million

• 250,000 – 1,000,000

• 50,000 – 250,000

• 50,000 or less


             Source: U.S. Census Bureau
7


Hispanic Buying Power in the United States
(in trillions of dollars)
 $2.50                                                            $2.10
                                                        $1.83
 $2.00
                                         $1.39
 $1.50
                           $1.04
 $1.00     $0.65

 $0.50

   $-
         2002          2009           2013            2017      2020

         Source: Global Insight and Univision, 2010
The Emerging Hispanic Middle Class
9


• Movement towards upper-middle class – household
  incomes for Hispanics have shifted up from under
  $50,000 to well over that amount
• Prone to defend policies promoting access to capital
  for home-buying and small business, education and
  employment
• Growth of the new minority – because of the
  explosion as the new minority, overtaking African
  Americans in some counties, they are going to need
  access to government services
• Biculturalism – the new trend moving away from
  Spanish, but holding onto the Hispanic heritage
10


Annual Household Income for Hispanics in the United States
2000 vs. 2010

50%
45%
          36%
40%             33%                   31%
35%                                         29% 28%
                                                            <$25,000
30%                   24%
                                                            $25,000-$50,000
25%
20%                                                         $50,000-$100,000
                                                      12%
15%                                                         $100,000+
                            7%
10%
 5%
 0%
          2000 Census                 2010 Census

         Source: U.S. Census Bureau
11


Annual Household Income for Hispanics in the United States
2000 vs. 2010


 80%            69%
 70%                    60%
 60%
                                                    40%
 50%
                                            31%           2000 Census
 40%
                                                          2010 Census
 30%
 20%
 10%
  0%
          Under $50,000               $50,000 and over

         Source: U.S. Census Bureau
12


Annual Household Income for Hispanics in the United States
$100,000+

 30%
         25%
 25%                 23%
                                21%
 20%                                        18%
                                                       15%
                                                                    14%
 15%                                                                            13%         12%

 10%

  5%

  0%
       Maryland   Virginia   Washington New Jersey Connecticut   California   New York   Washington
                                DC


          Source: U.S. Census Bureau
The New Minority
14


Population of the United States by Race / Ethnicity
1990 vs. 2010
            76%
 80%
                  64%
 70%
 60%
 50%
 40%                                                 1990 Census
 30%                                           16%   2010 Census
                              12% 12%
 20%
                                          5%
 10%
  0%
       White Anglo          African     Hispanic
                           American

        Source: U.S. Census Bureau
15


Population of the United States by Race / Ethnicity
1990 vs. 2010
                        1990 Census                  2010 Census
             Hispanic      African    White   Hispanic    African   White
                          American    Anglo              American   Anglo

Florida       12%           13%       73%      23%         15%      58%
Illinois       8%           15%       75%      16%         14%      64%
New Jersey    10%           13%       74%      18%         13%      59%
New York      12%           14%       69%      18%         14%      58%
16


Population of the United States by Race / Ethnicity
1990 vs. 2010
                                 1990 Census                  2010 Census
                      Hispanic      African    White   Hispanic    African   White
                                   American    Anglo              American   Anglo
Cook County, IL        14%           26%       57%      24%         24%      44%
Will County, IL         6%           11%       82%      16%         11%      67%
Atlantic County, NJ     7%           17%       74%      17%         15%      59%
Cumberland             13%           16%       69%      27%         19%      50%
County, NJ
Union County, NJ       14%           18%       65%      27%         21%      45%
Queens County, NY      20%           20%       48%      28%         18%      28%
Westchester            10%           13%       73%      22%         13%      57%
County, NY
17


What does this mean?
• Policy implications
  ▫ Civil rights
  ▫ Services to protect community
  ▫ Representation at all levels of decision making
The Bicultural Trend
19


Place of Birth for Hispanic Population
Total Population
90%   80%
80%                71%
70%                            64%                       64%
                                            60%
60%
50%                                               40%
                                      36%                      36%   US born
40%                      29%
30%          20%                                                     Foreign born
20%
10%
 0%
      1970         1980        1990         2000          2010
                                                        estimate

       Source: U.S. Census Bureau
20


Place of Birth for Hispanic Population
Adults
 90%
 80%
 70%                  54%                      53%
 60%         46%                       47%
 50%                                                 US born
 40%                                                 Foreign born
 30%
 20%
 10%
  0%
             2000                   2010 estimate

       Source: U.S. Census Bureau
21


Ability to Speak English for Hispanic
Population
30%                   25%                  24%
25%         21%                                   21%

20%
                                                         2000
15%
                                                         2010 estimate
10%

 5%

 0%
      Speak only English            Speak only Spanish

       Source: U.S. Census Bureau
22


•Every year for the next twenty
 years, 500,000 Hispanics will turn
 18 in the United States.


    Source: U.S. Census Bureau
23


Do you relate more to Hispanic culture, do you relate more to
American culture, or do you consider yourself bicultural?


                                  19%


                                                   Hispanic culture
                                             15%   American culture
                                                   Bicultural
 66%
24


In your opinion, does American culture or Hispanic culture give
more importance to money and financial gain?


                                                           72%
      American culture


                                    14%
       Hispanic culture


                                    14%
Don't know / No answer


                          0%   10% 20% 30% 40% 50% 60% 70% 80%
25


In your opinion, does American culture or Hispanic culture give
more importance to family and personal relationships?


                                  11%
      American culture


                                                                 79%
       Hispanic culture


                                  10%
Don't know / No answer


                          0%   10% 20% 30% 40% 50% 60% 70% 80%
26


What does this mean?
• Need to market and advertise in a culturally
  competent way
  ▫ Bicultural targeting
  ▫ Challenge for businesses and advertising agencies
  ▫ Challenge for businesses and governments procuring
    goods and services
27


How does Puerto Rico fit in?


 2010 U.S. Census - 3.7 million people living in Puerto Rico
Down from 3.8 million in 2000
By contrast, in the 50 U.S. states and D.C., the population of Puerto Rican-origin
Hispanics increased from 3.4 million in 2000 to 4.6 million in 2010

New York Mercury Bendixen 2011

  • 1.
    The 2010 Census: TheChanging Face of Hispanic America November 11, 2011 Caribbean Business and New York City Hispanic Chamber of Commerce Intercontinental Hotel San Juan, Puerto Rico Fernando Ferrer, Co-Chairman
  • 2.
    2 This is • AHigh Stakes Public Strategy Firm • Understanding and Anticipating Our Clients Needs • Interpreting Market and Consumer Data and Trends • Helping Our Clients Understand and Successfully Navigate Their Business and Regulatory Environments • Connecting Clients to Business Opportunities
  • 3.
    3 The Changing Faceof Hispanic America • Size – growth to one quarter of the population in the next 20 years • Dispersal – only 4 states that had over 1 million in 1990, now in almost every state • Buying power – will have $2 trillion in buying power in the next decade
  • 4.
    4 U.S. Hispanic Population 100 90 85.9 80 70 60 50.5 Population (in 50 millions) 40 Percentage 30 22.4 23 20 16.3 9.6 9 10 4.7 0 1970 1990 2010 2030* Source: U.S. Census Bureau
  • 5.
    5 1990 U.S. HispanicPopulation 22.4 million • Over 1 million • 250,000 – 1,000,000 • 50,000 – 250,000 • 50,000 or less Source: U.S. Census Bureau
  • 6.
    6 2010 U.S. HispanicPopulation 50.5 million • Over 1 million • 250,000 – 1,000,000 • 50,000 – 250,000 • 50,000 or less Source: U.S. Census Bureau
  • 7.
    7 Hispanic Buying Powerin the United States (in trillions of dollars) $2.50 $2.10 $1.83 $2.00 $1.39 $1.50 $1.04 $1.00 $0.65 $0.50 $- 2002 2009 2013 2017 2020 Source: Global Insight and Univision, 2010
  • 8.
  • 9.
    9 • Movement towardsupper-middle class – household incomes for Hispanics have shifted up from under $50,000 to well over that amount • Prone to defend policies promoting access to capital for home-buying and small business, education and employment • Growth of the new minority – because of the explosion as the new minority, overtaking African Americans in some counties, they are going to need access to government services • Biculturalism – the new trend moving away from Spanish, but holding onto the Hispanic heritage
  • 10.
    10 Annual Household Incomefor Hispanics in the United States 2000 vs. 2010 50% 45% 36% 40% 33% 31% 35% 29% 28% <$25,000 30% 24% $25,000-$50,000 25% 20% $50,000-$100,000 12% 15% $100,000+ 7% 10% 5% 0% 2000 Census 2010 Census Source: U.S. Census Bureau
  • 11.
    11 Annual Household Incomefor Hispanics in the United States 2000 vs. 2010 80% 69% 70% 60% 60% 40% 50% 31% 2000 Census 40% 2010 Census 30% 20% 10% 0% Under $50,000 $50,000 and over Source: U.S. Census Bureau
  • 12.
    12 Annual Household Incomefor Hispanics in the United States $100,000+ 30% 25% 25% 23% 21% 20% 18% 15% 14% 15% 13% 12% 10% 5% 0% Maryland Virginia Washington New Jersey Connecticut California New York Washington DC Source: U.S. Census Bureau
  • 13.
  • 14.
    14 Population of theUnited States by Race / Ethnicity 1990 vs. 2010 76% 80% 64% 70% 60% 50% 40% 1990 Census 30% 16% 2010 Census 12% 12% 20% 5% 10% 0% White Anglo African Hispanic American Source: U.S. Census Bureau
  • 15.
    15 Population of theUnited States by Race / Ethnicity 1990 vs. 2010 1990 Census 2010 Census Hispanic African White Hispanic African White American Anglo American Anglo Florida 12% 13% 73% 23% 15% 58% Illinois 8% 15% 75% 16% 14% 64% New Jersey 10% 13% 74% 18% 13% 59% New York 12% 14% 69% 18% 14% 58%
  • 16.
    16 Population of theUnited States by Race / Ethnicity 1990 vs. 2010 1990 Census 2010 Census Hispanic African White Hispanic African White American Anglo American Anglo Cook County, IL 14% 26% 57% 24% 24% 44% Will County, IL 6% 11% 82% 16% 11% 67% Atlantic County, NJ 7% 17% 74% 17% 15% 59% Cumberland 13% 16% 69% 27% 19% 50% County, NJ Union County, NJ 14% 18% 65% 27% 21% 45% Queens County, NY 20% 20% 48% 28% 18% 28% Westchester 10% 13% 73% 22% 13% 57% County, NY
  • 17.
    17 What does thismean? • Policy implications ▫ Civil rights ▫ Services to protect community ▫ Representation at all levels of decision making
  • 18.
  • 19.
    19 Place of Birthfor Hispanic Population Total Population 90% 80% 80% 71% 70% 64% 64% 60% 60% 50% 40% 36% 36% US born 40% 29% 30% 20% Foreign born 20% 10% 0% 1970 1980 1990 2000 2010 estimate Source: U.S. Census Bureau
  • 20.
    20 Place of Birthfor Hispanic Population Adults 90% 80% 70% 54% 53% 60% 46% 47% 50% US born 40% Foreign born 30% 20% 10% 0% 2000 2010 estimate Source: U.S. Census Bureau
  • 21.
    21 Ability to SpeakEnglish for Hispanic Population 30% 25% 24% 25% 21% 21% 20% 2000 15% 2010 estimate 10% 5% 0% Speak only English Speak only Spanish Source: U.S. Census Bureau
  • 22.
    22 •Every year forthe next twenty years, 500,000 Hispanics will turn 18 in the United States. Source: U.S. Census Bureau
  • 23.
    23 Do you relatemore to Hispanic culture, do you relate more to American culture, or do you consider yourself bicultural? 19% Hispanic culture 15% American culture Bicultural 66%
  • 24.
    24 In your opinion,does American culture or Hispanic culture give more importance to money and financial gain? 72% American culture 14% Hispanic culture 14% Don't know / No answer 0% 10% 20% 30% 40% 50% 60% 70% 80%
  • 25.
    25 In your opinion,does American culture or Hispanic culture give more importance to family and personal relationships? 11% American culture 79% Hispanic culture 10% Don't know / No answer 0% 10% 20% 30% 40% 50% 60% 70% 80%
  • 26.
    26 What does thismean? • Need to market and advertise in a culturally competent way ▫ Bicultural targeting ▫ Challenge for businesses and advertising agencies ▫ Challenge for businesses and governments procuring goods and services
  • 27.
    27 How does PuertoRico fit in?  2010 U.S. Census - 3.7 million people living in Puerto Rico Down from 3.8 million in 2000 By contrast, in the 50 U.S. states and D.C., the population of Puerto Rican-origin Hispanics increased from 3.4 million in 2000 to 4.6 million in 2010