Download to read offline


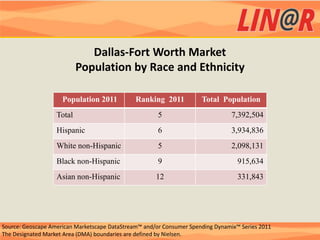
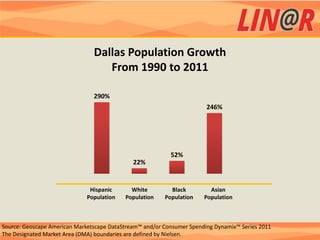
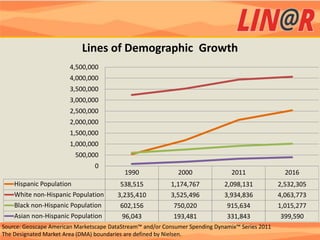
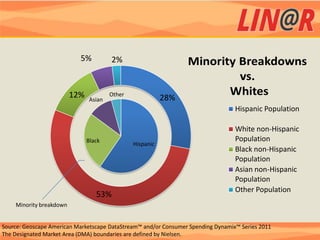

The Dallas-Fort Worth metropolitan area is the largest in Texas and fourth largest in the US. It has a population of over 7 million people and is one of the most ethnically diverse markets, with Hispanics as the largest ethnic group at over 53% of the population. The economy is driven by industries like banking, technology, energy and transportation. Between 1990-2016, the Hispanic population is projected to nearly quintuple, while the white population will grow by 26%, showing increasing diversity.


