Downloaded 886 times

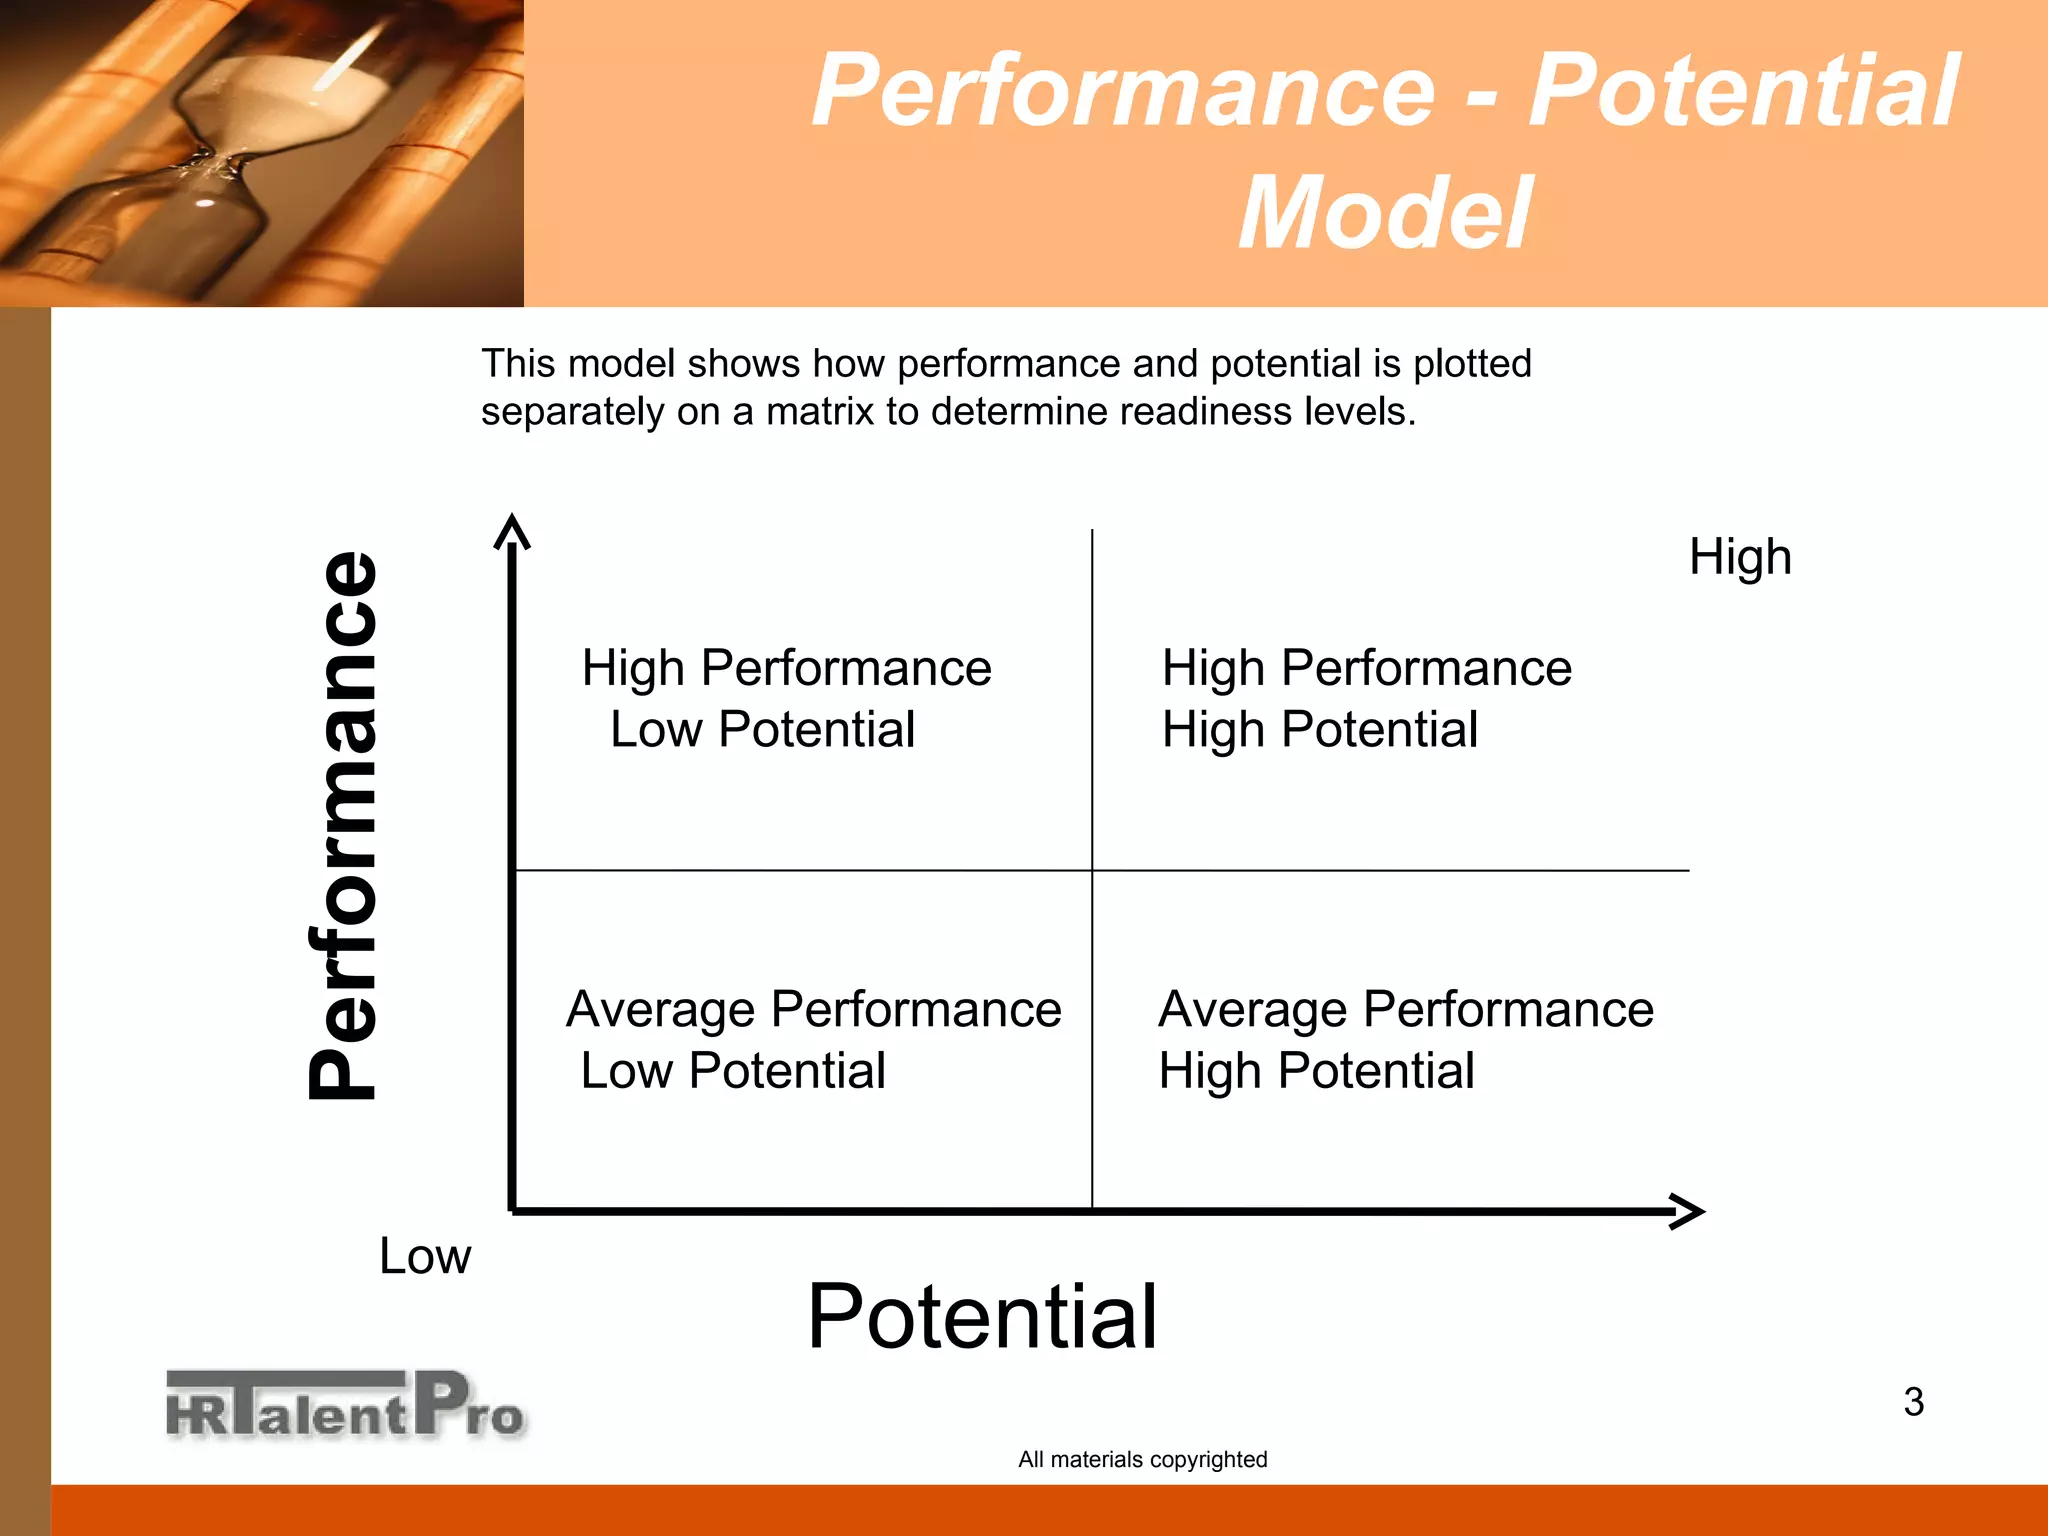
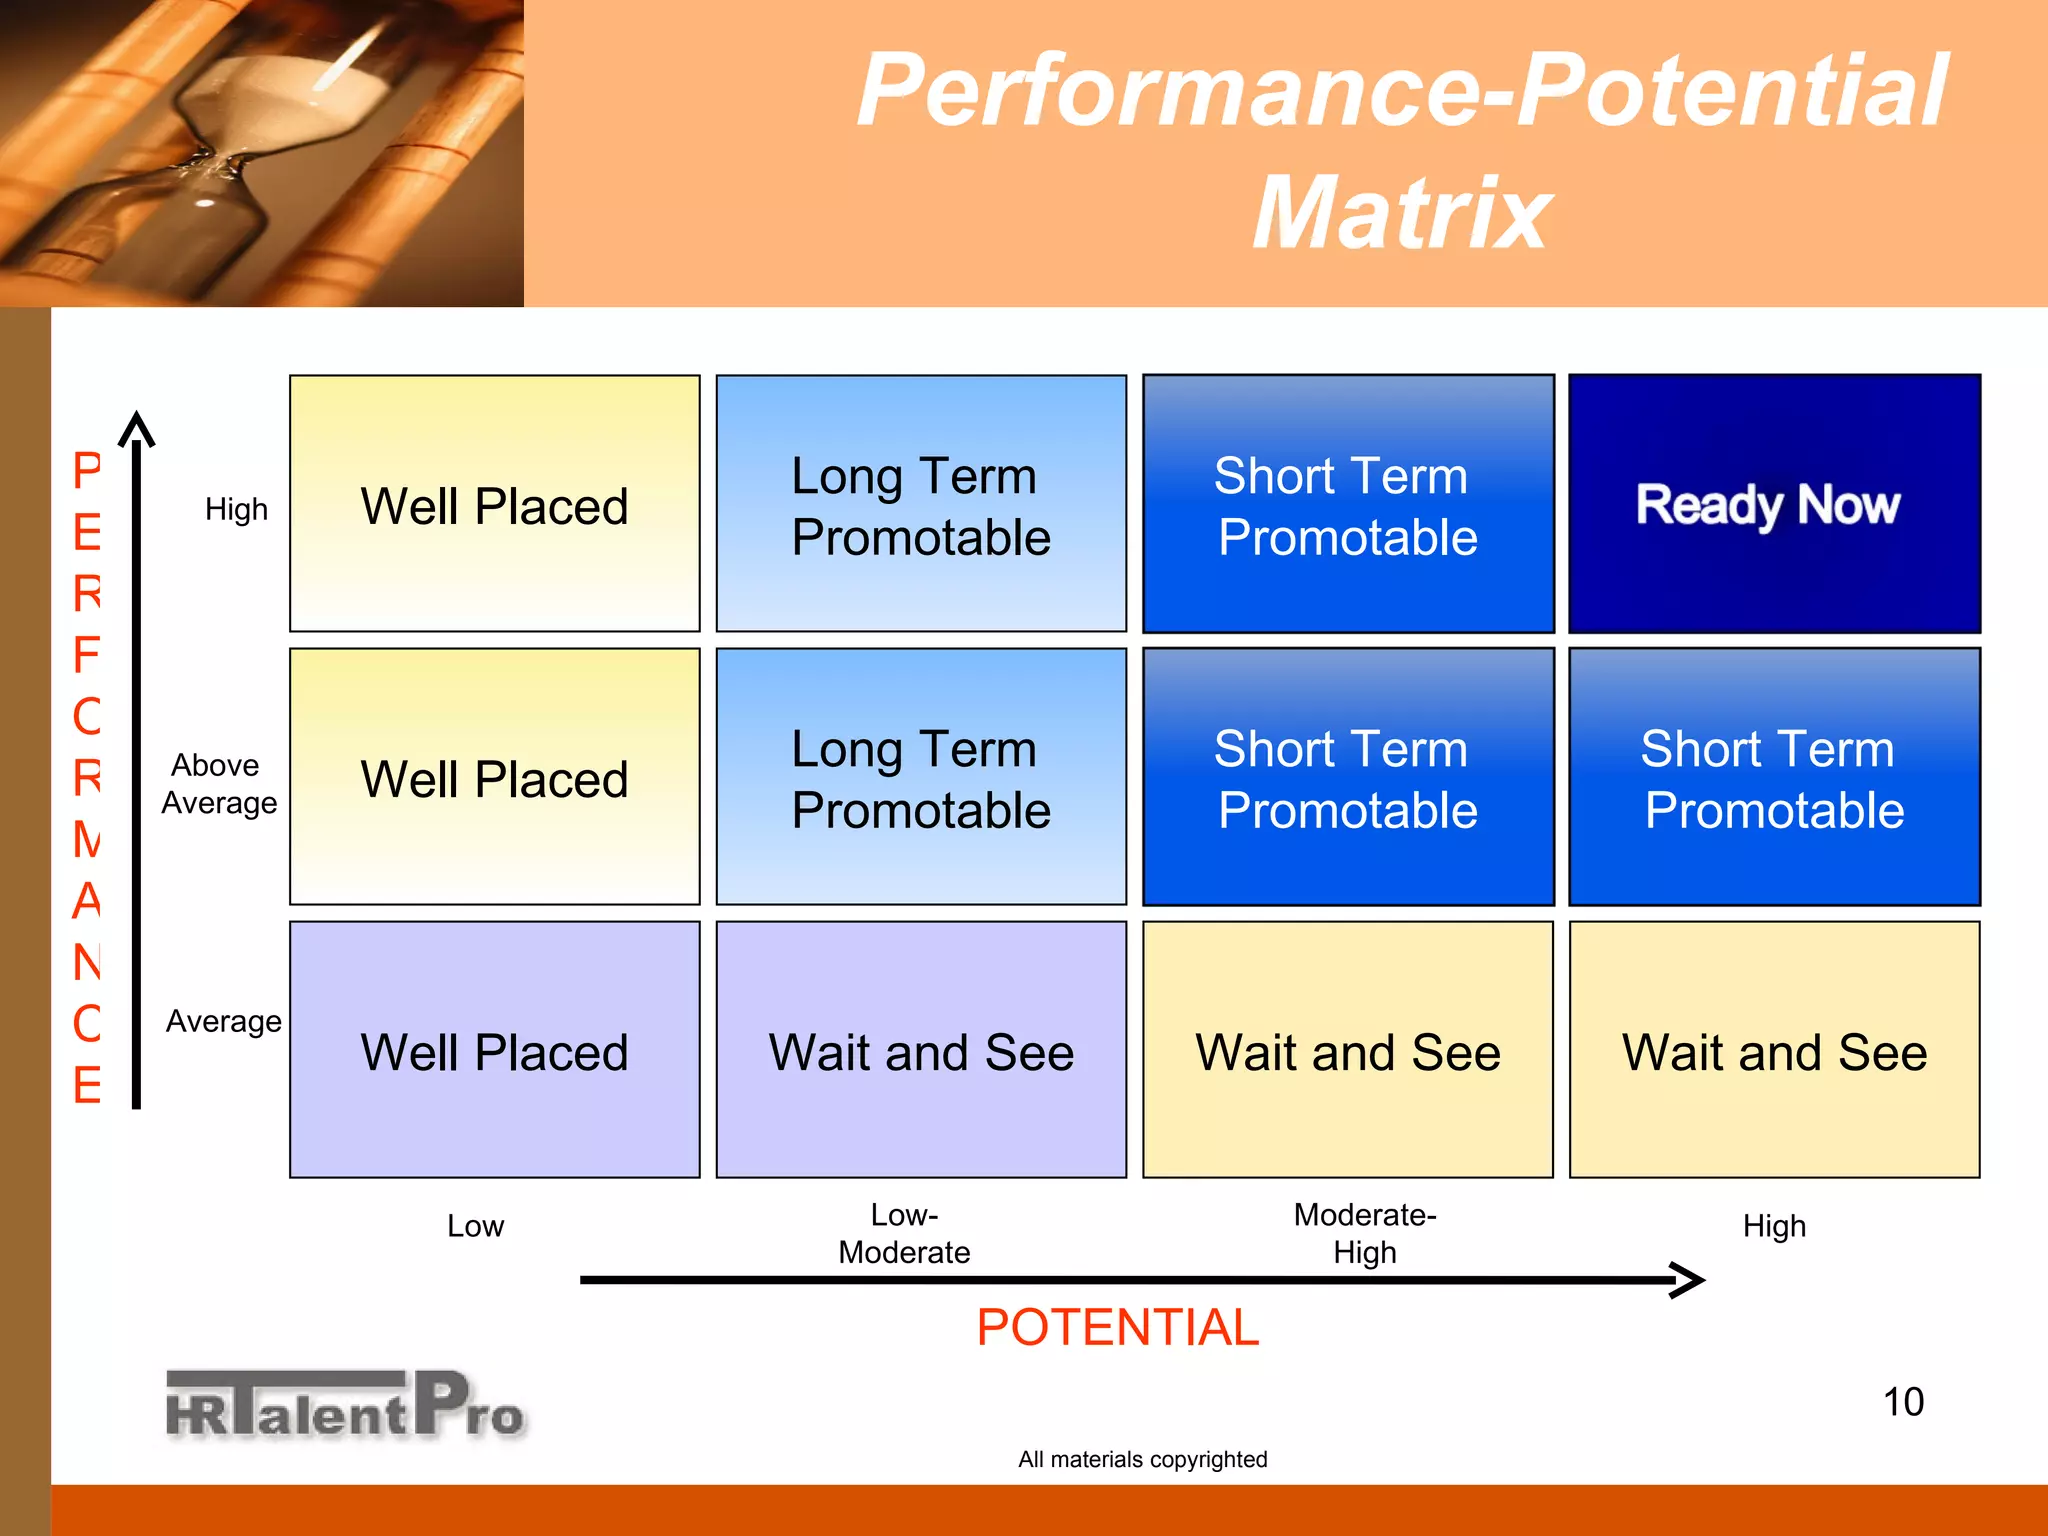
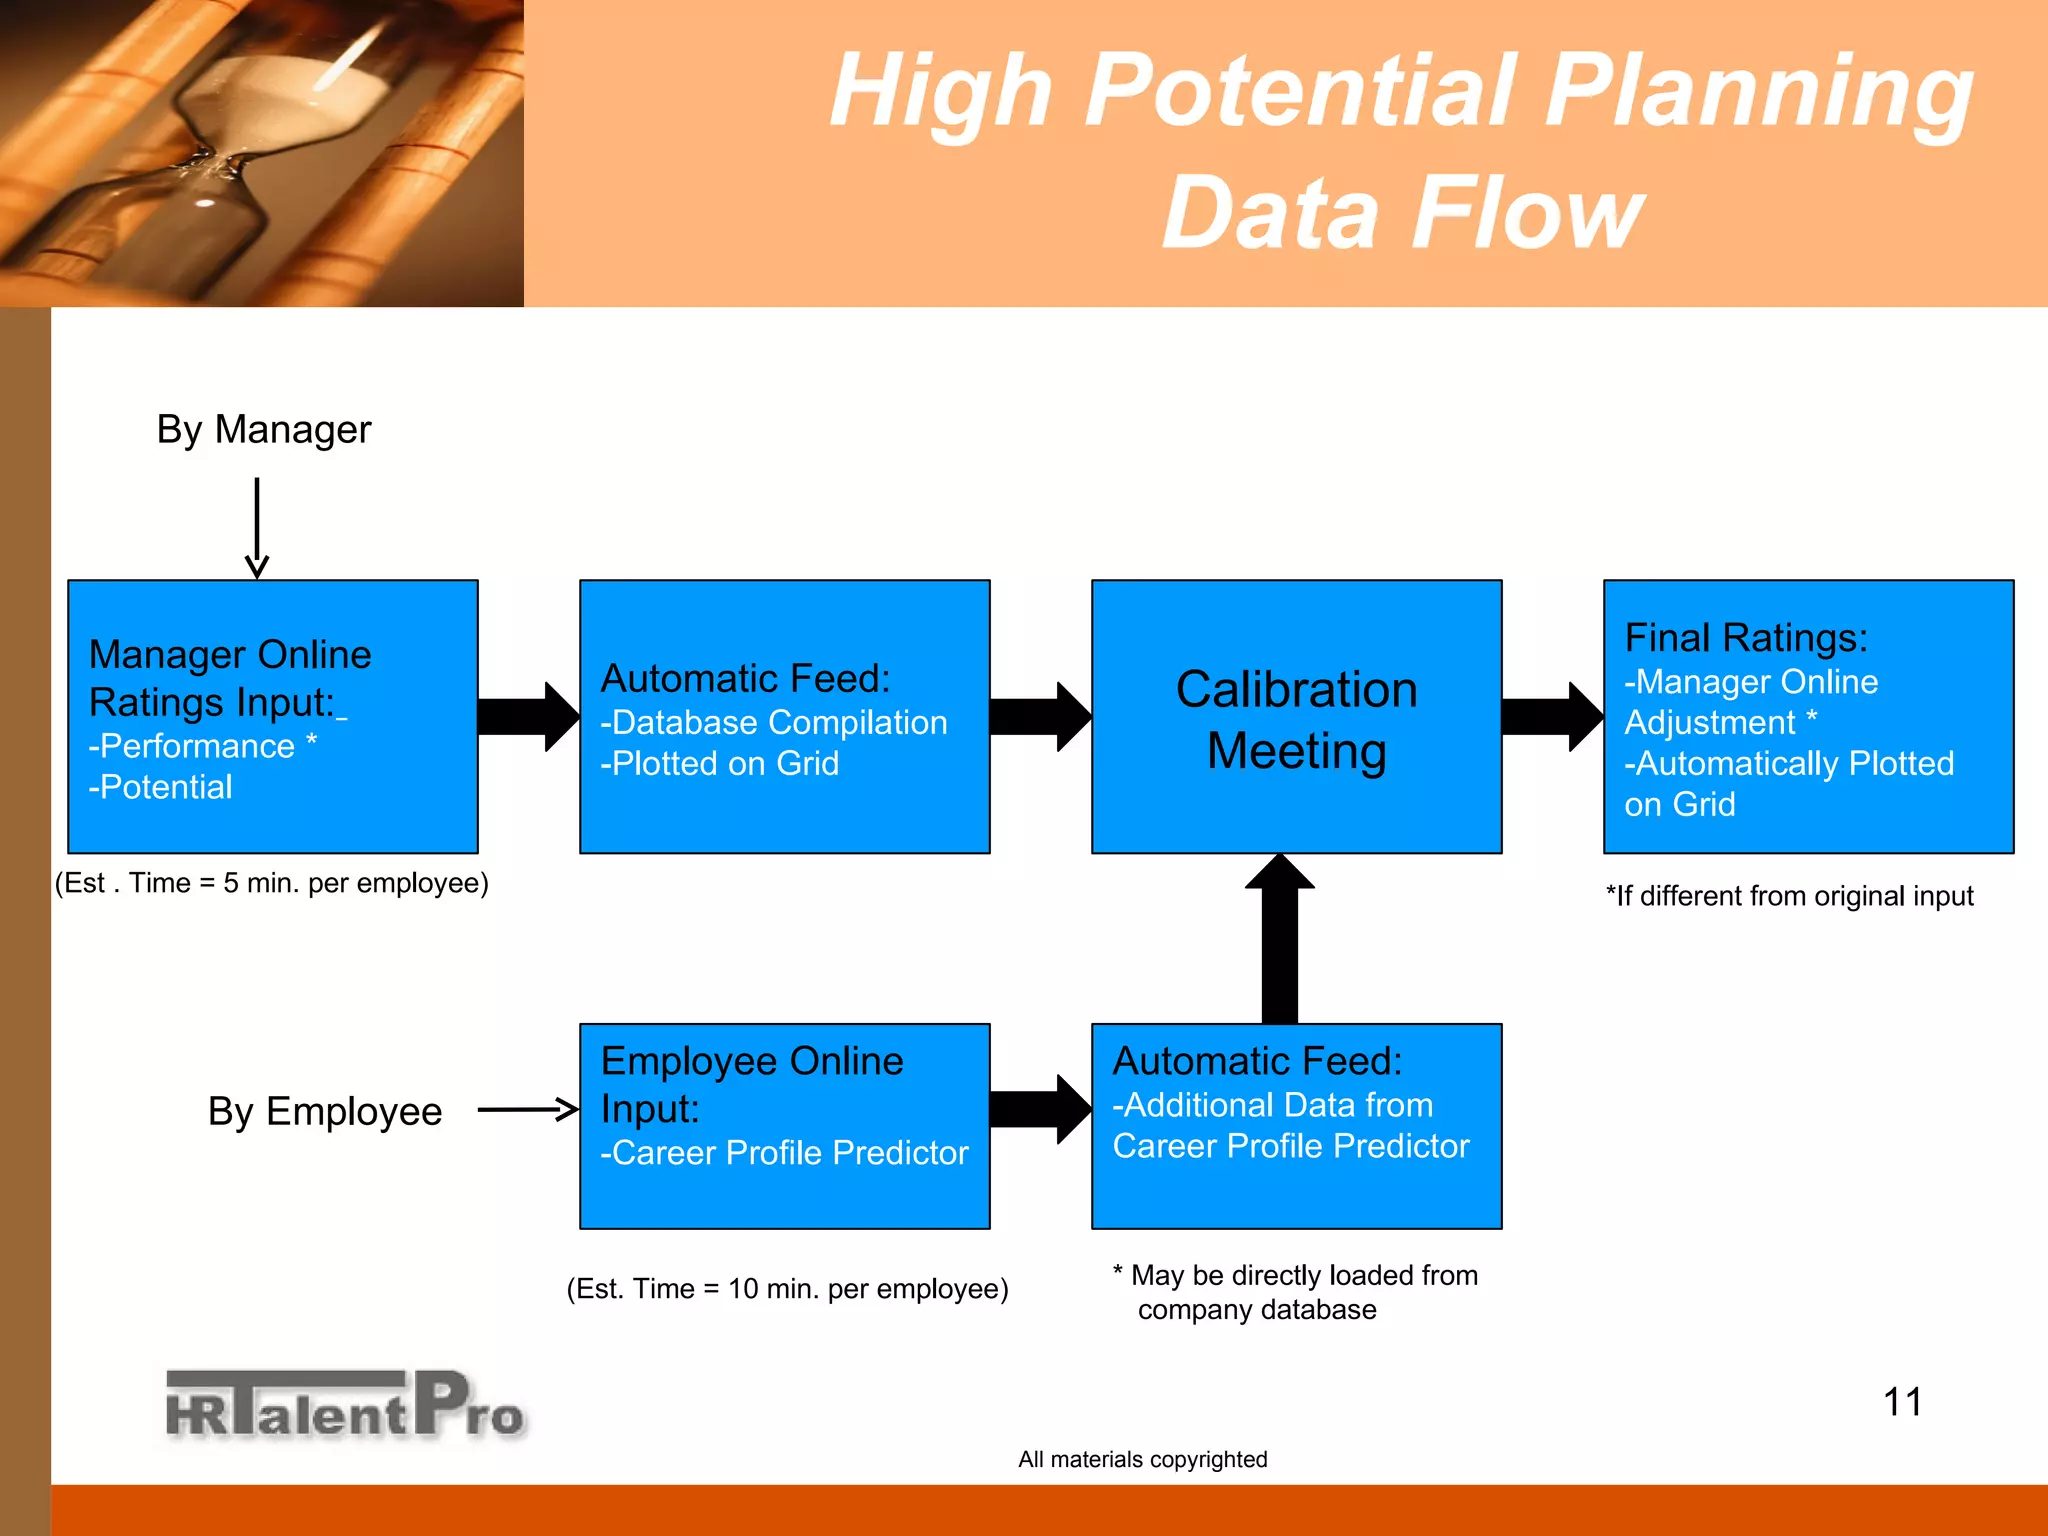
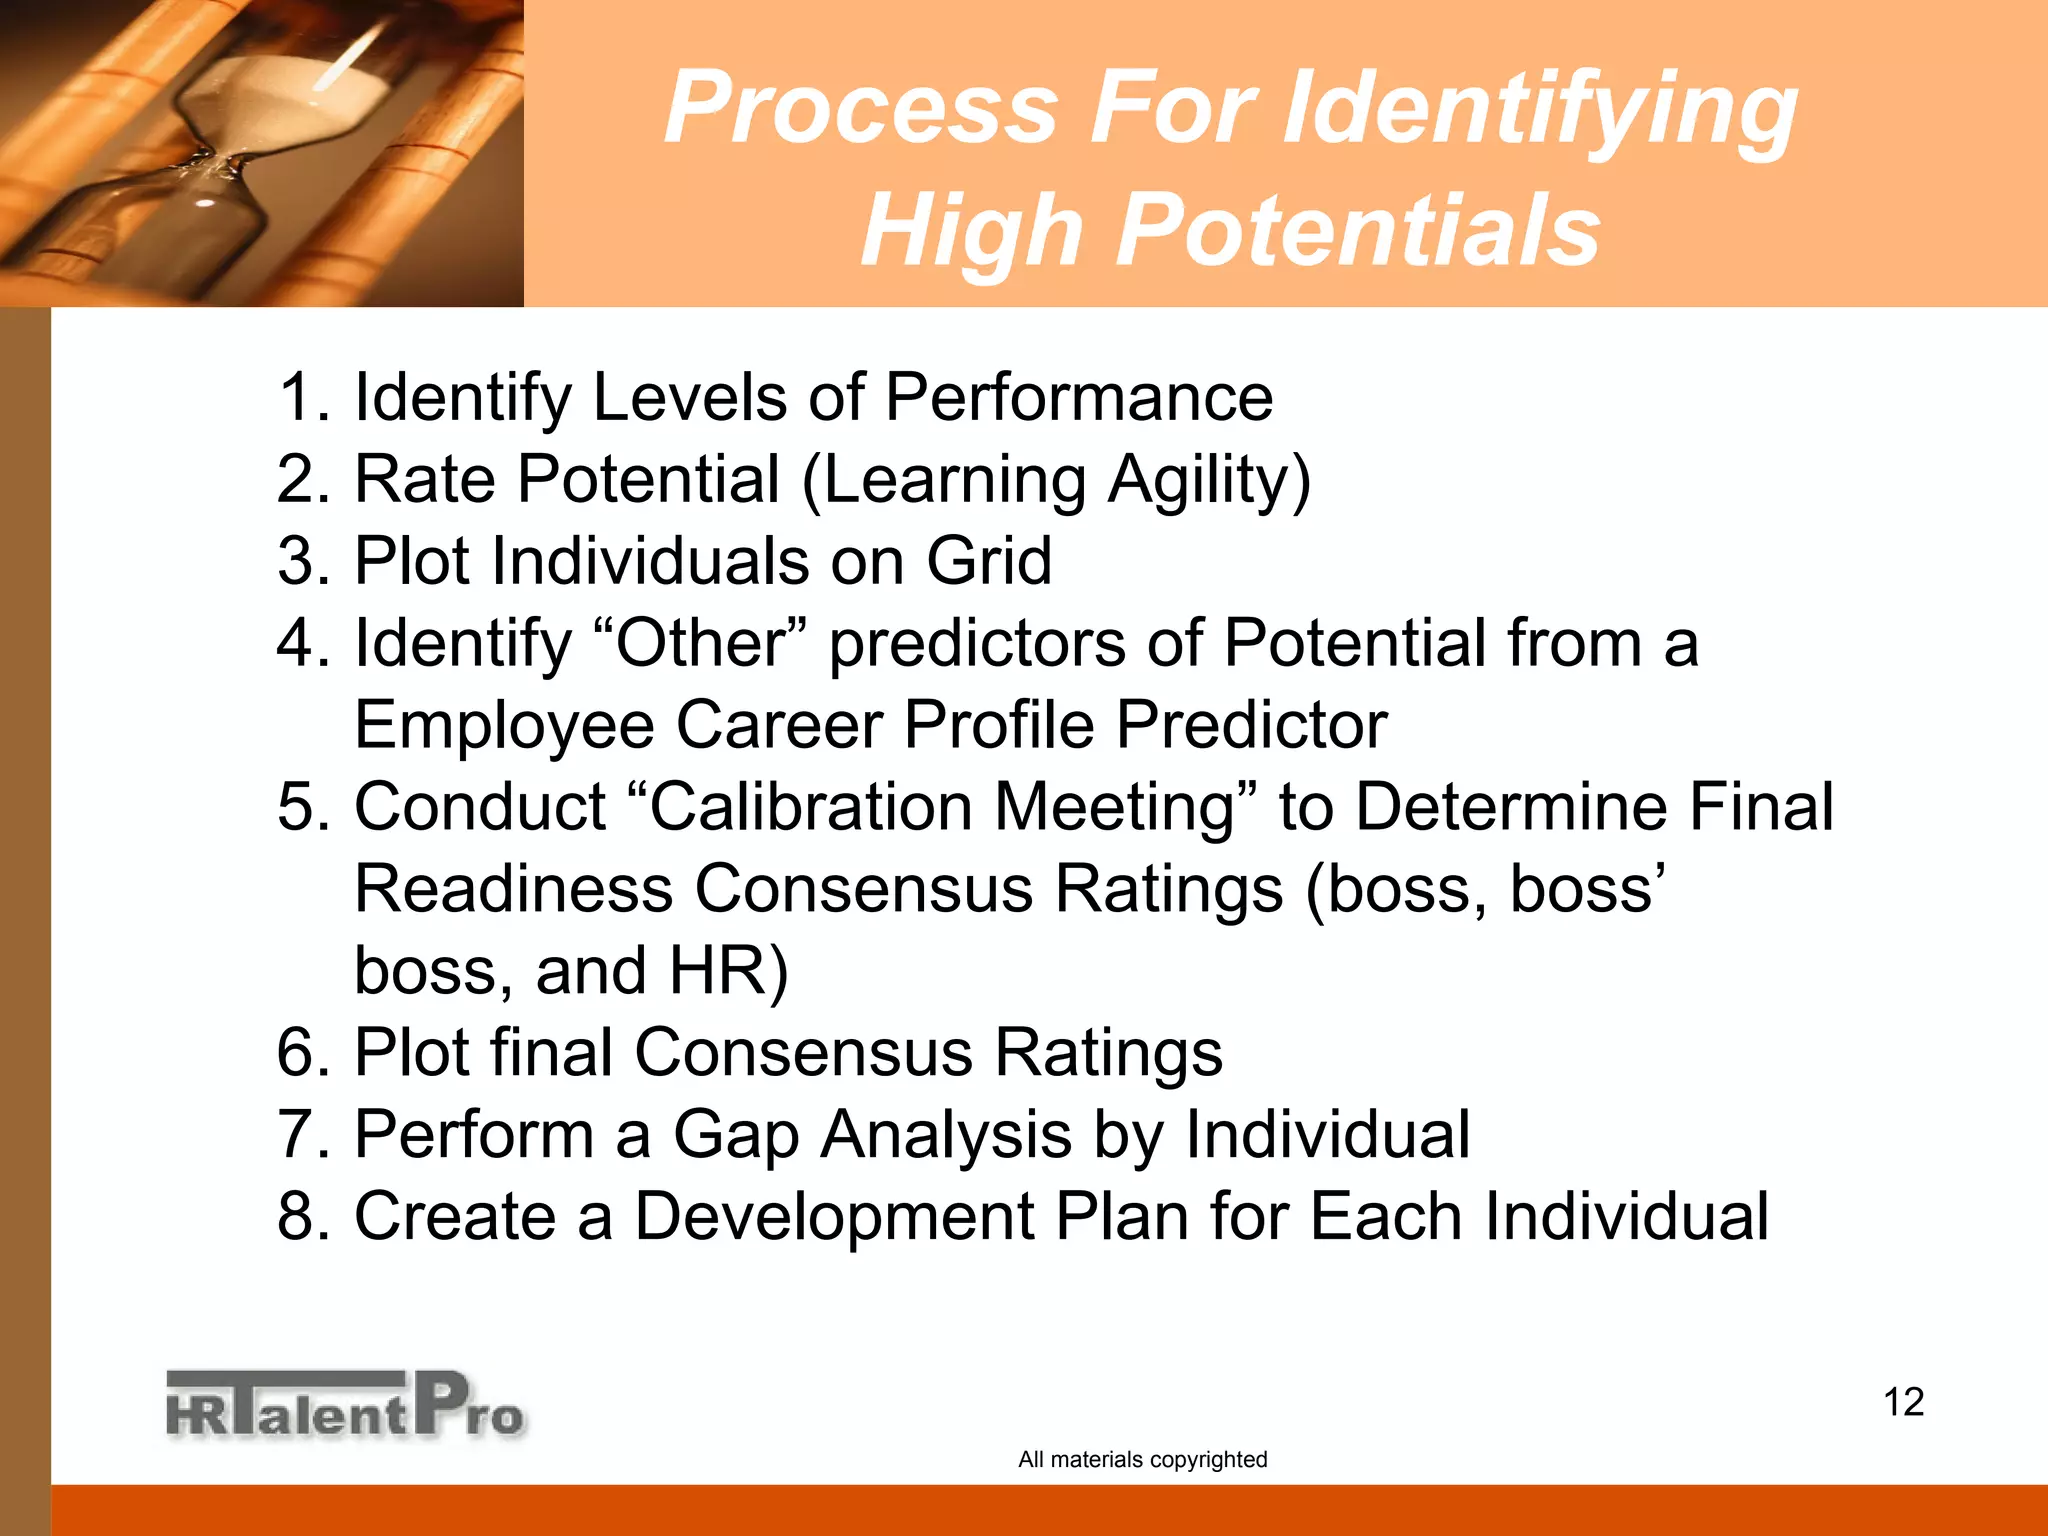
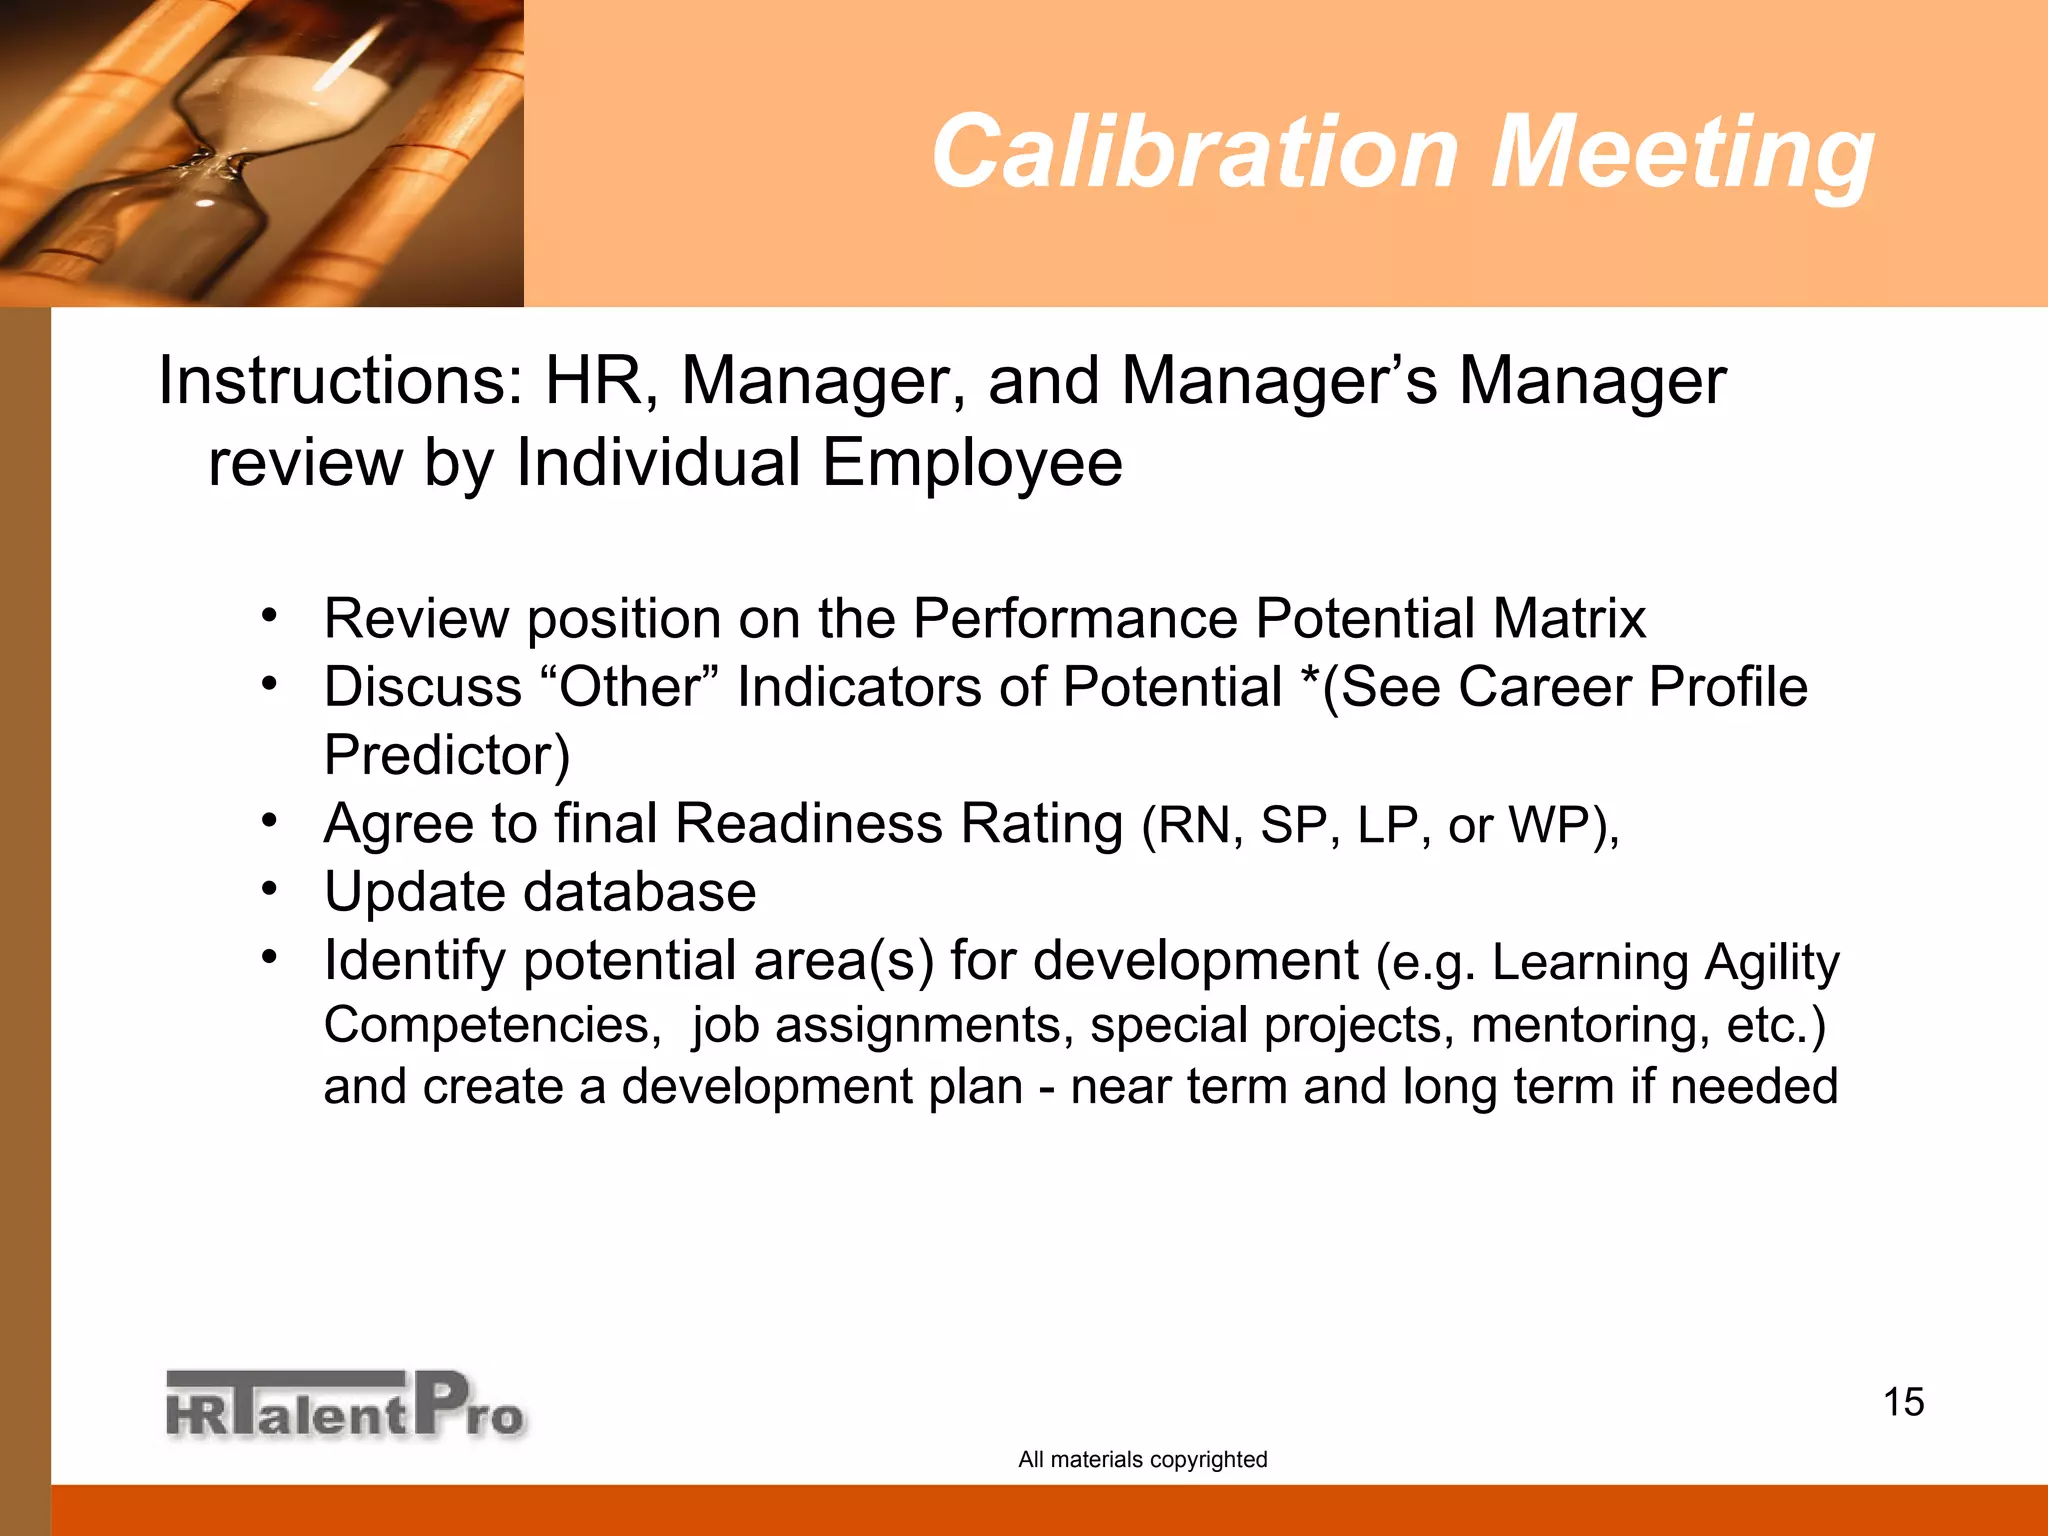
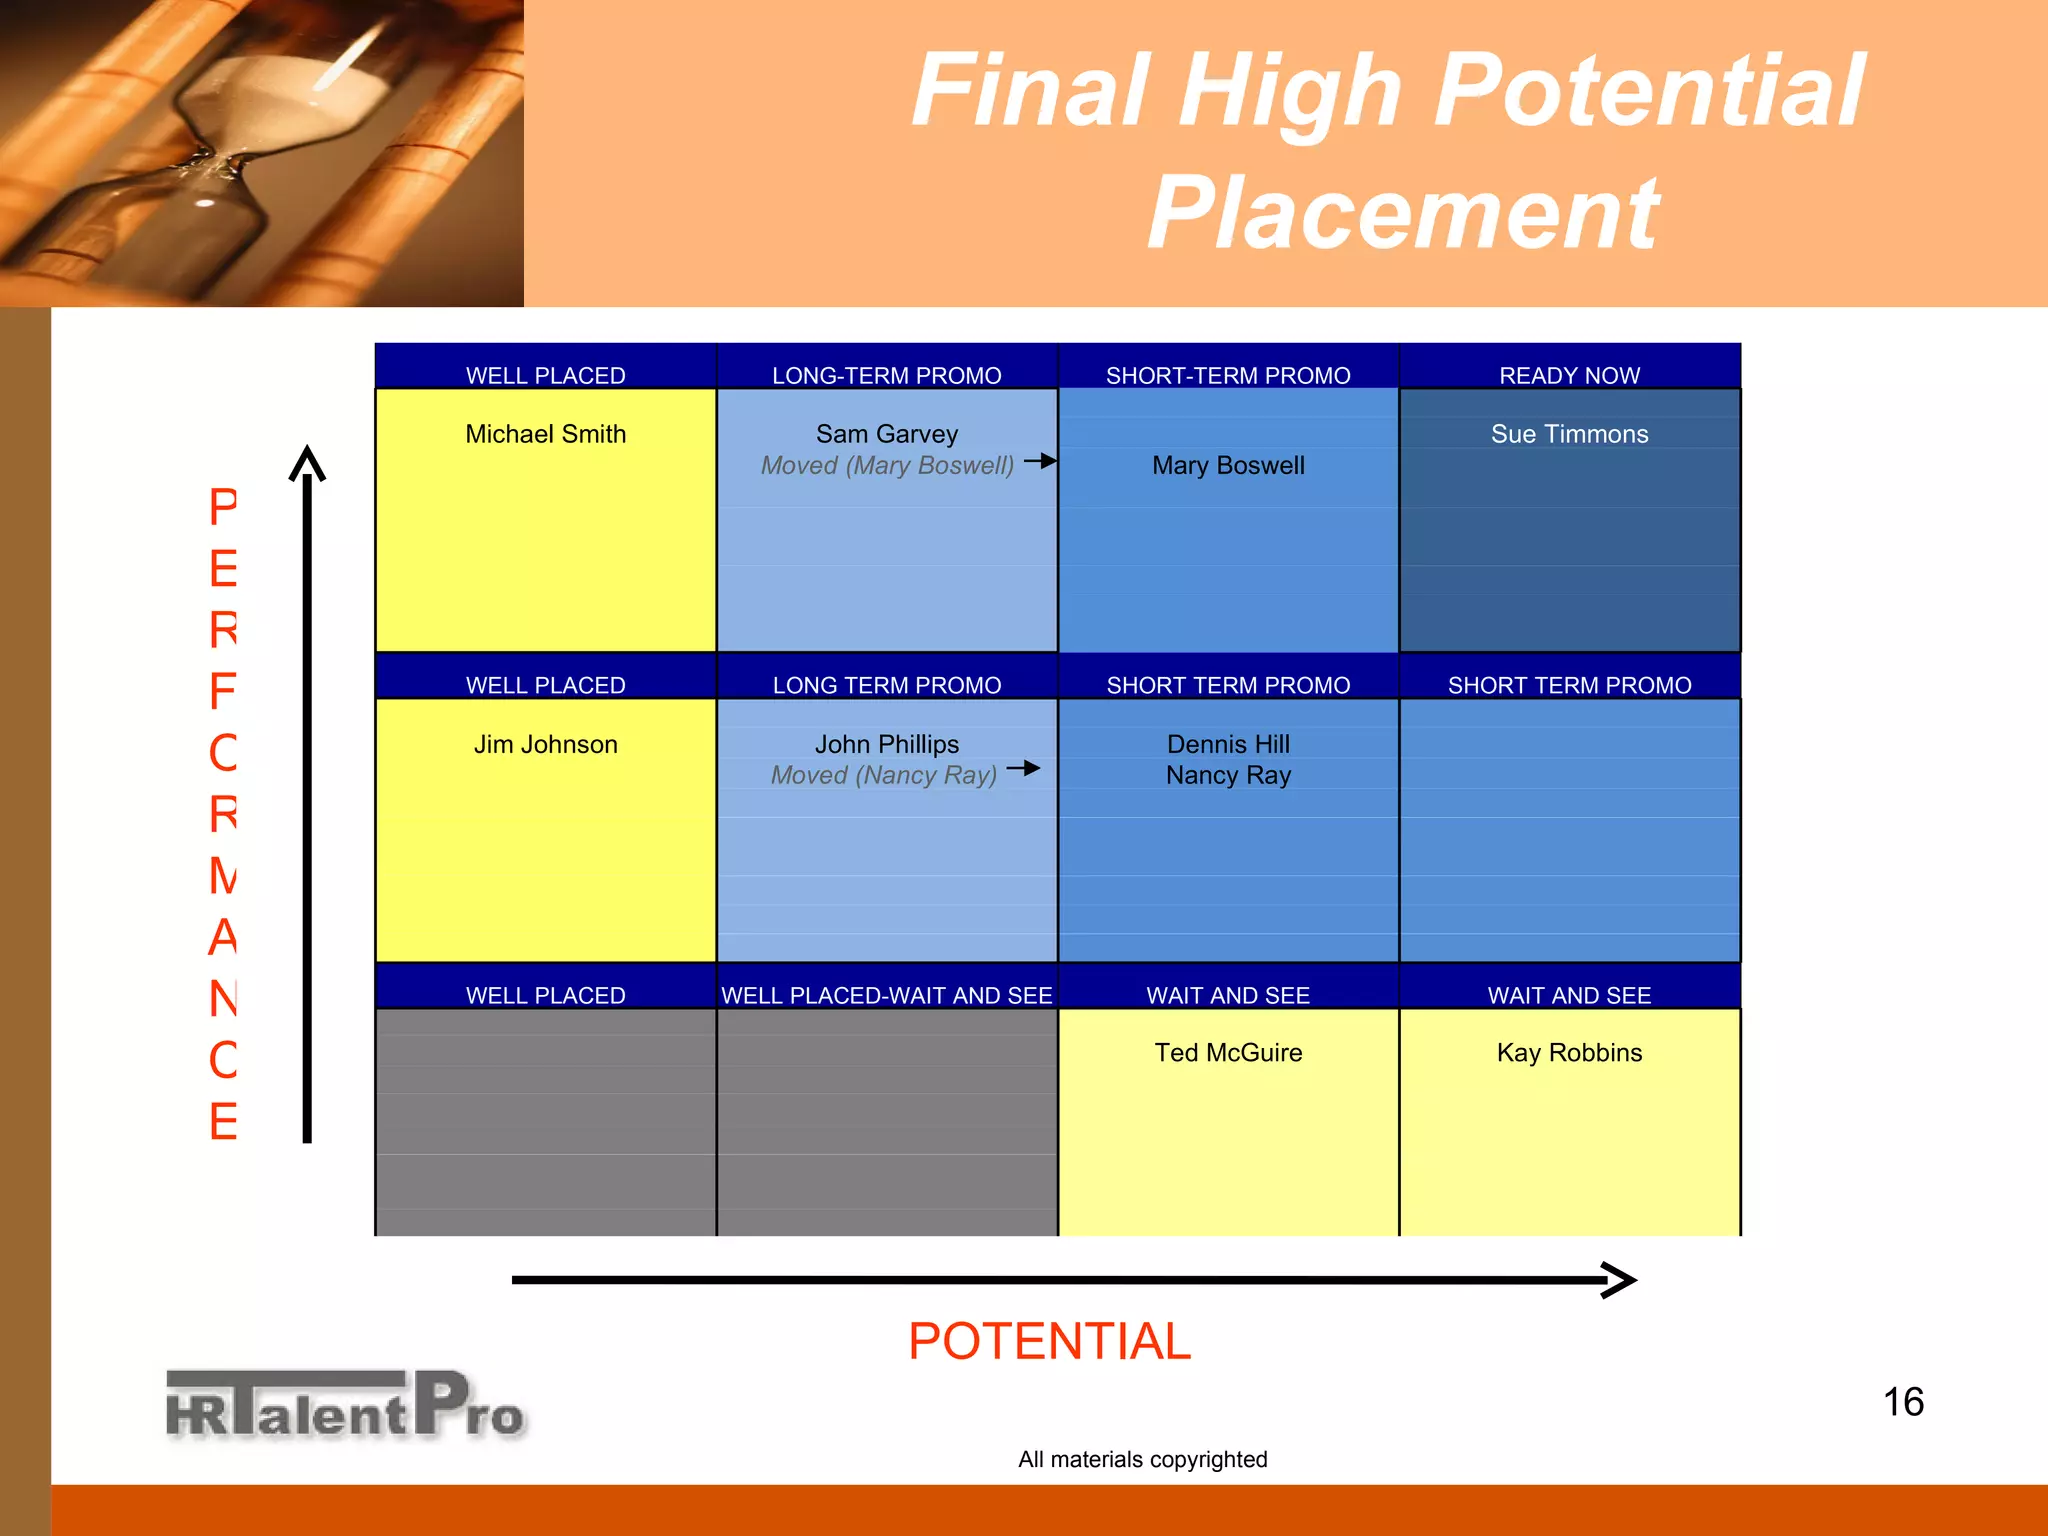

The document describes a model for identifying high potential employees. It involves rating employees on both past performance over 2+ years and future potential. Employees are plotted on a matrix based on these ratings and classified as ready now, short-term promotable, long-term promotable, or well placed. Managers further discuss employees' potential based on competencies and career profiles to determine a final consensus rating. Development plans are then created to help employees progress.