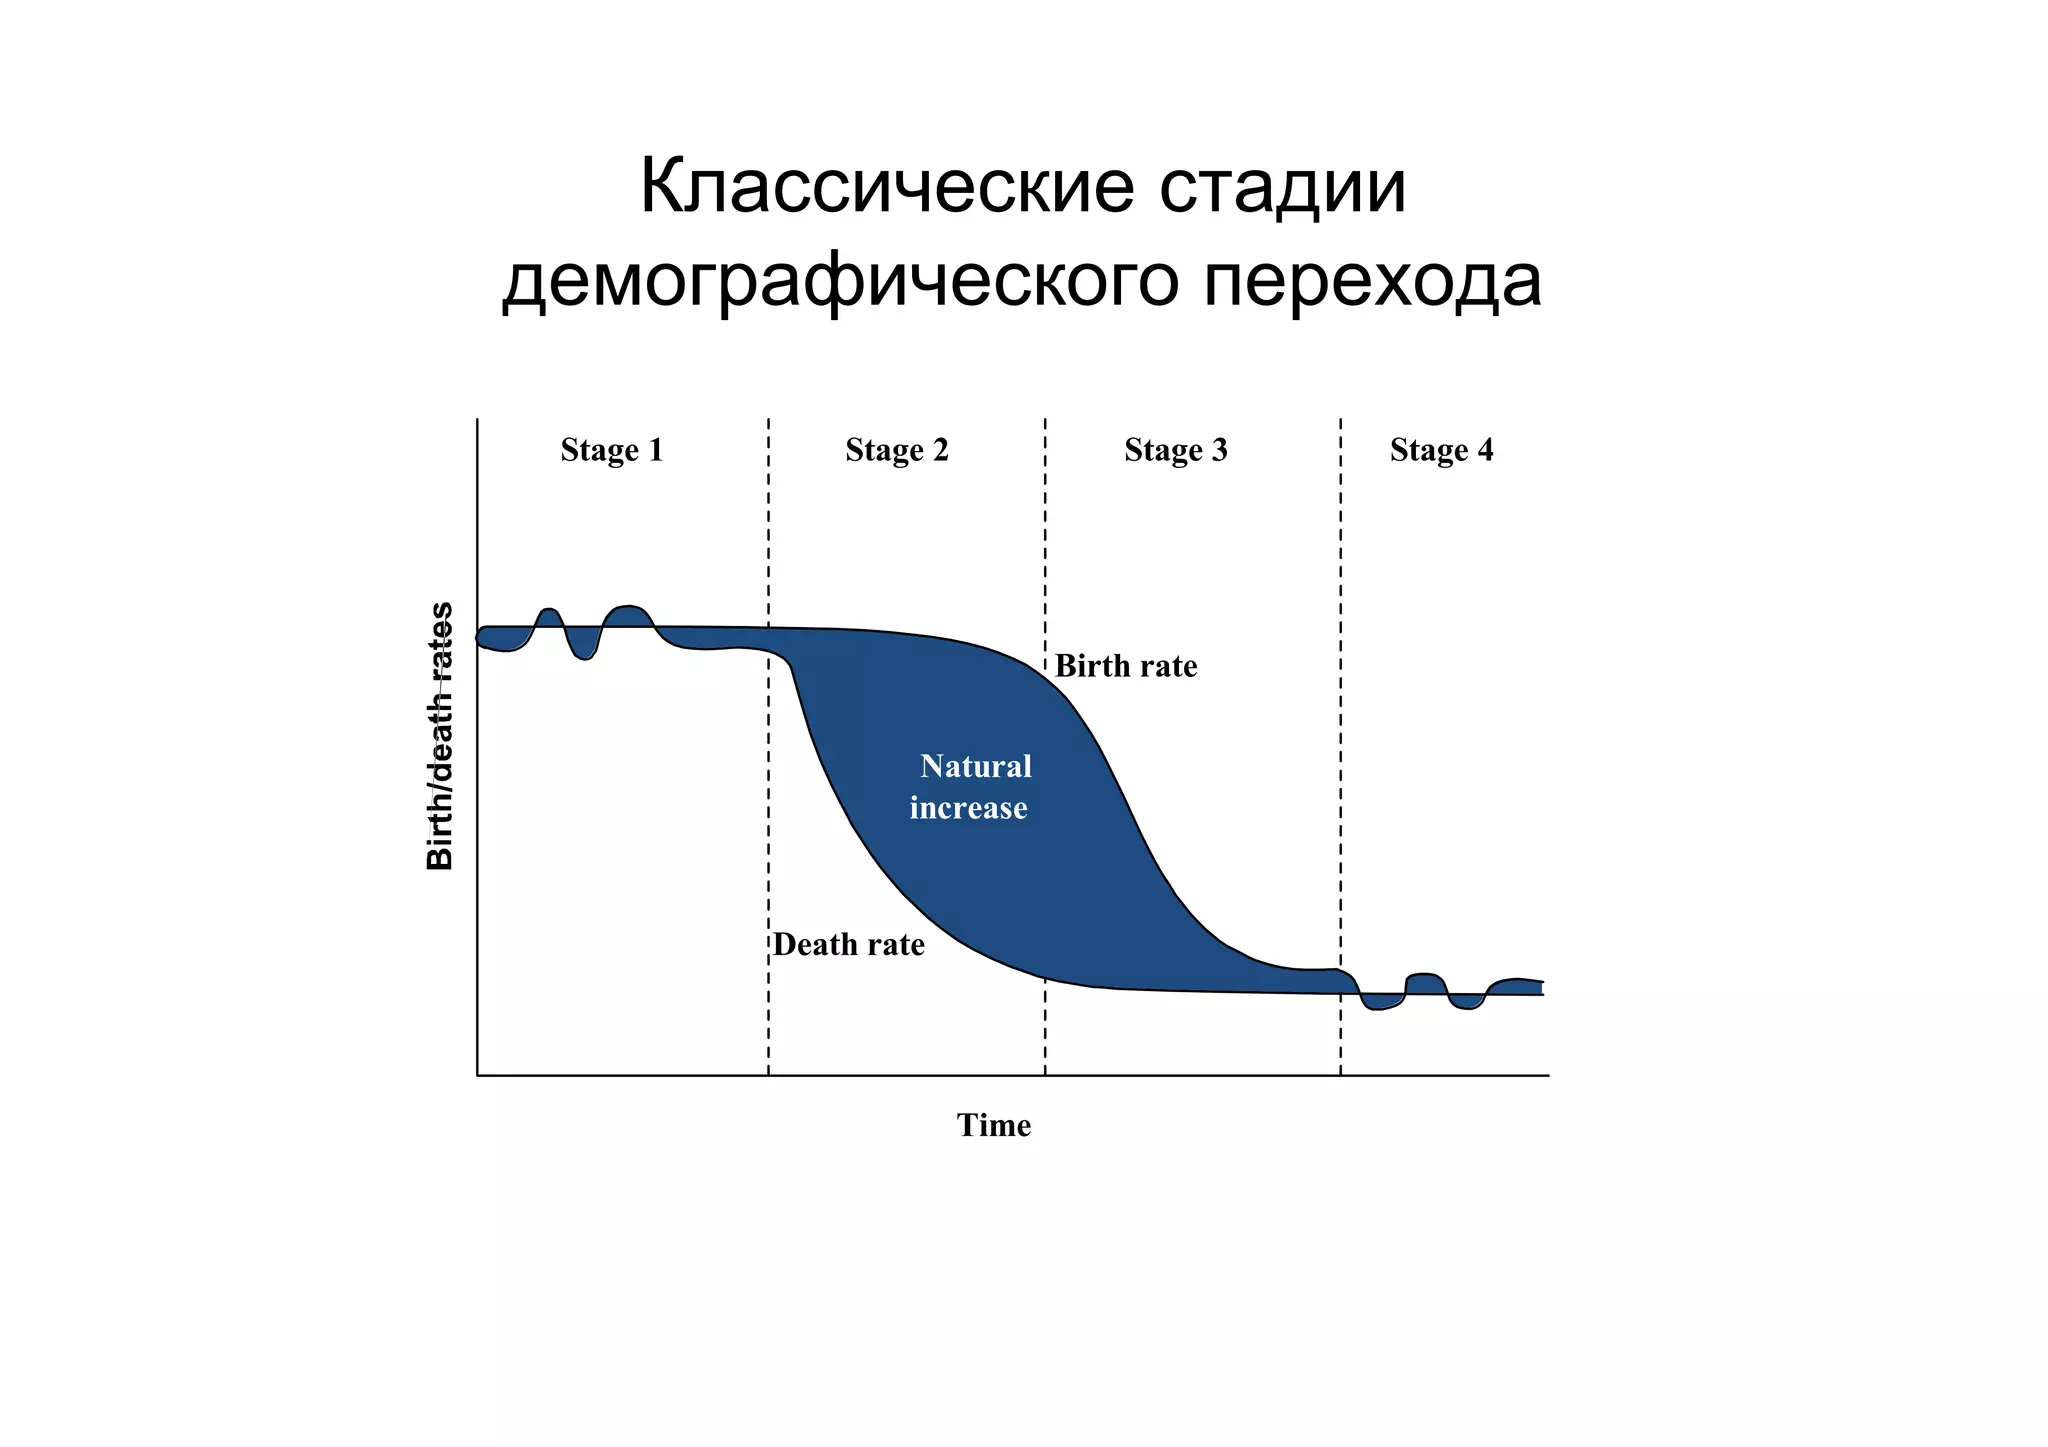
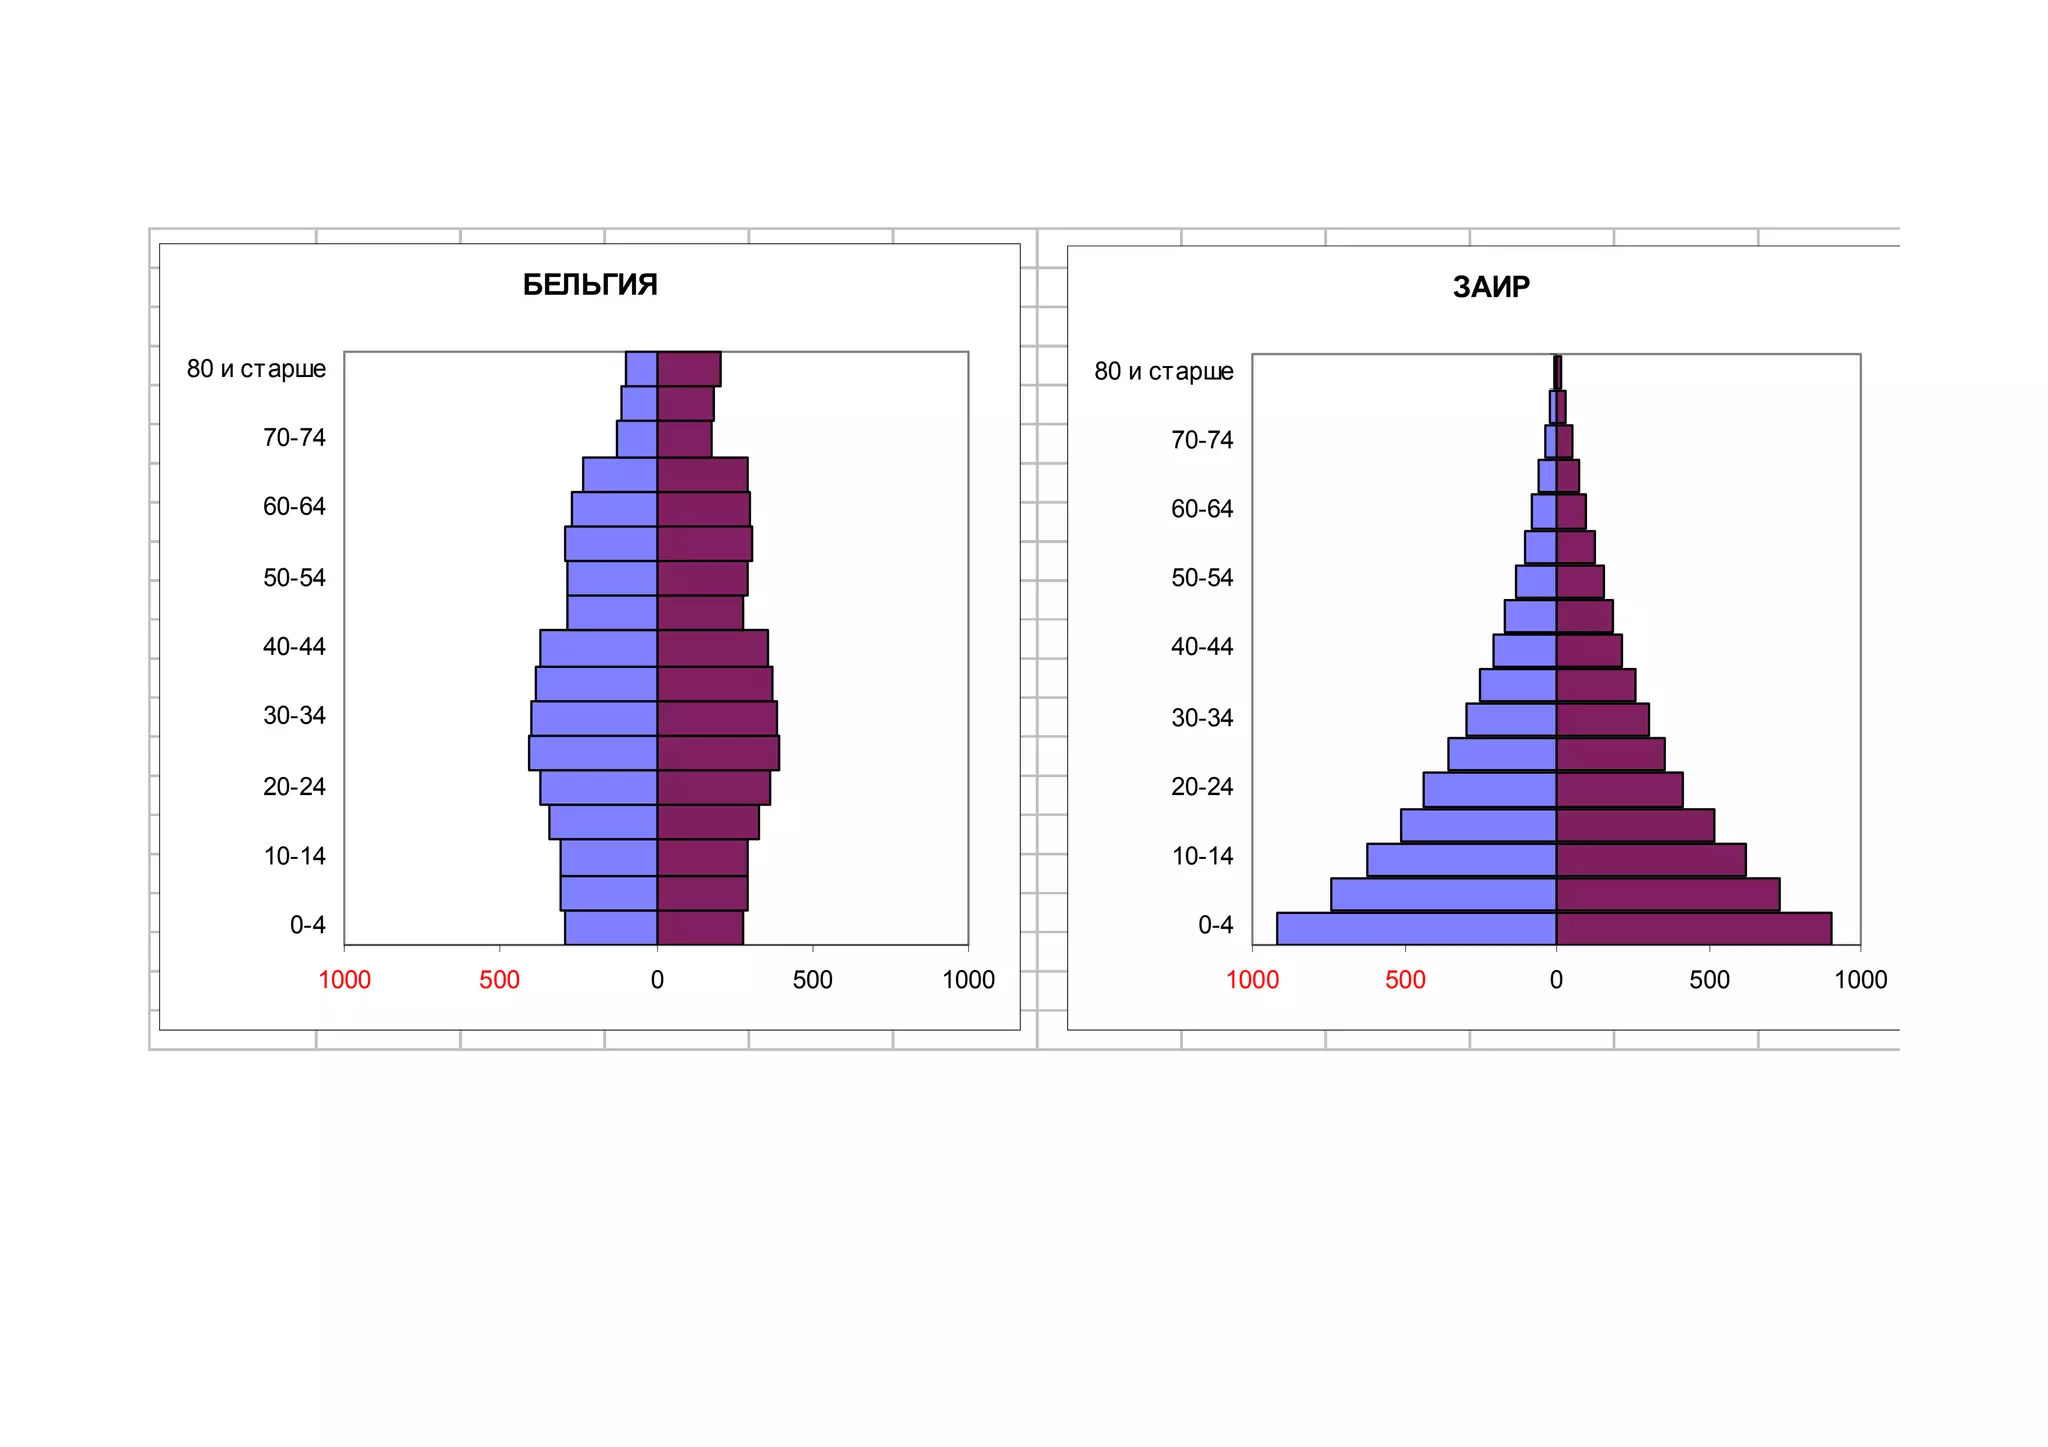
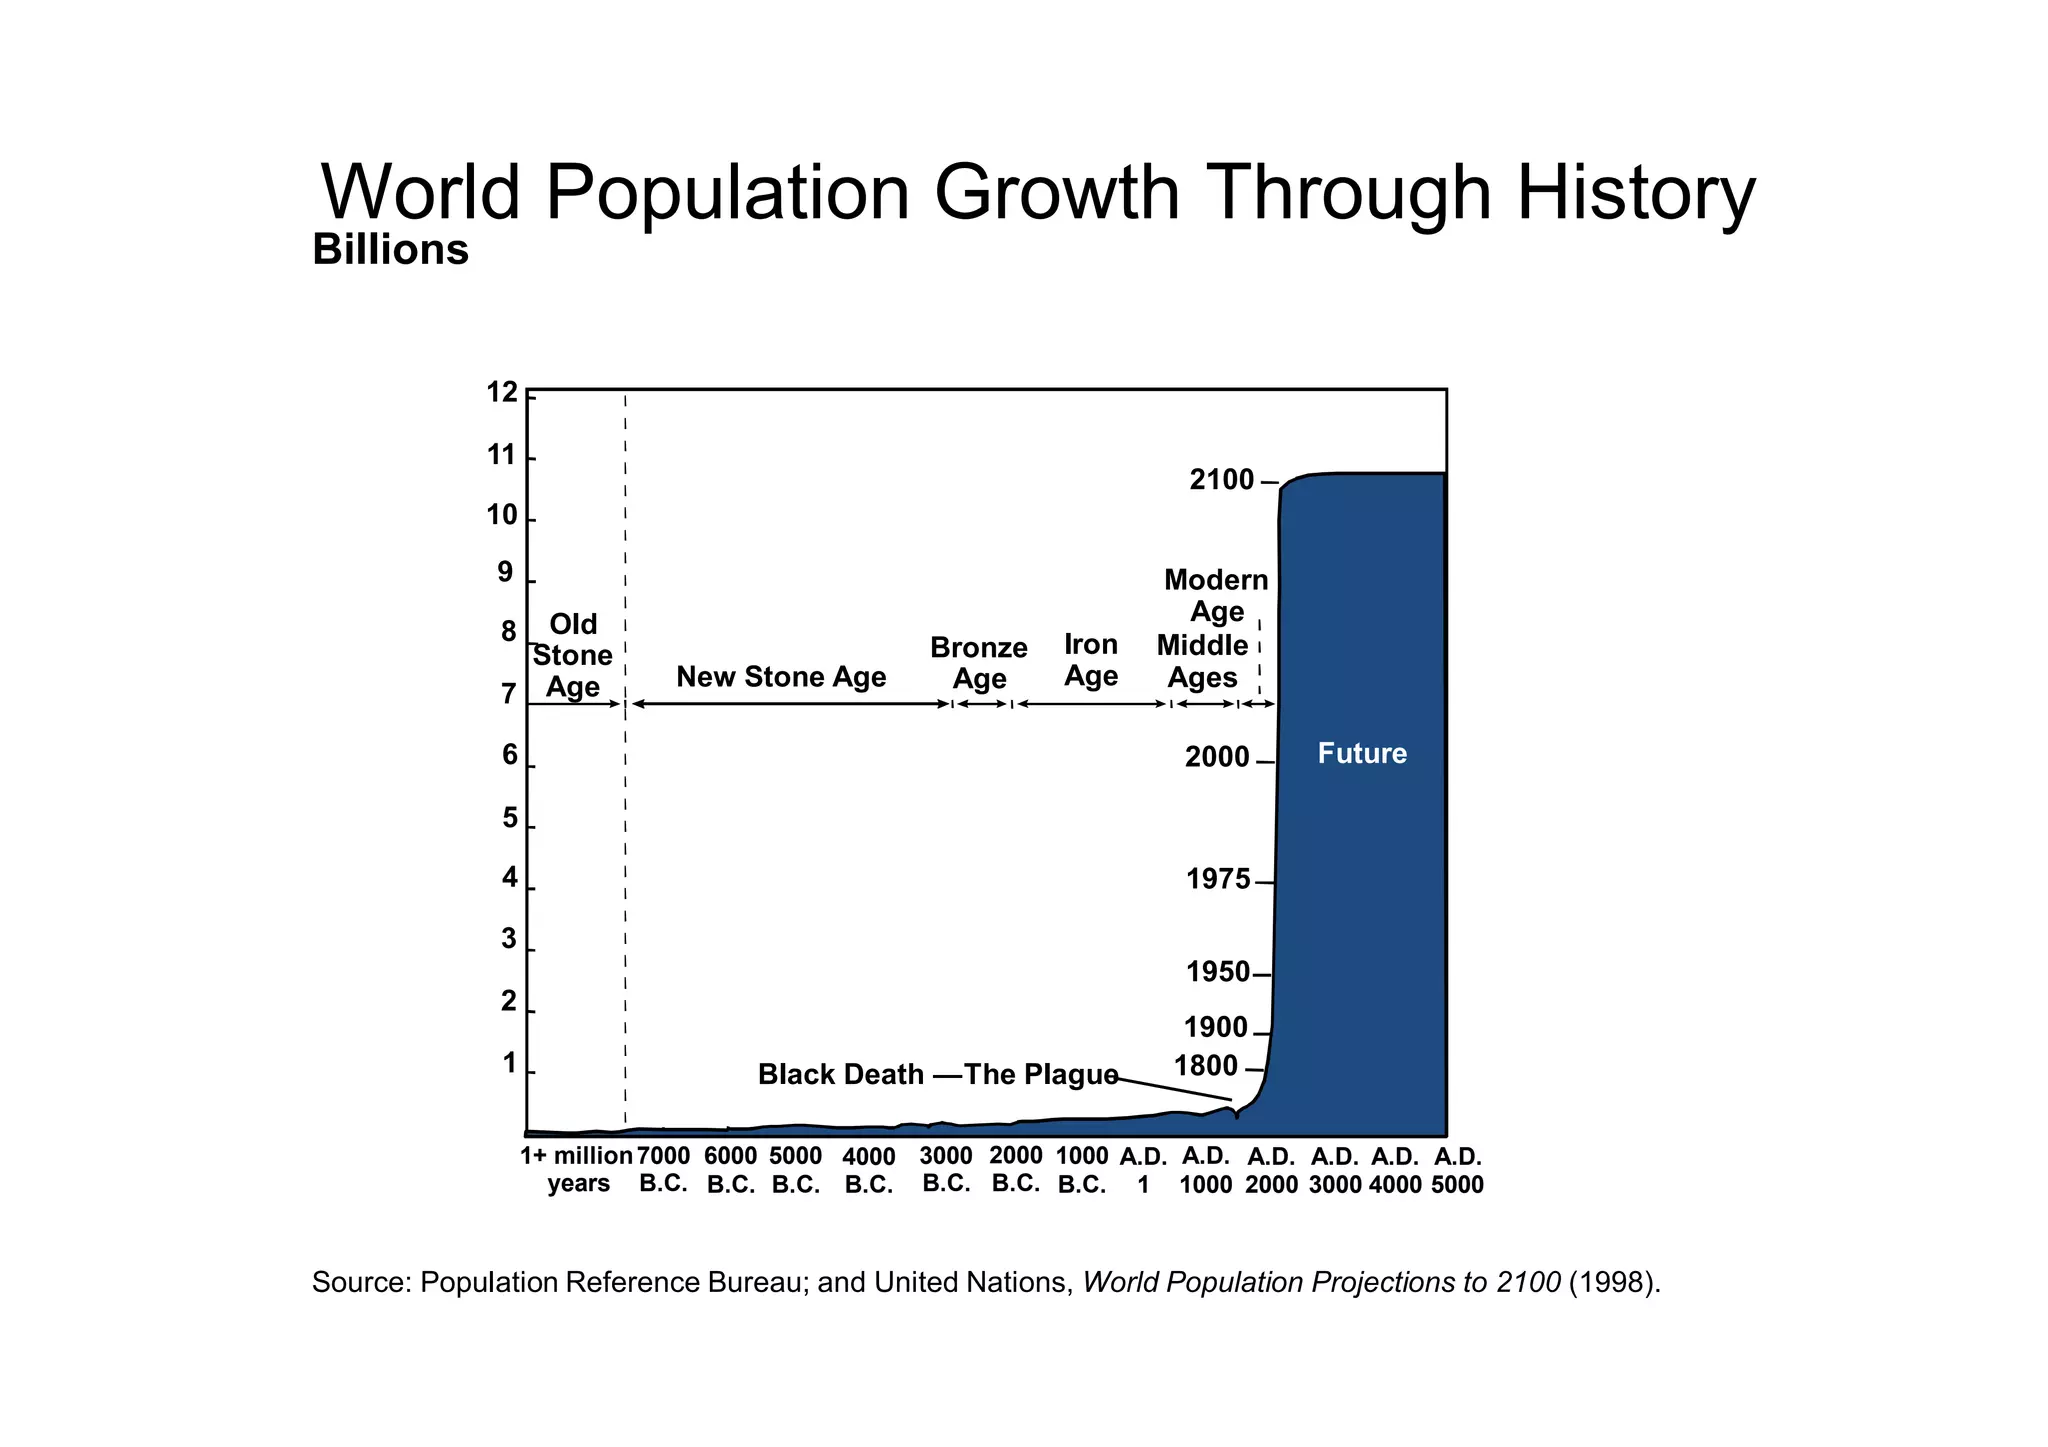
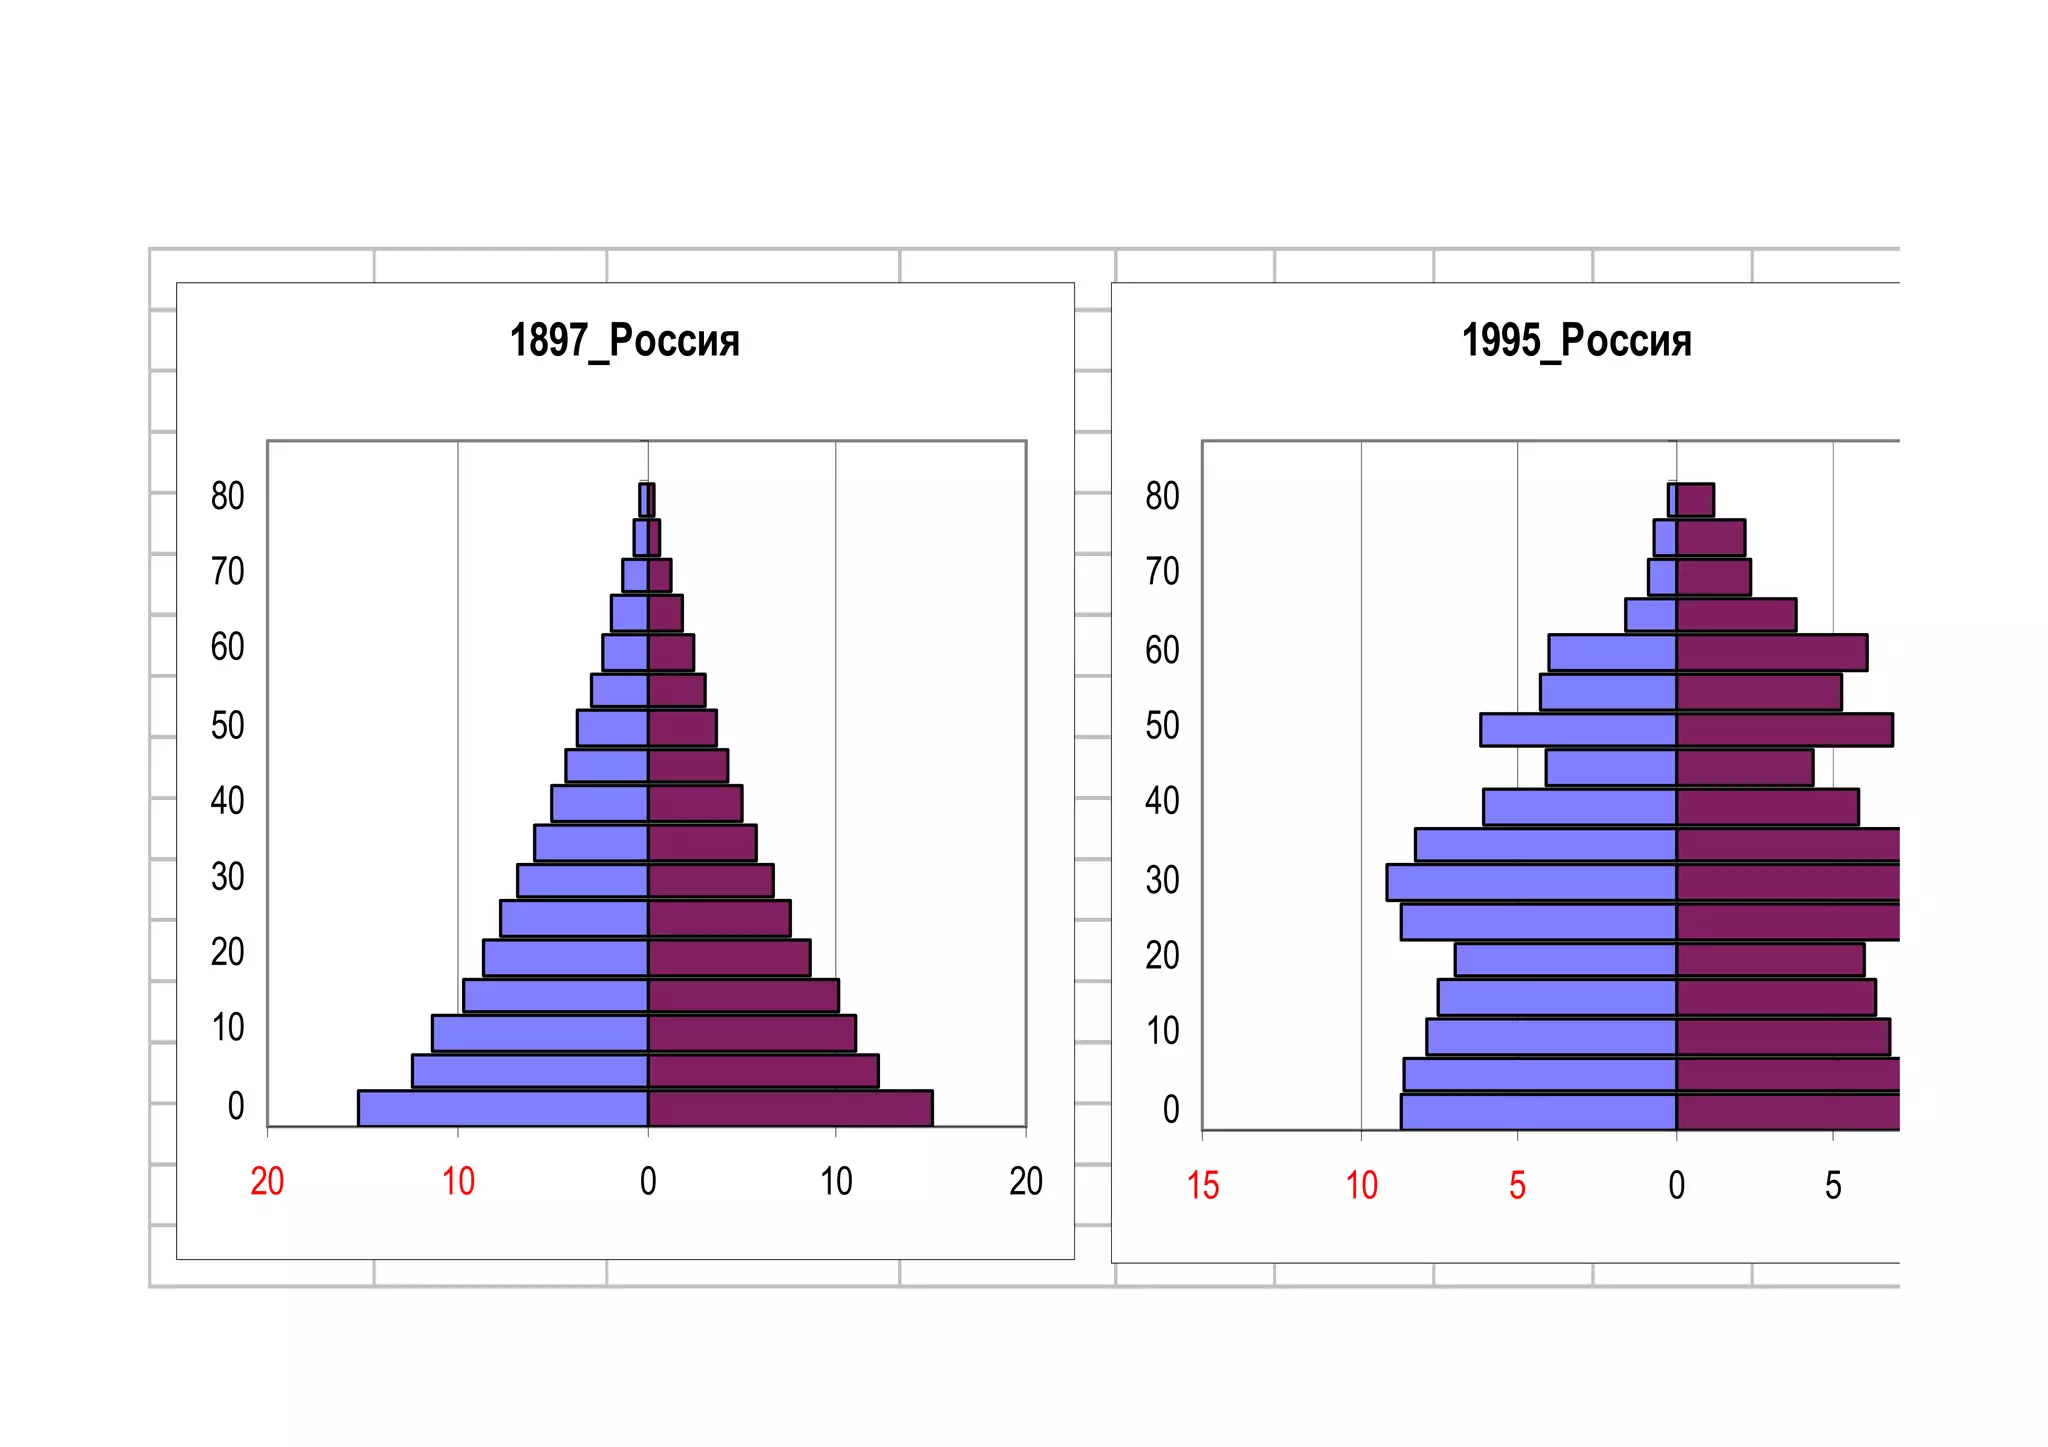
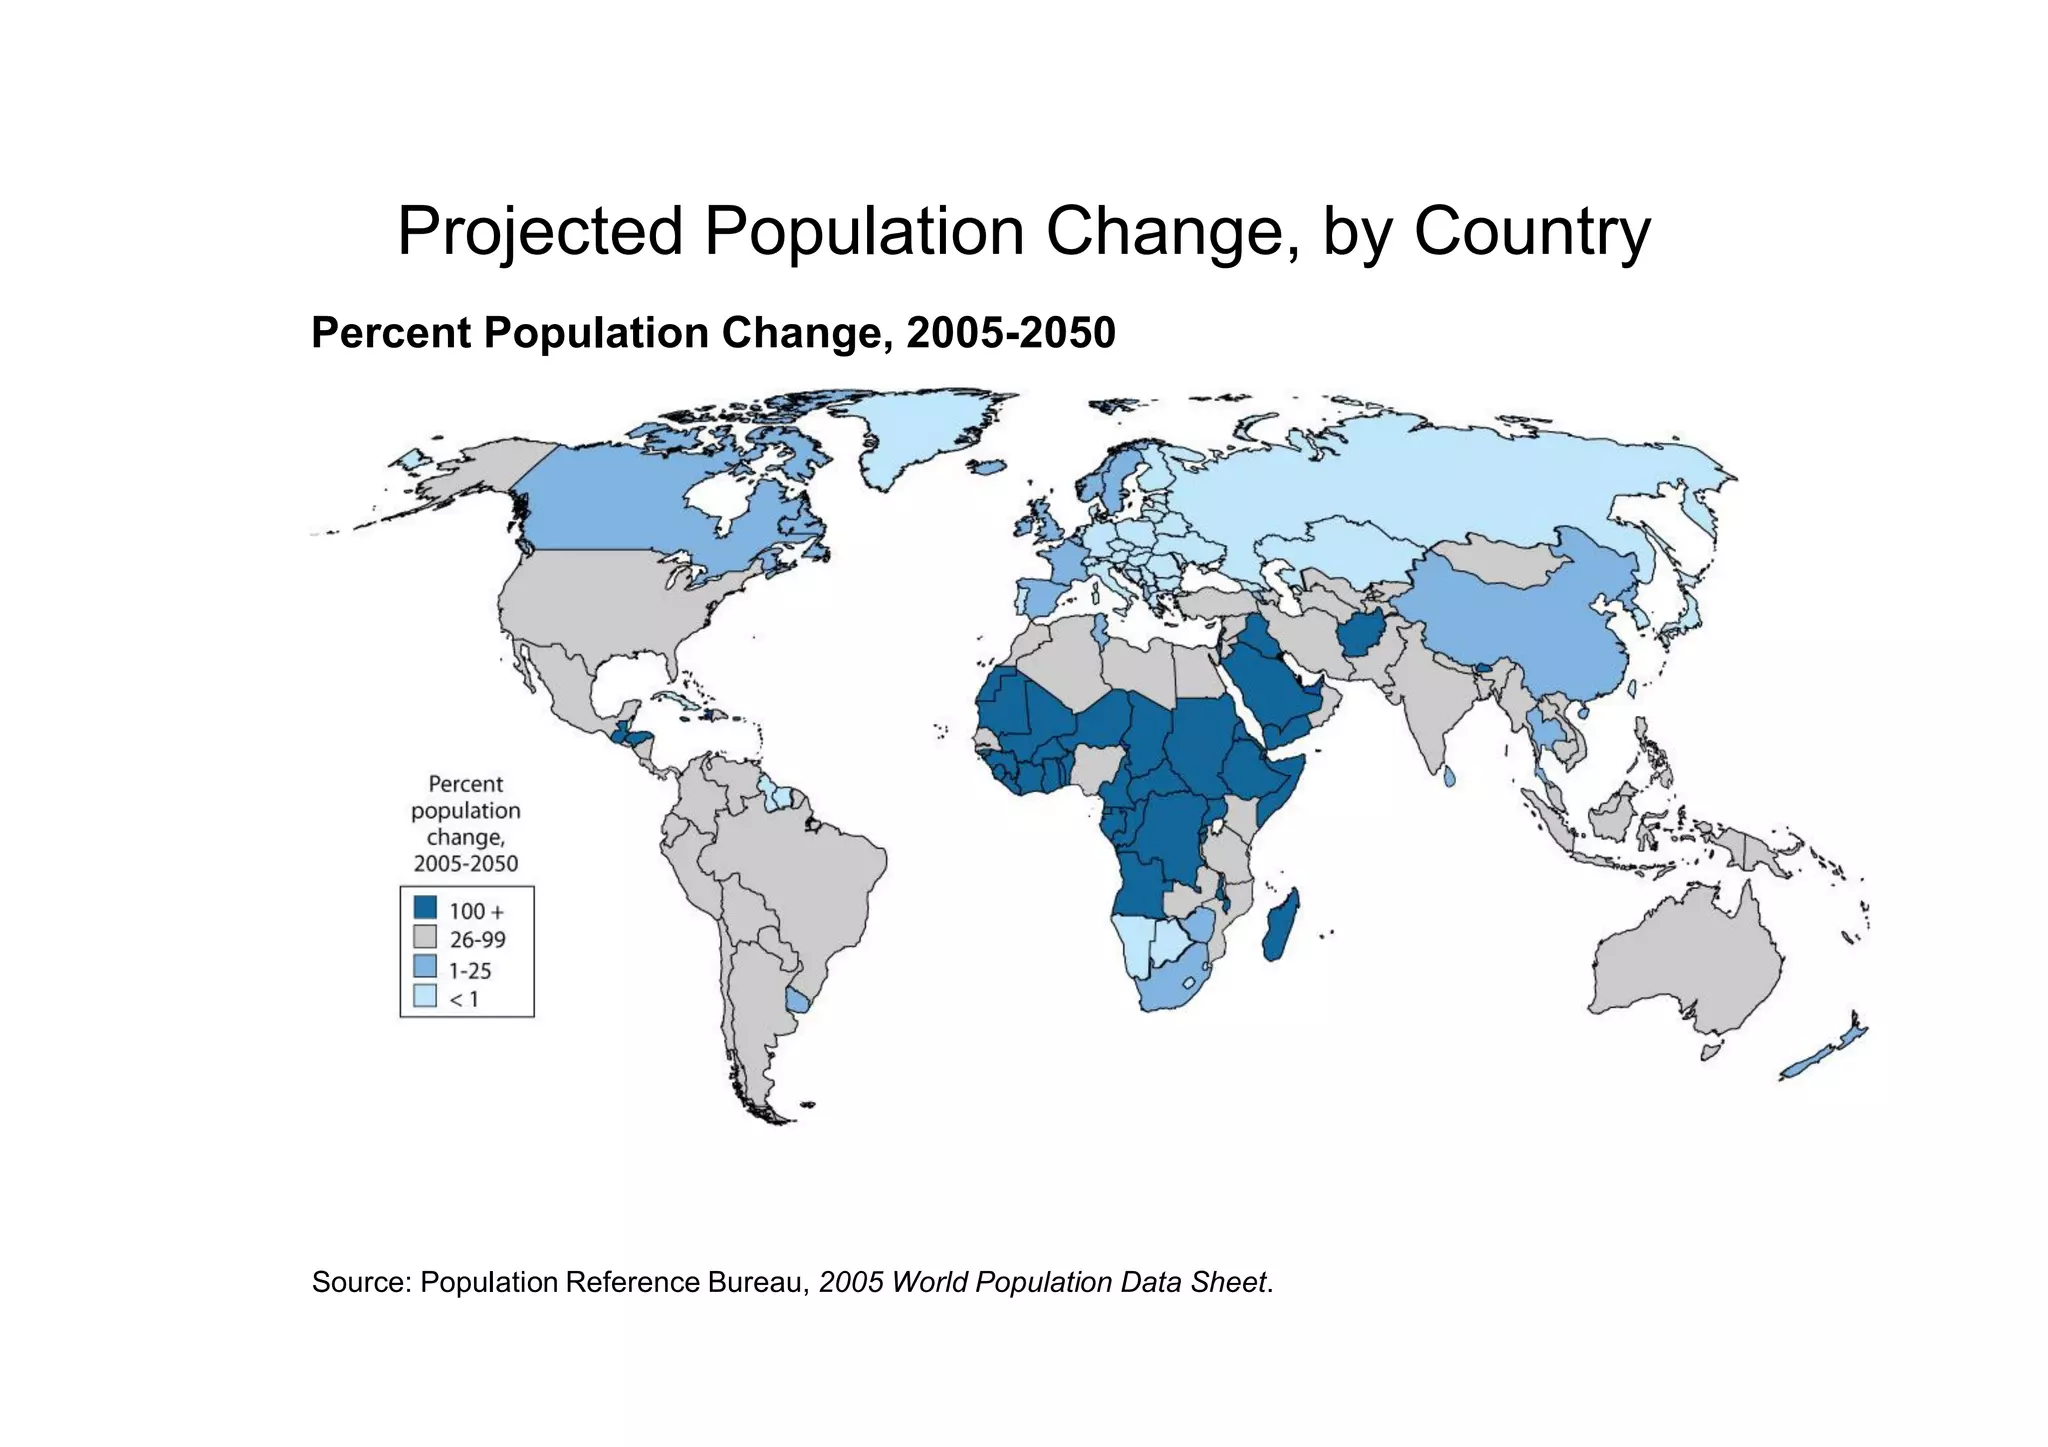
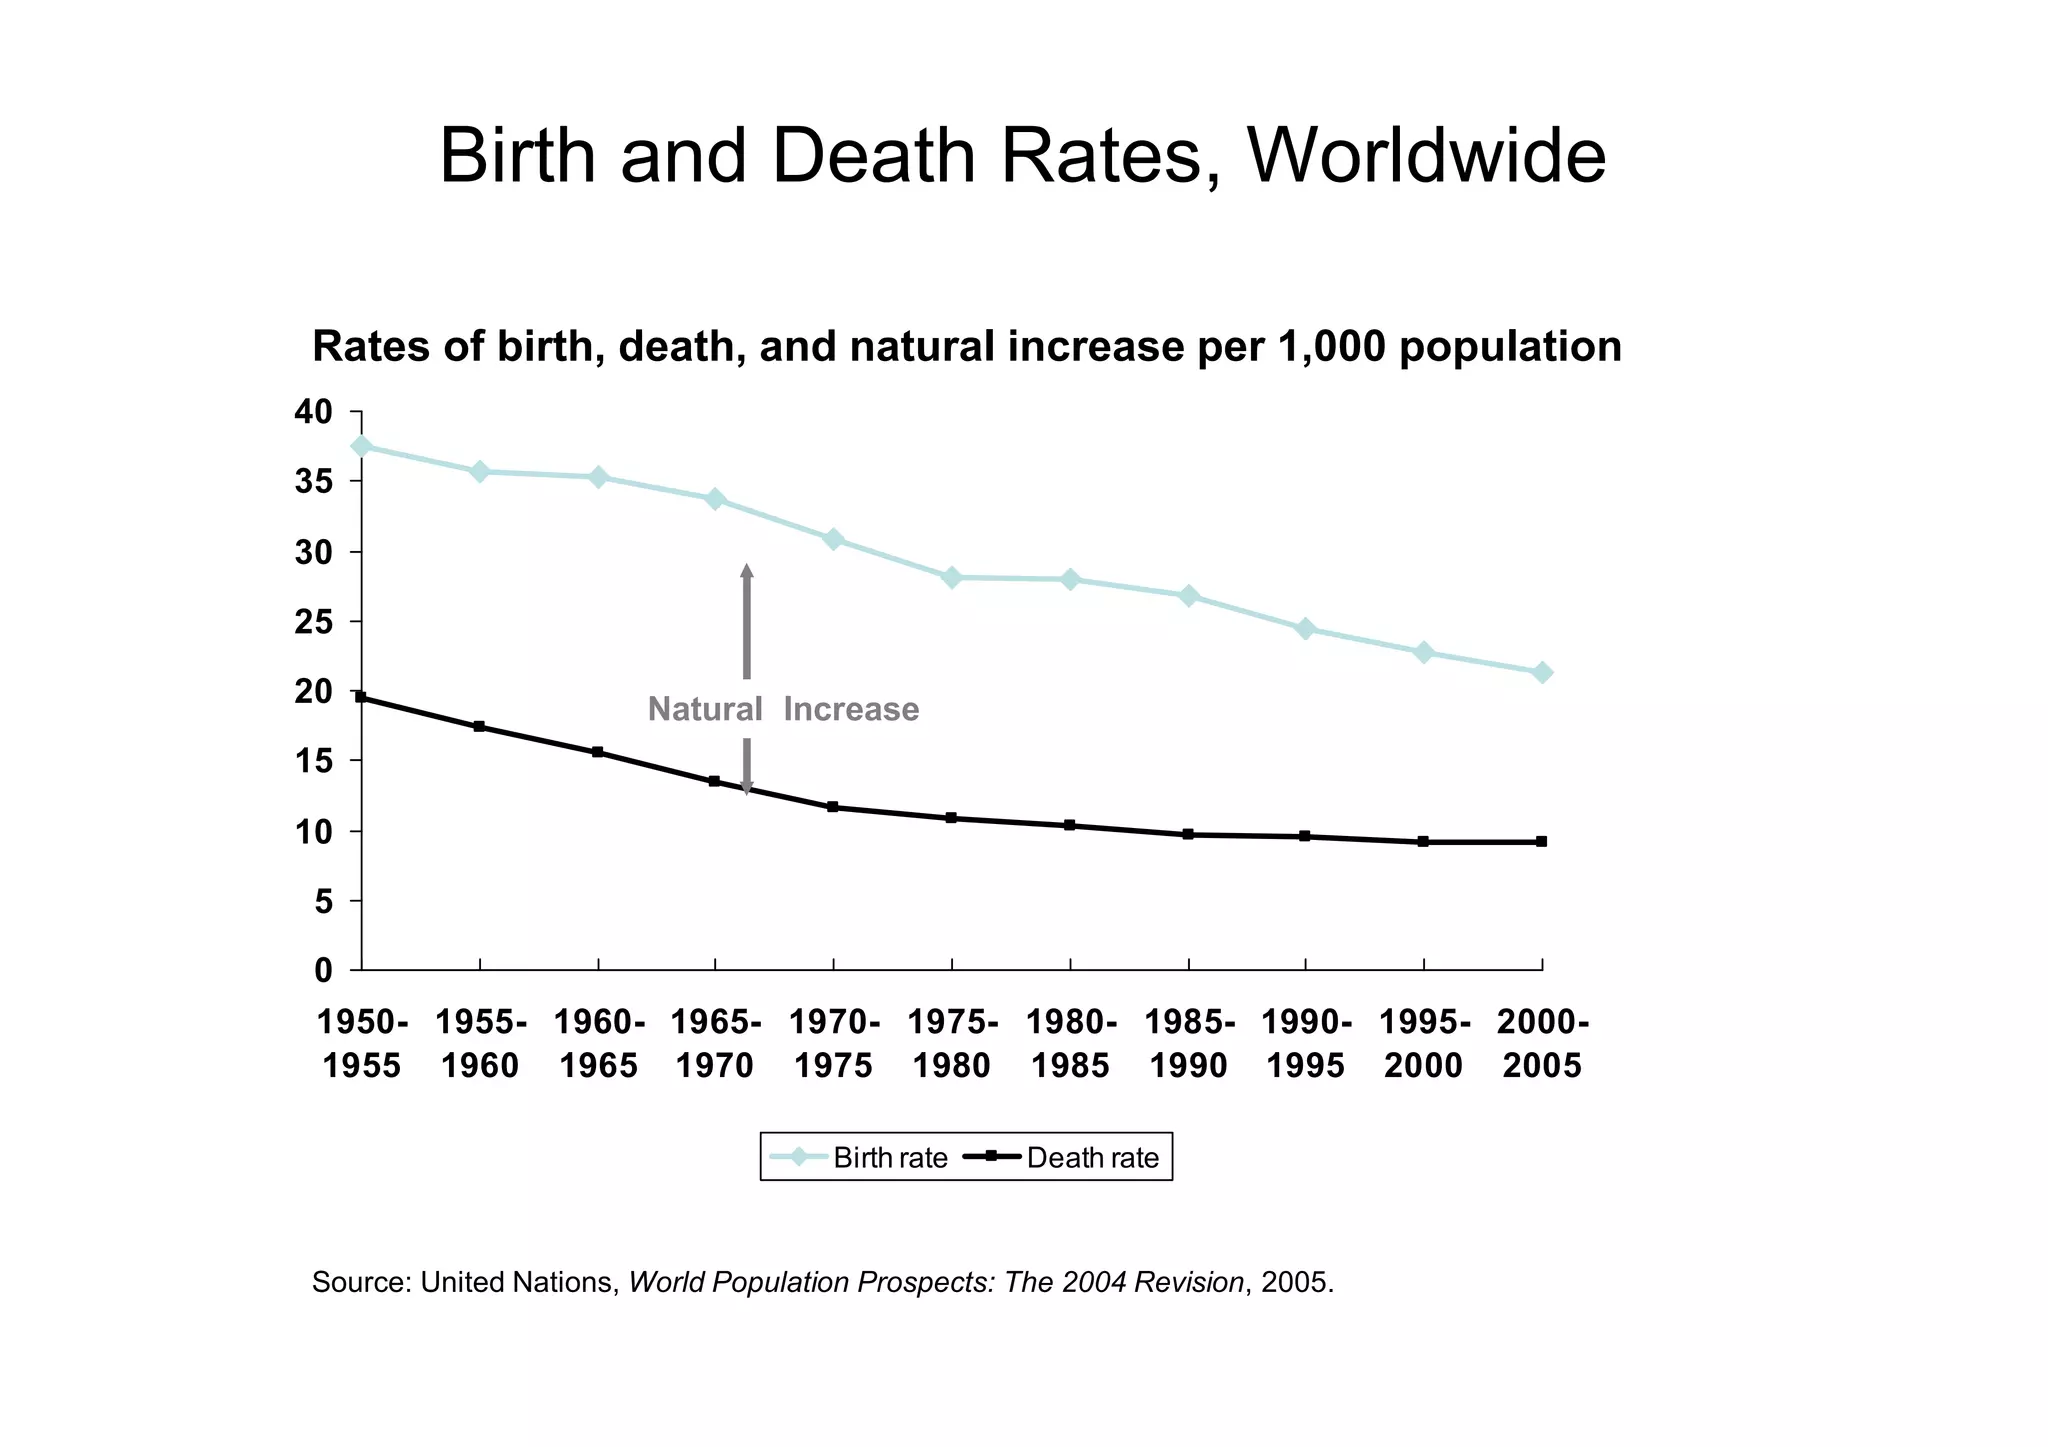
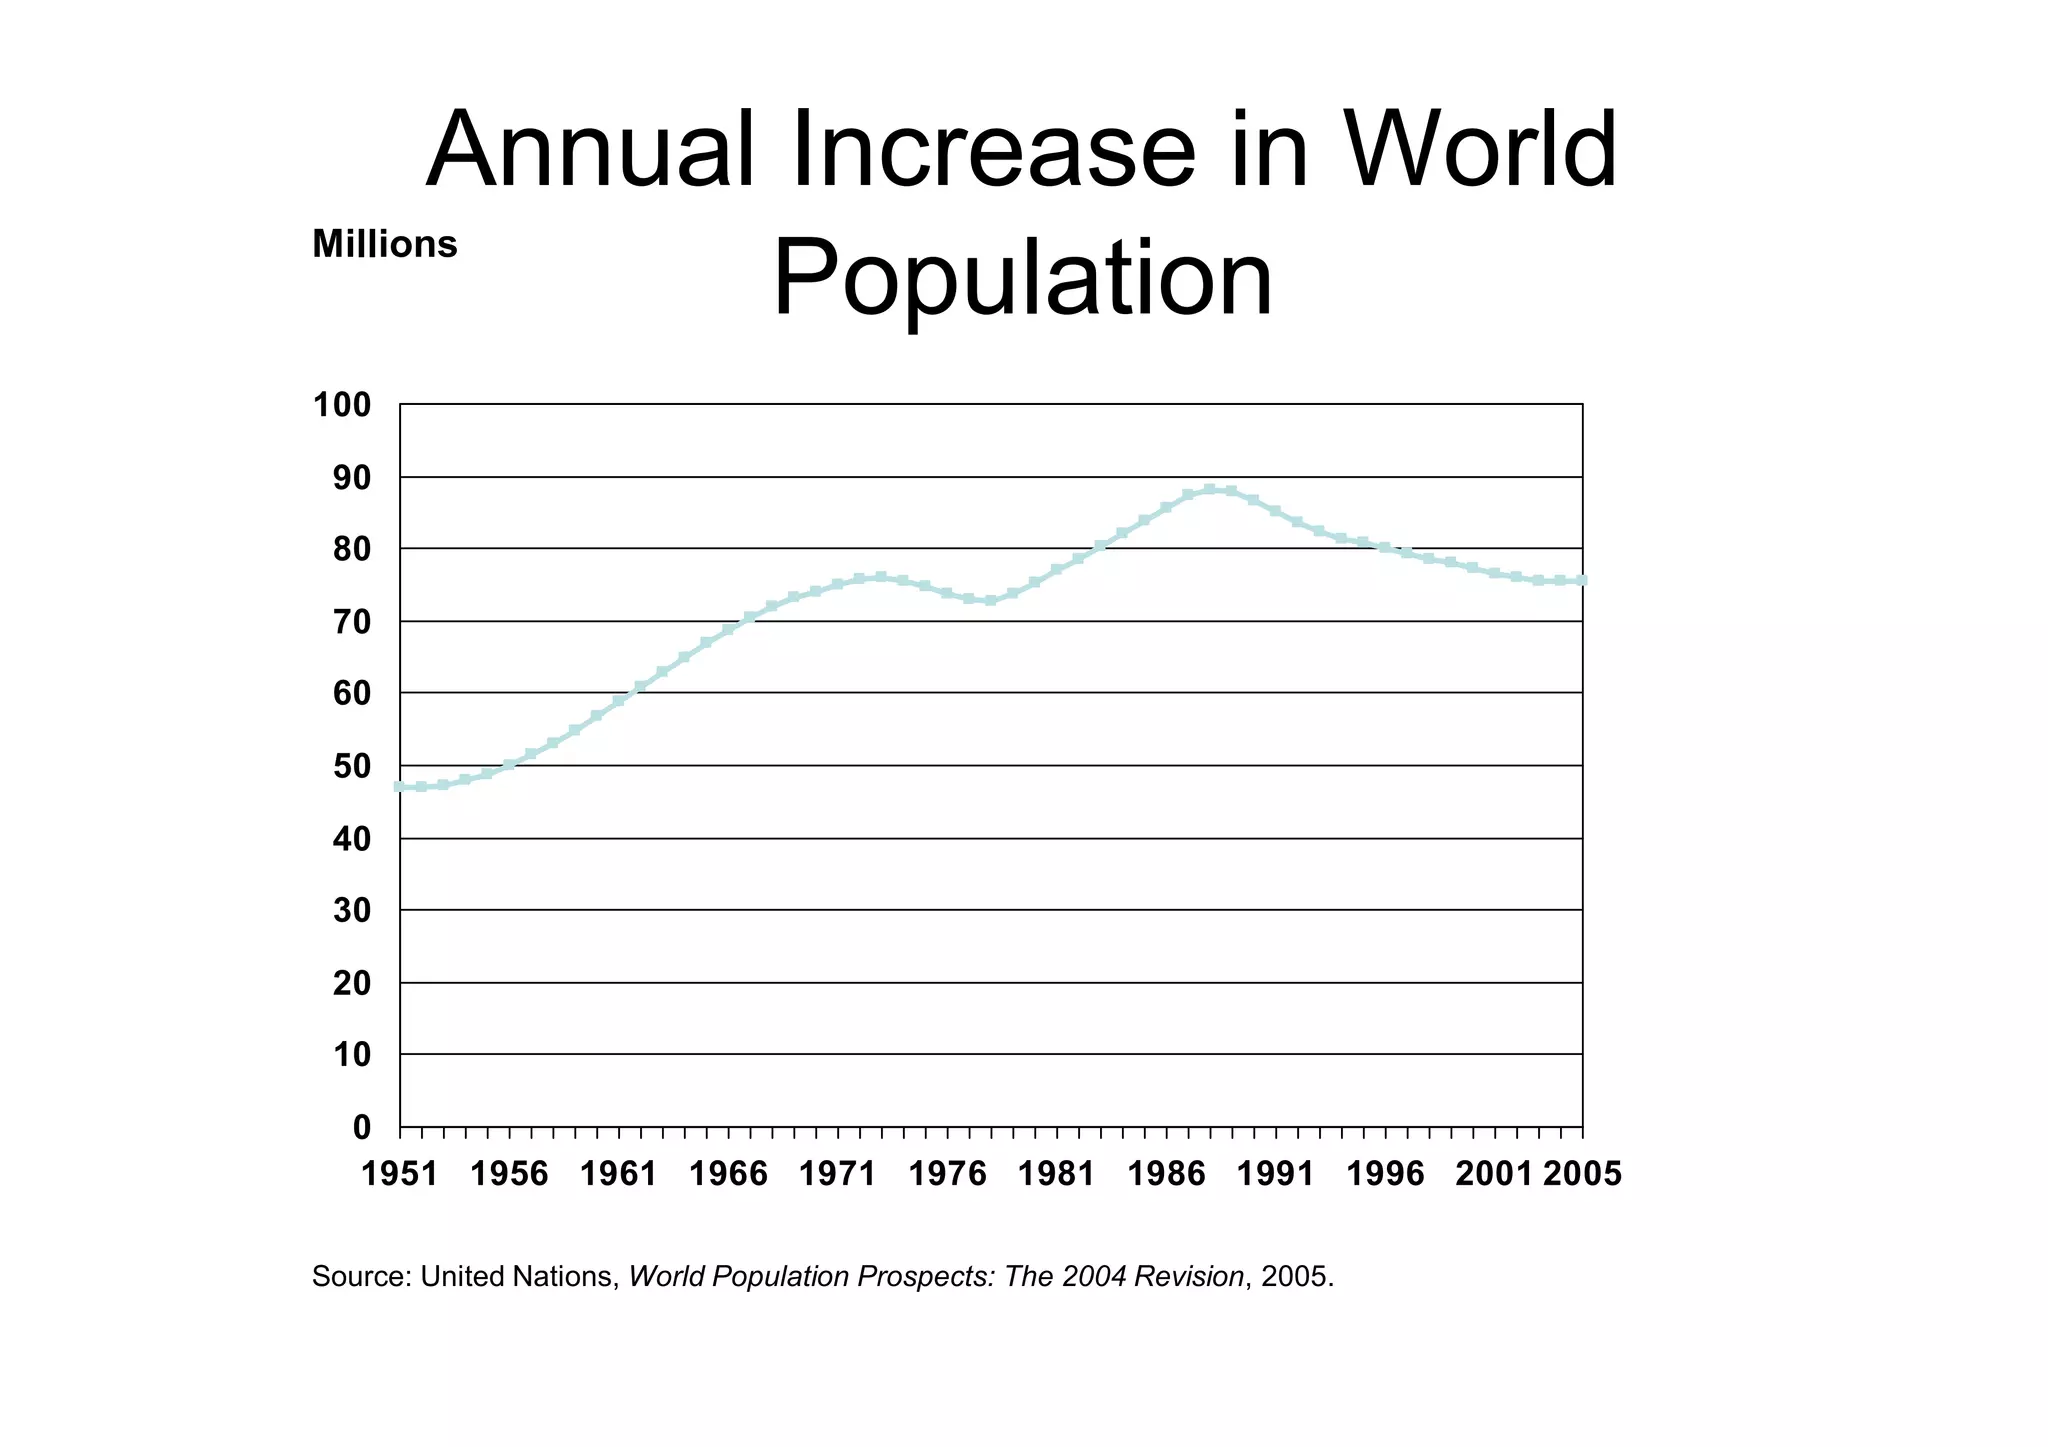
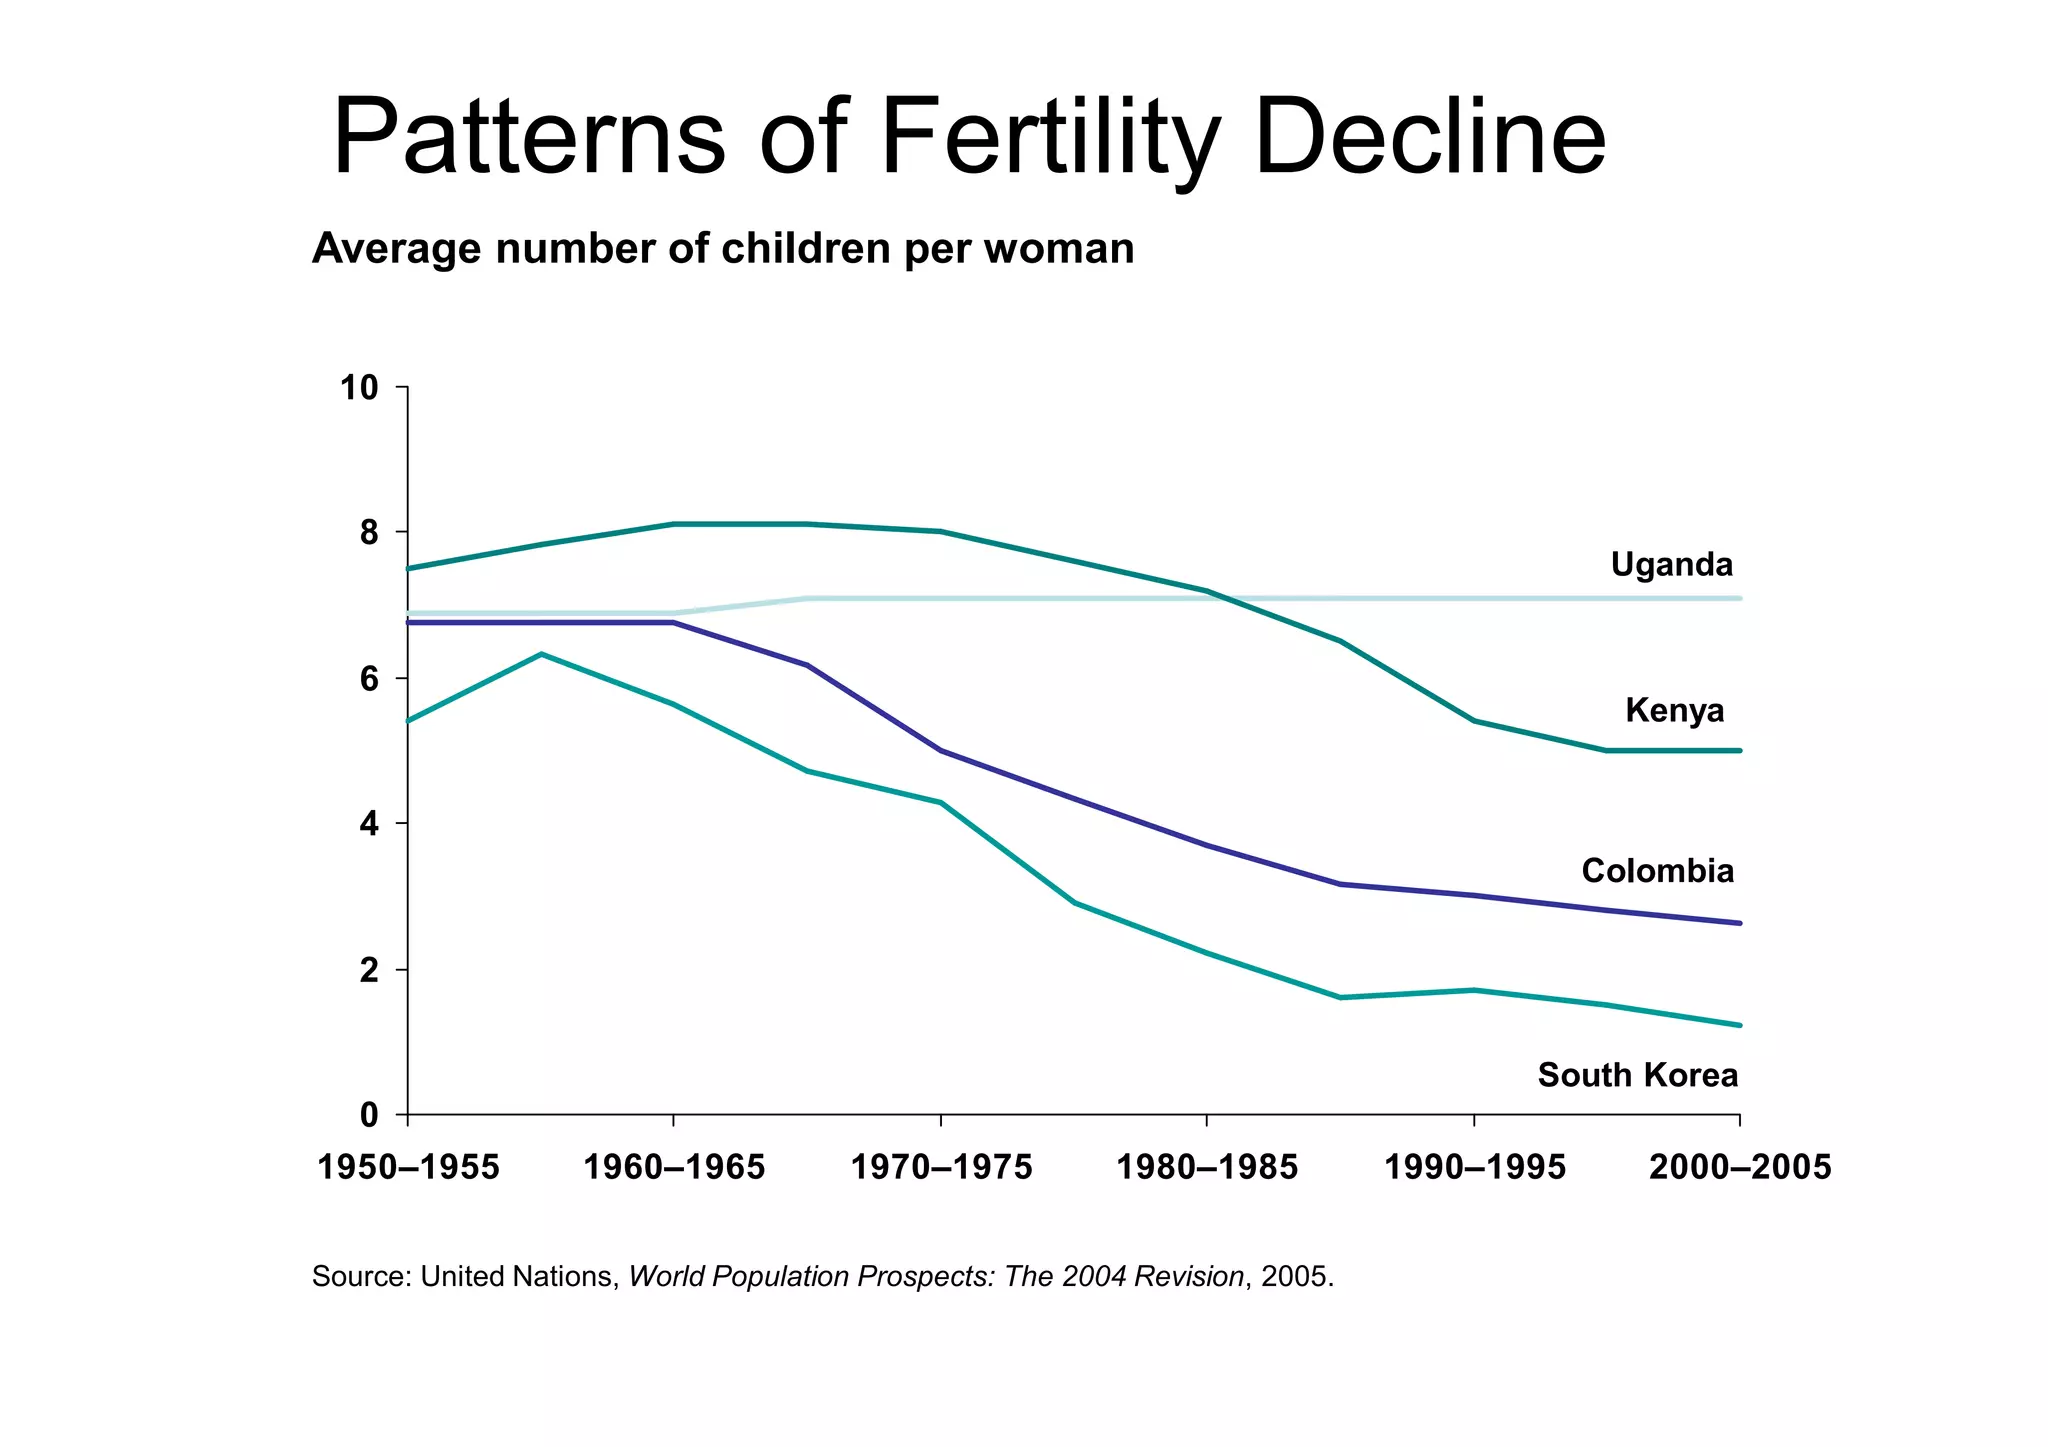
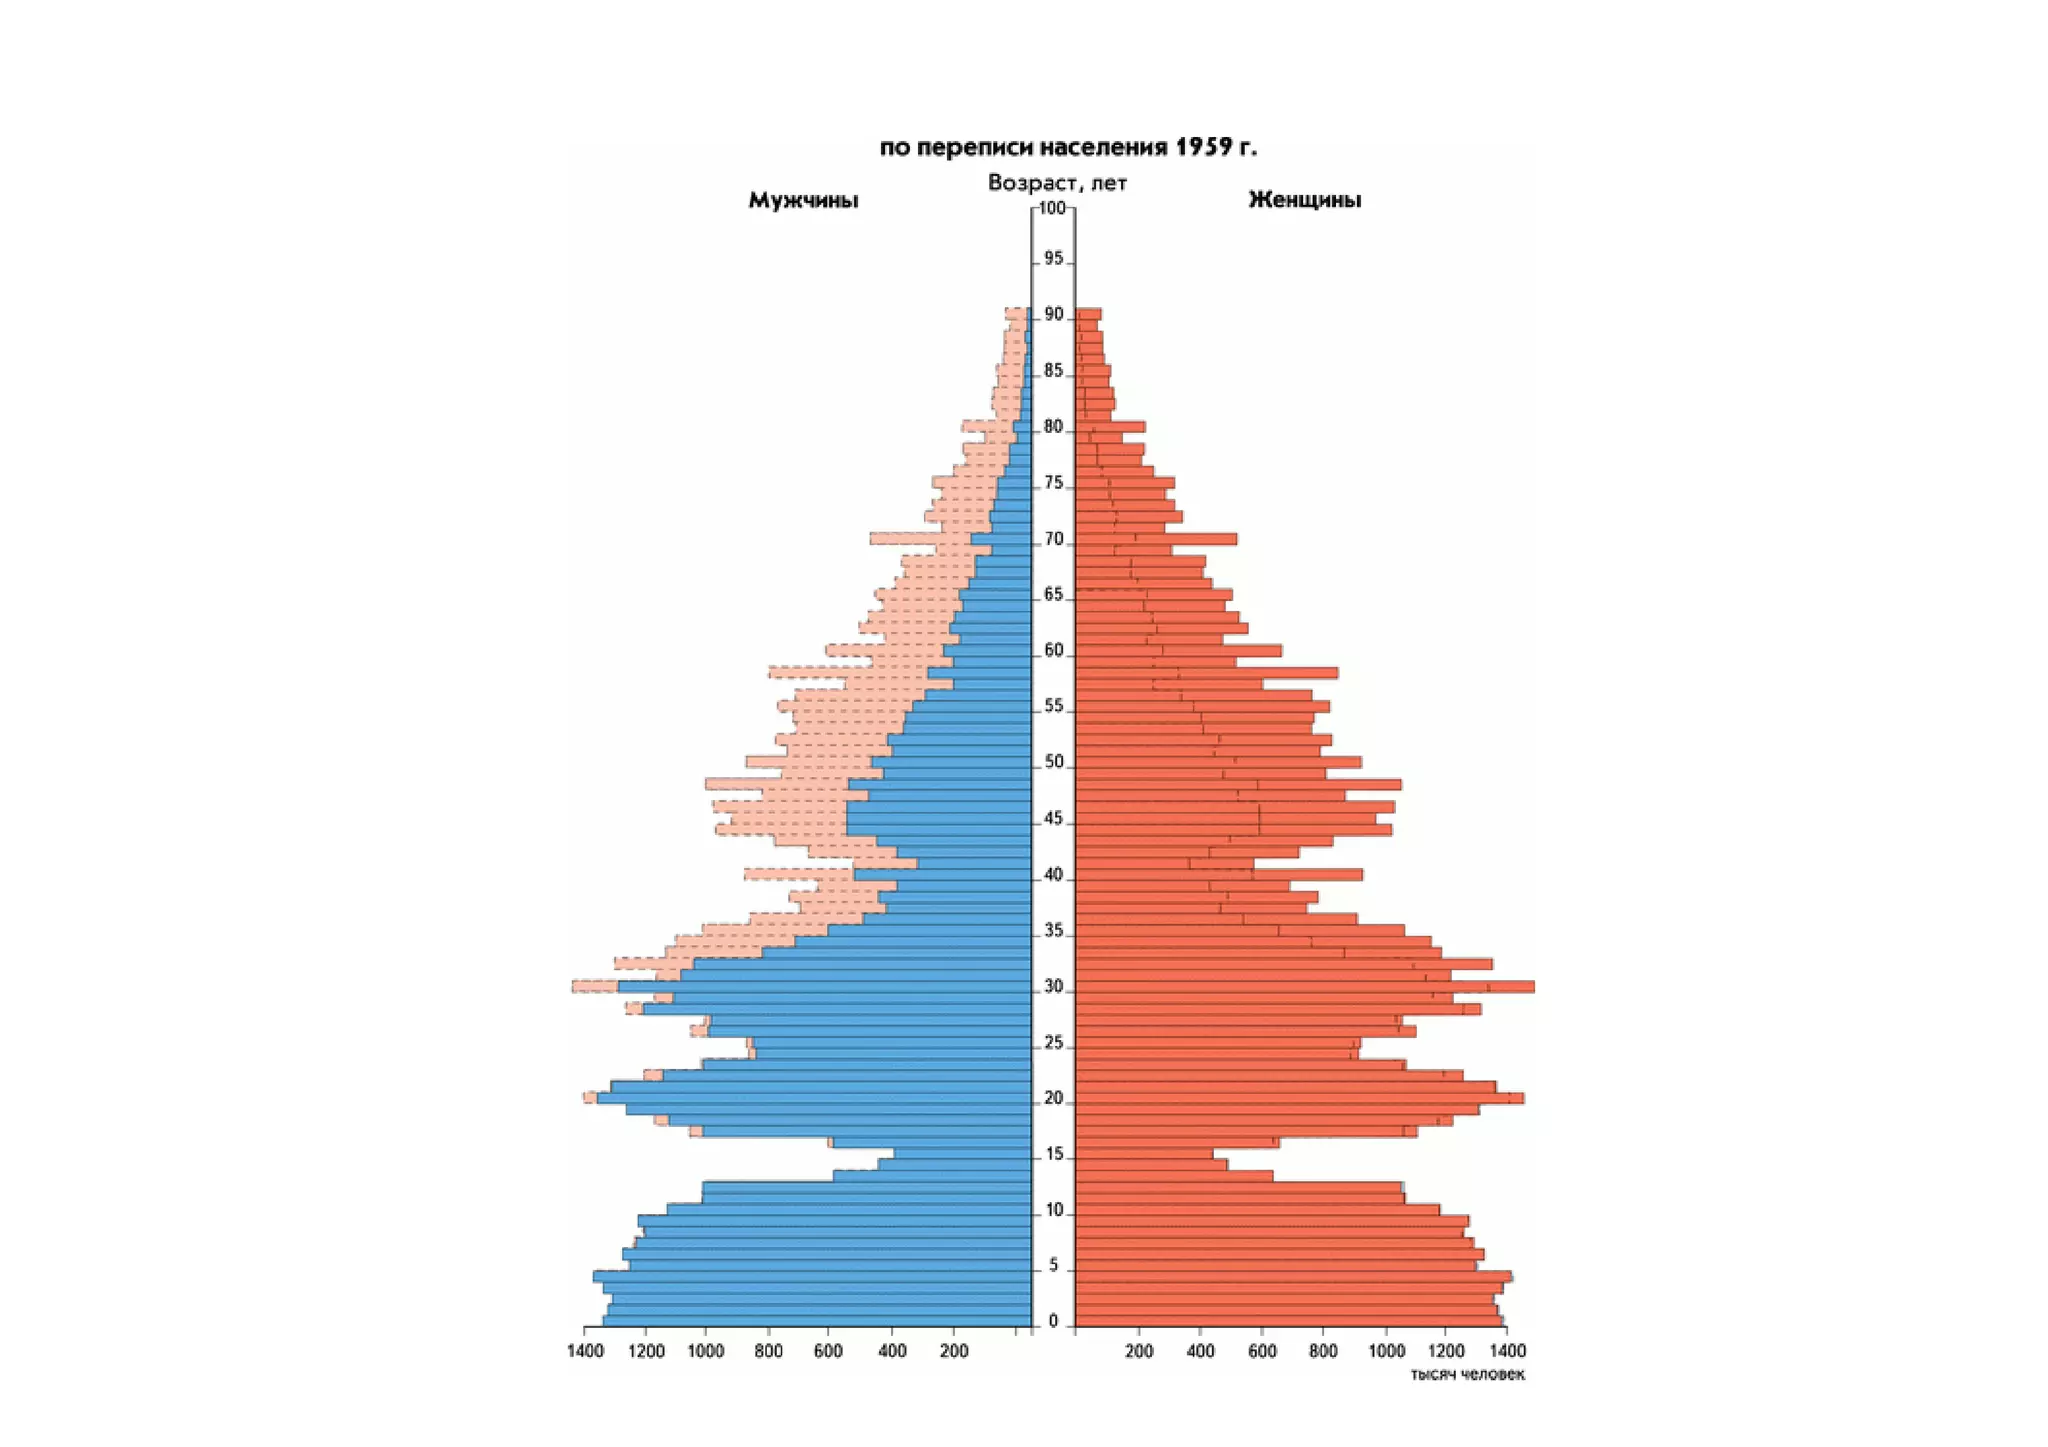
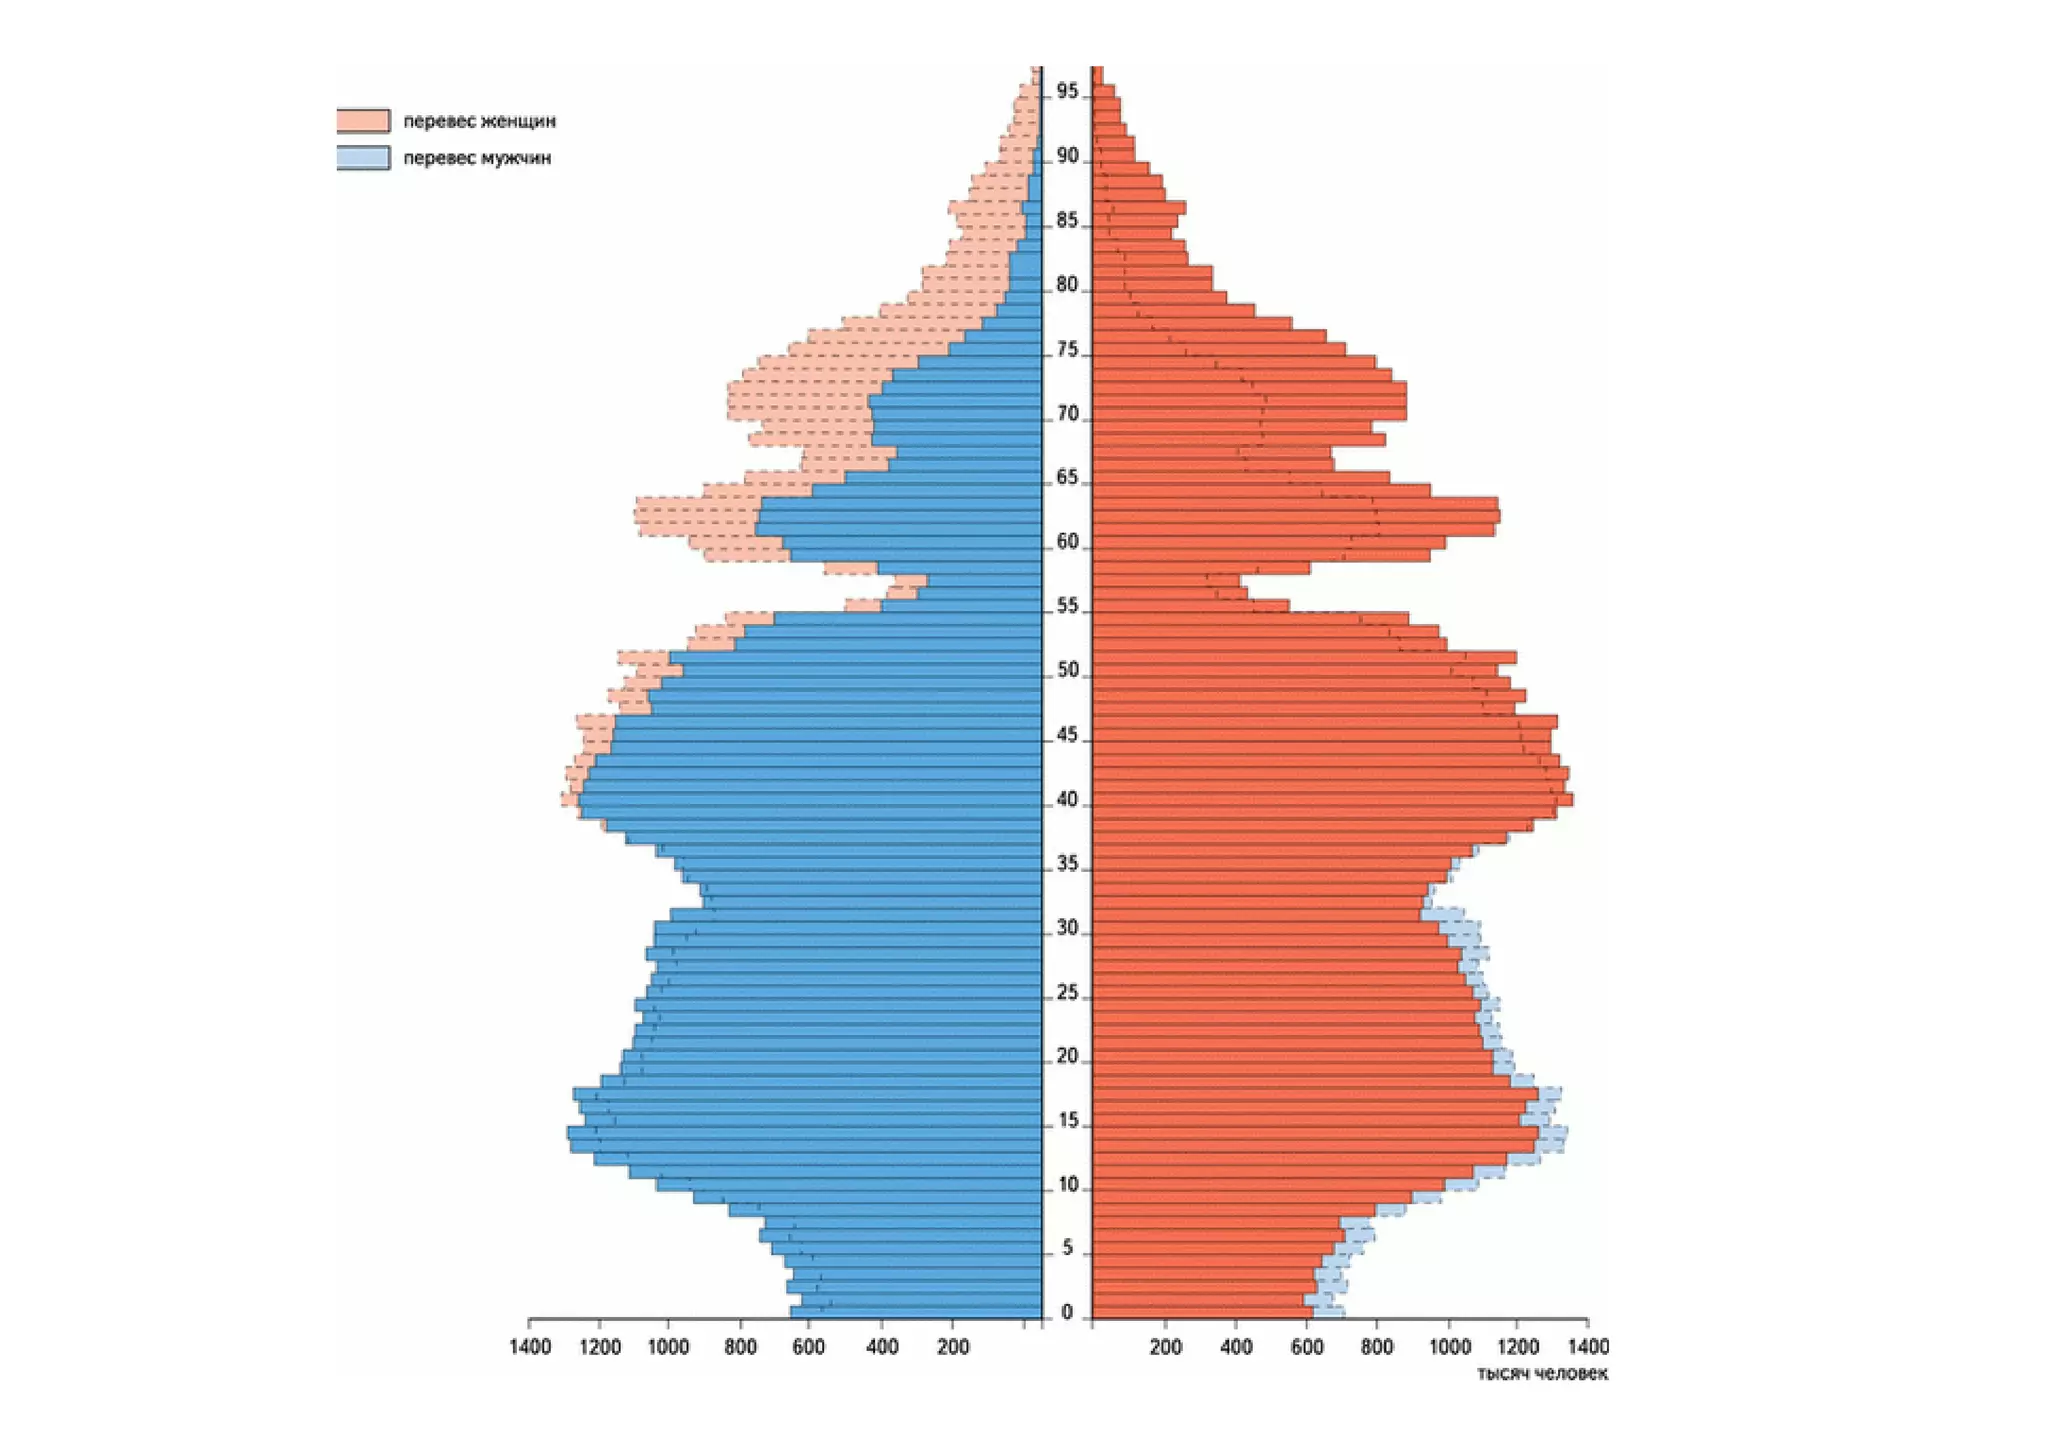
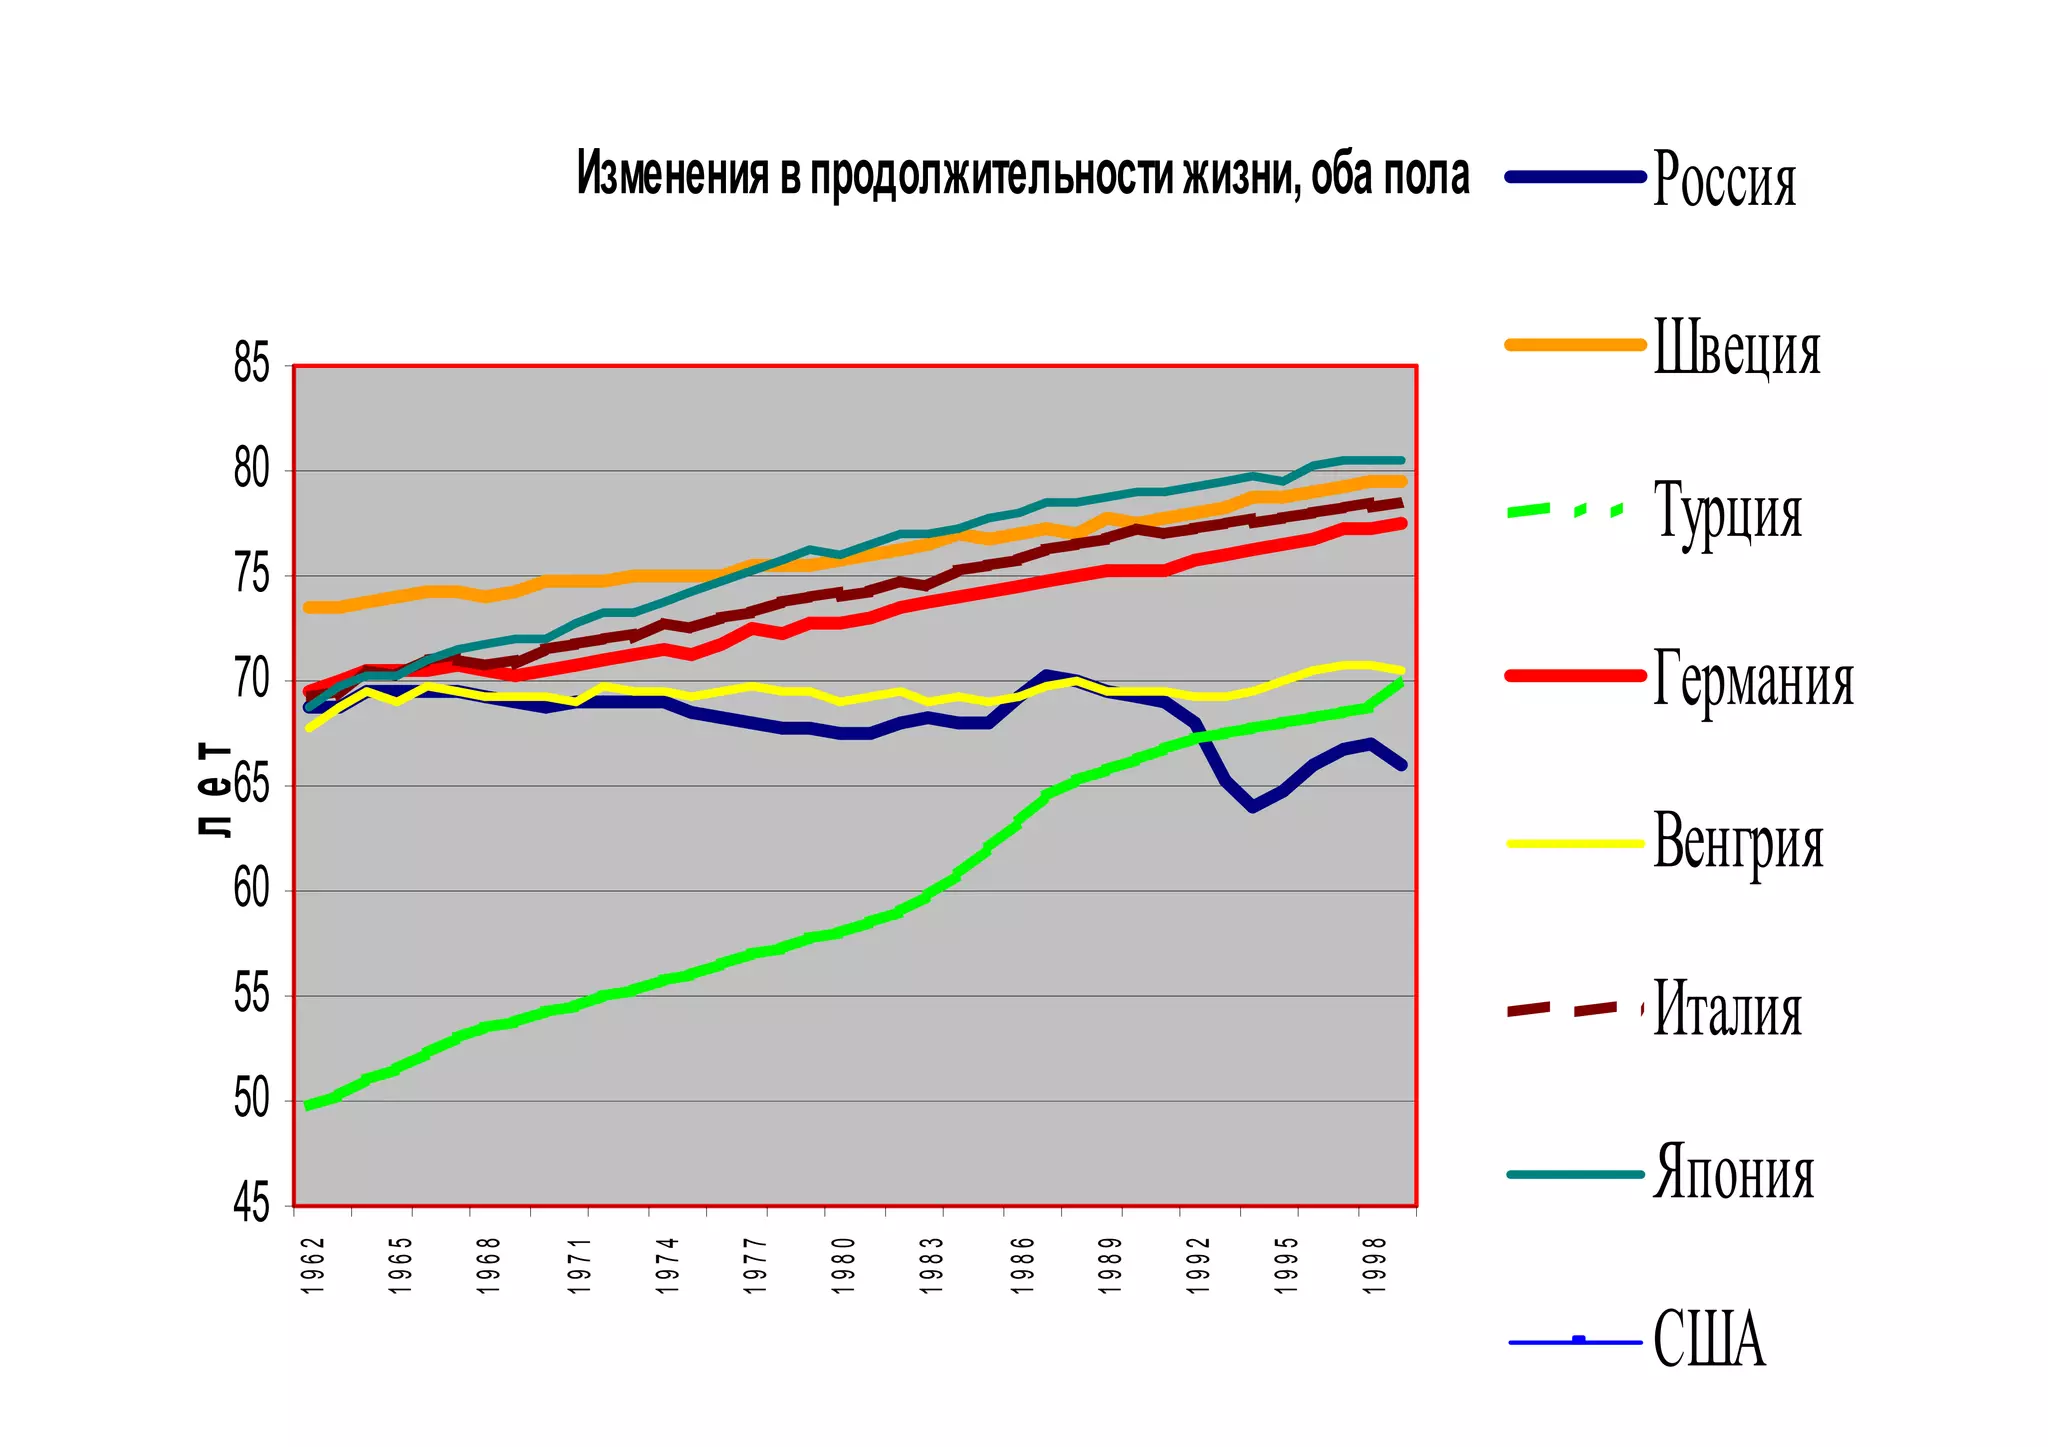
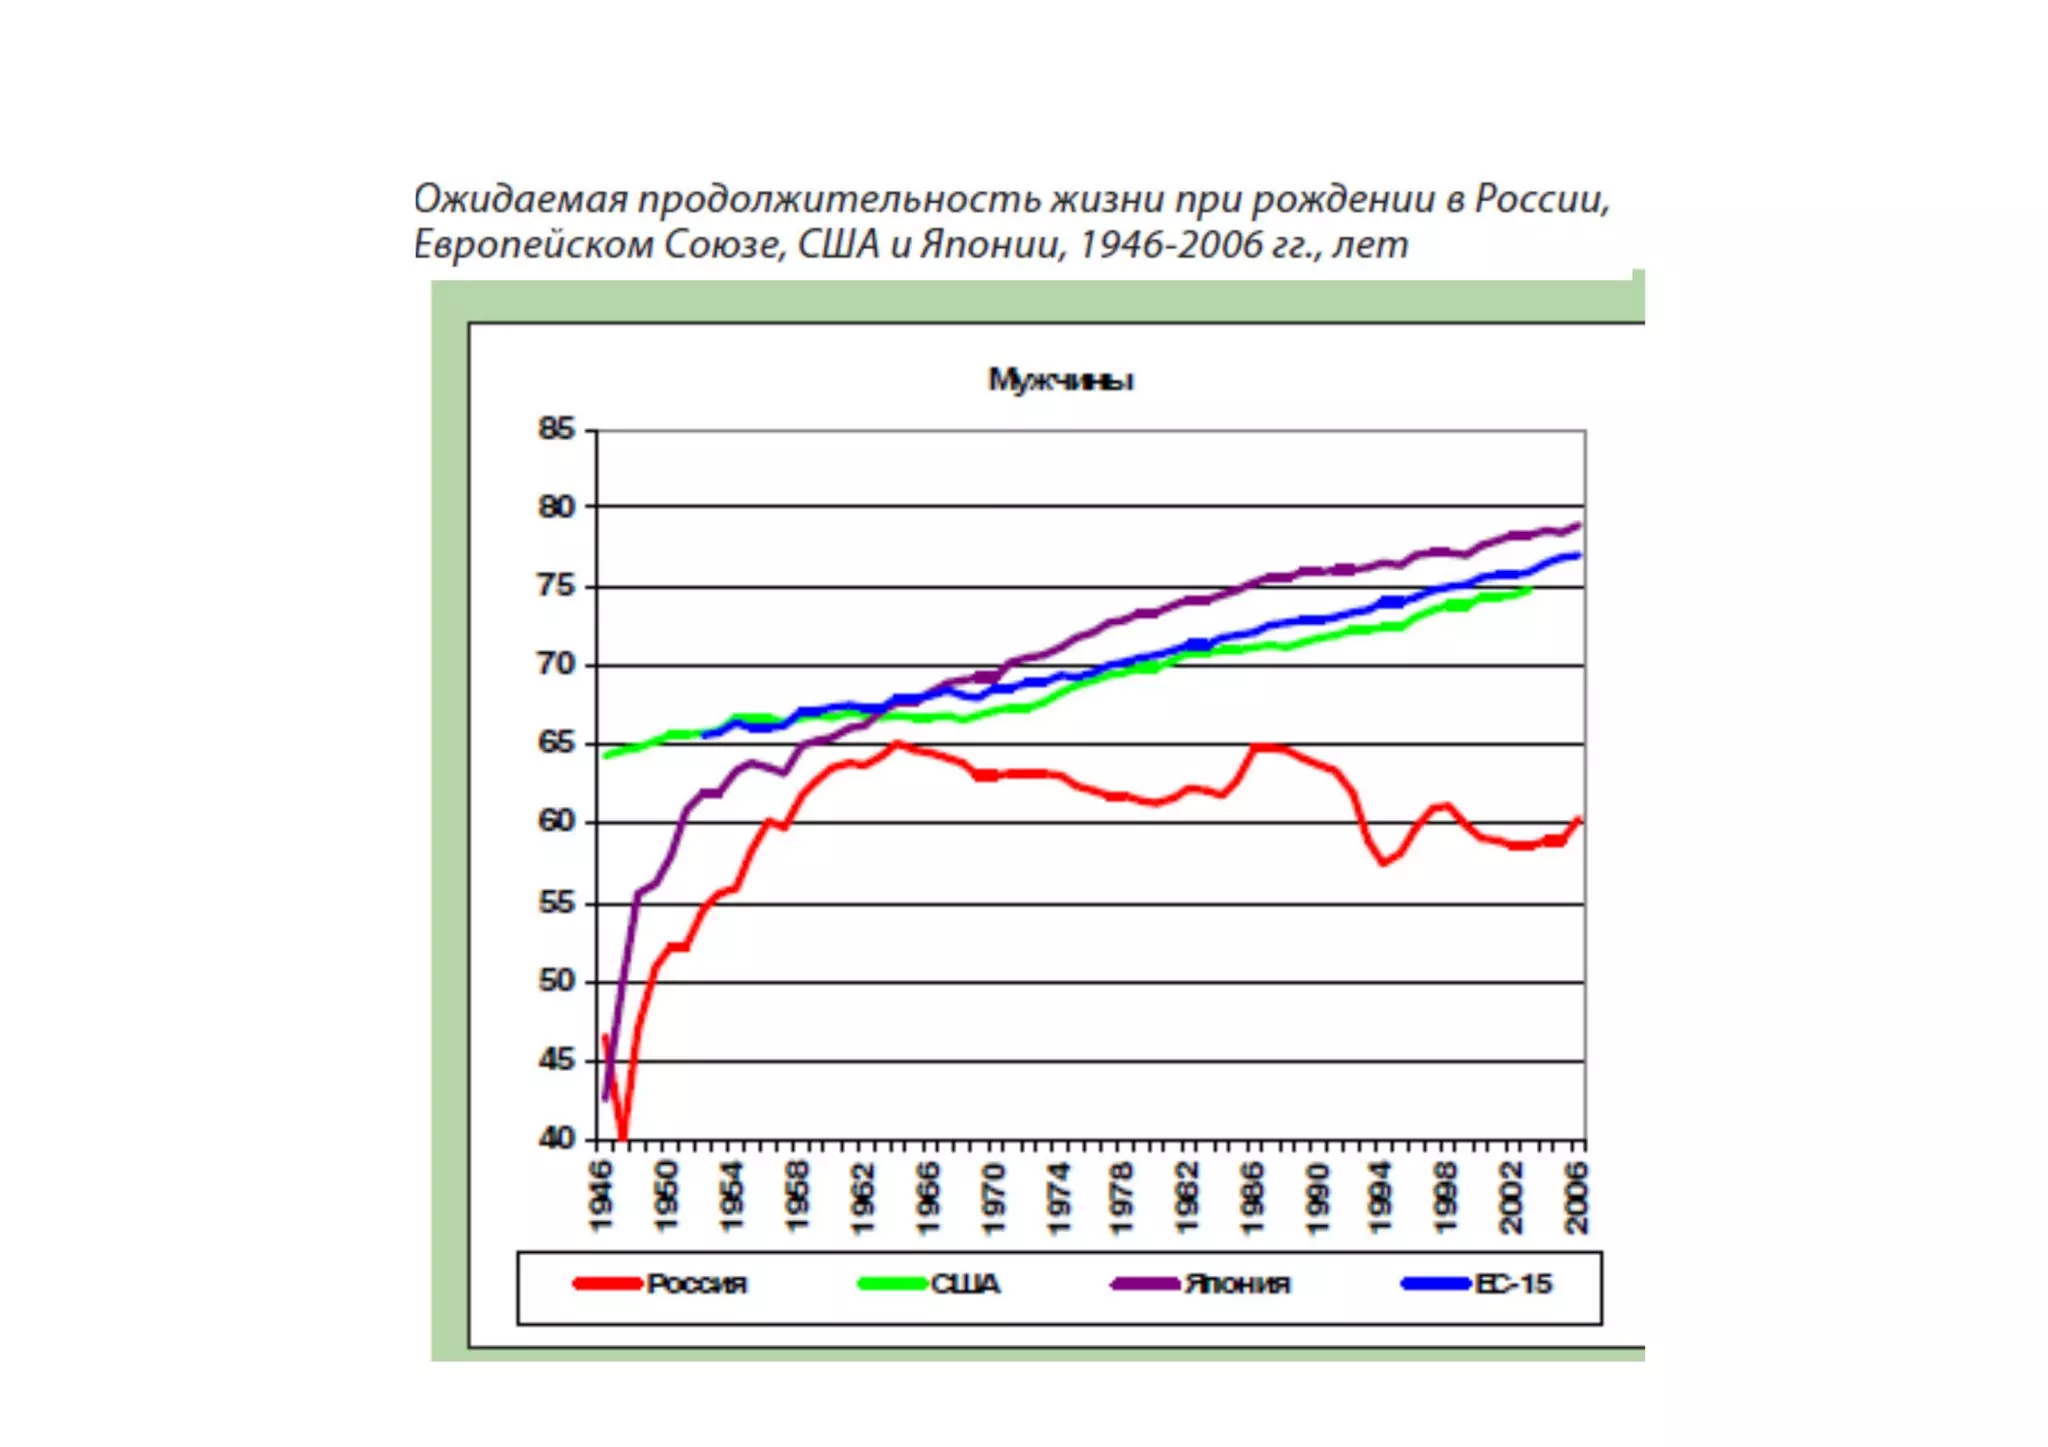
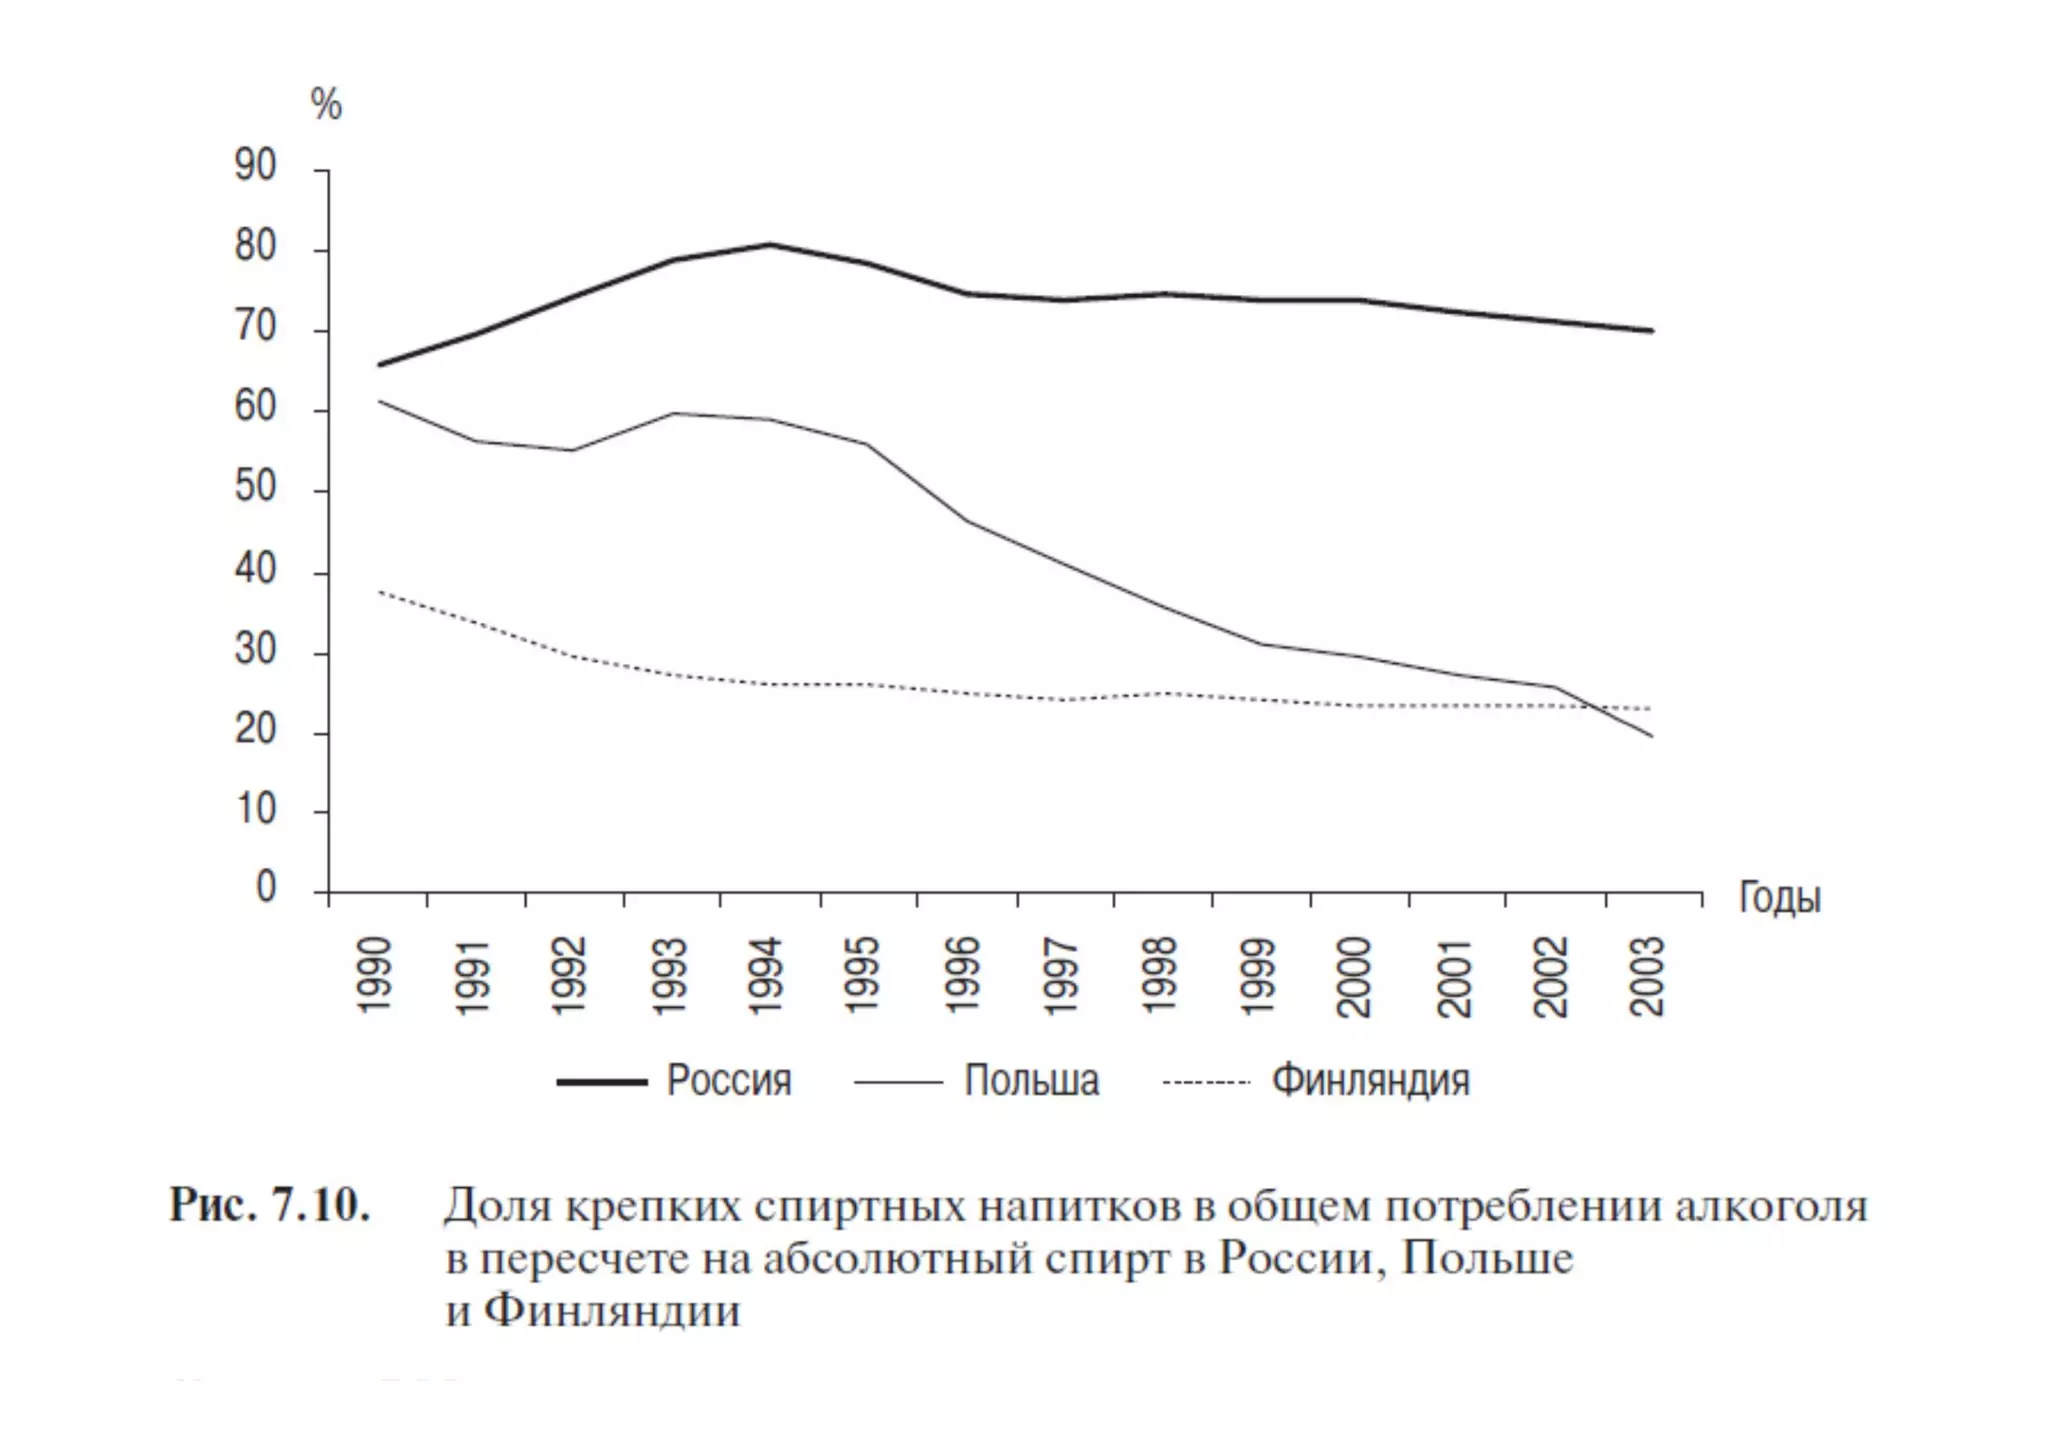
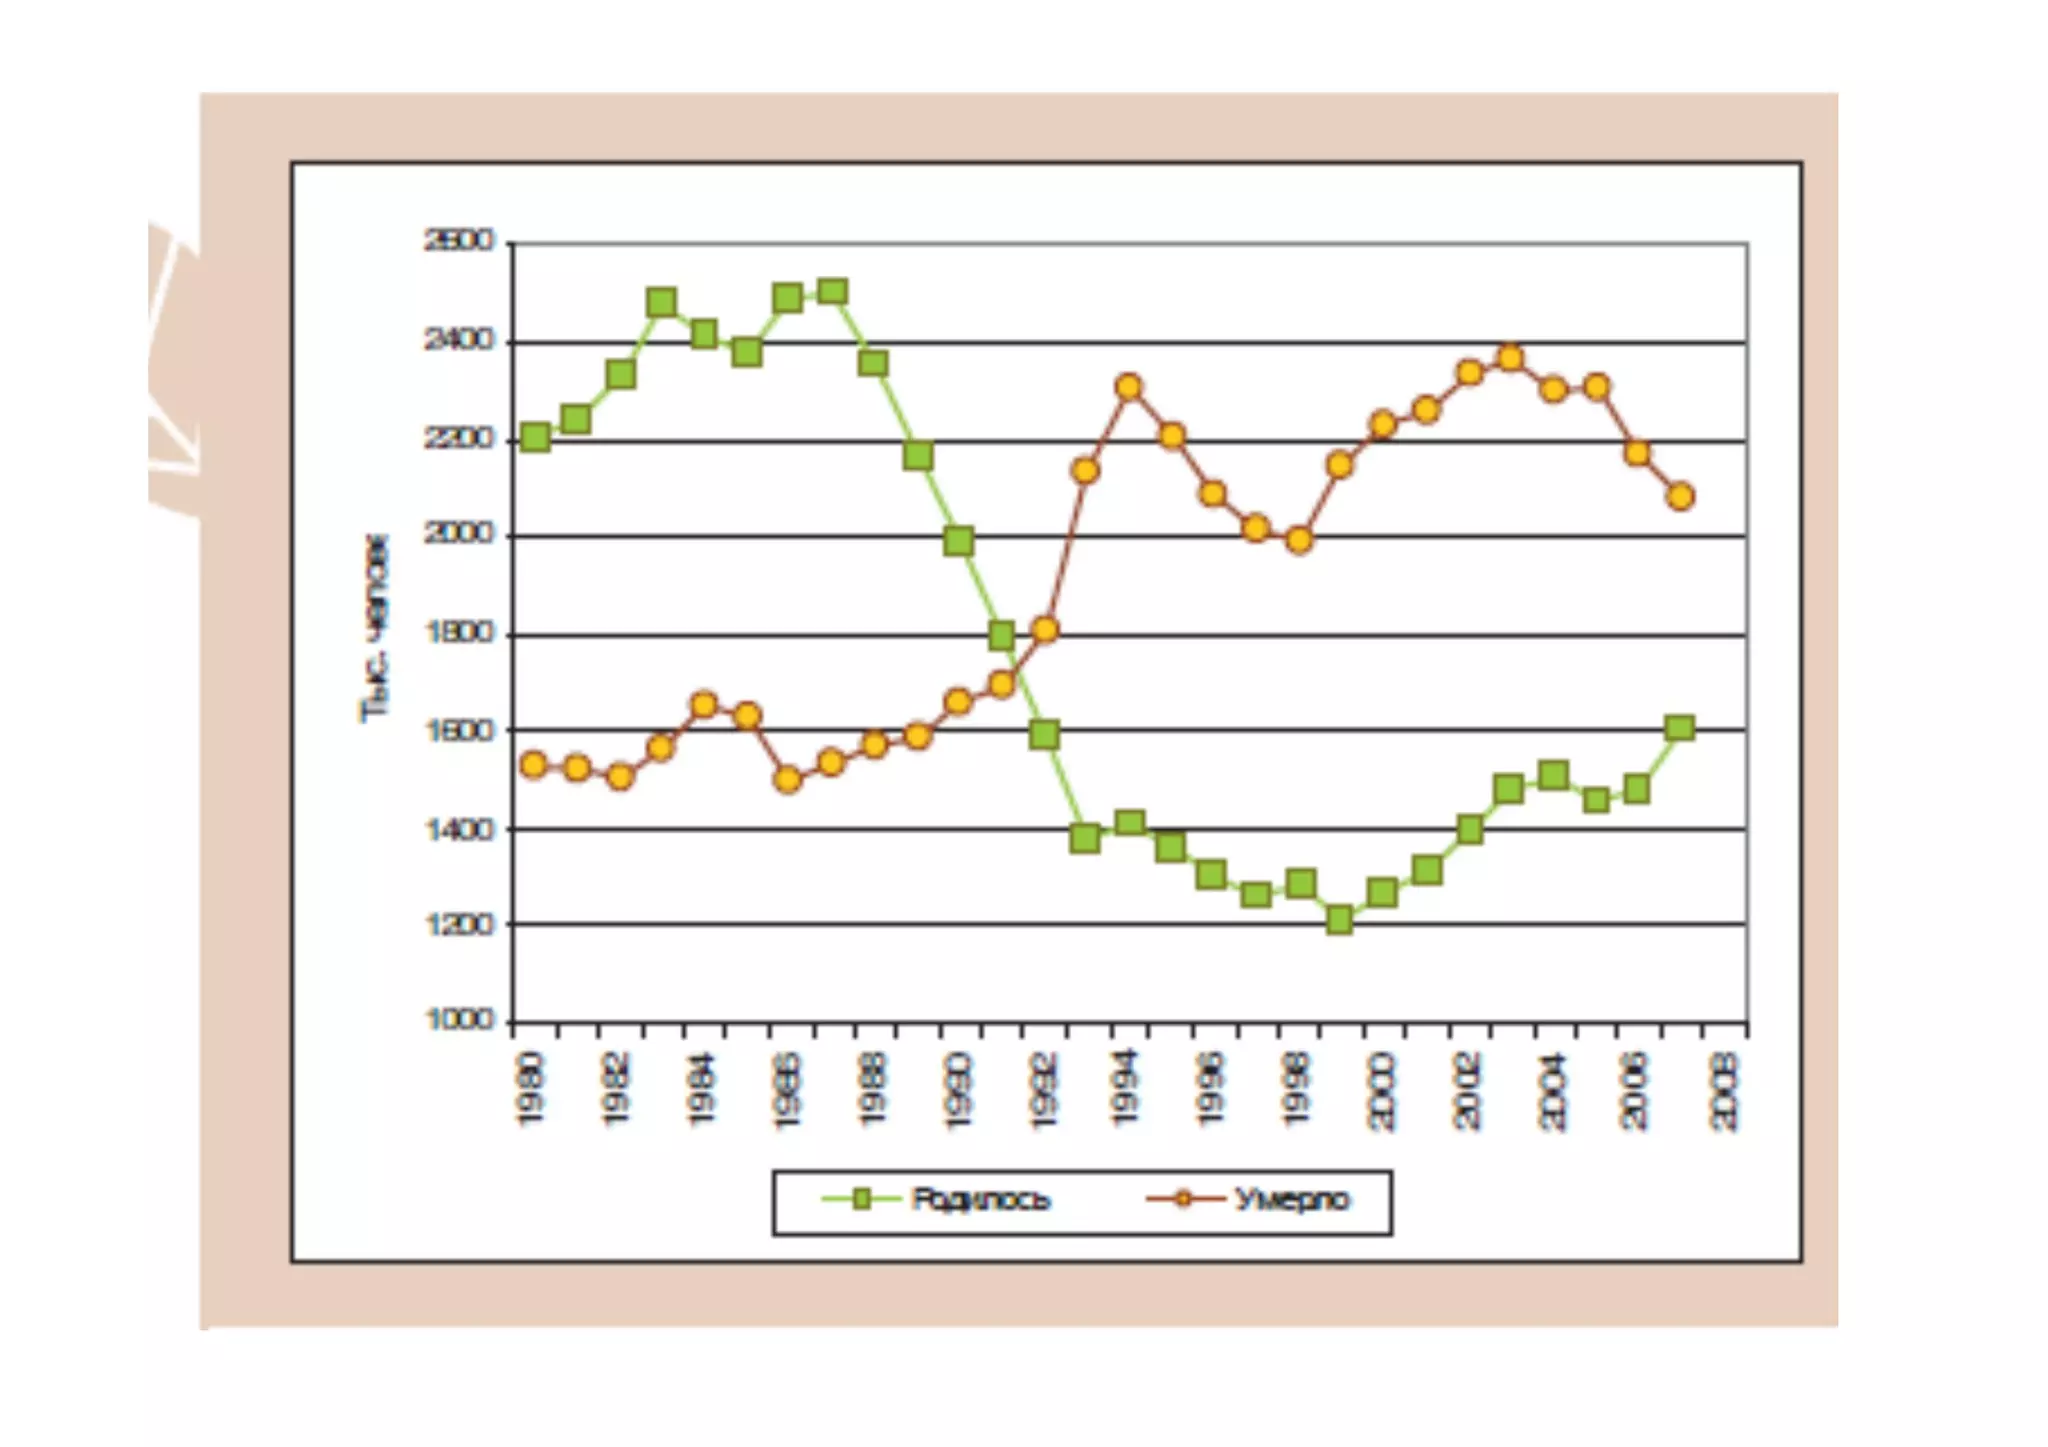
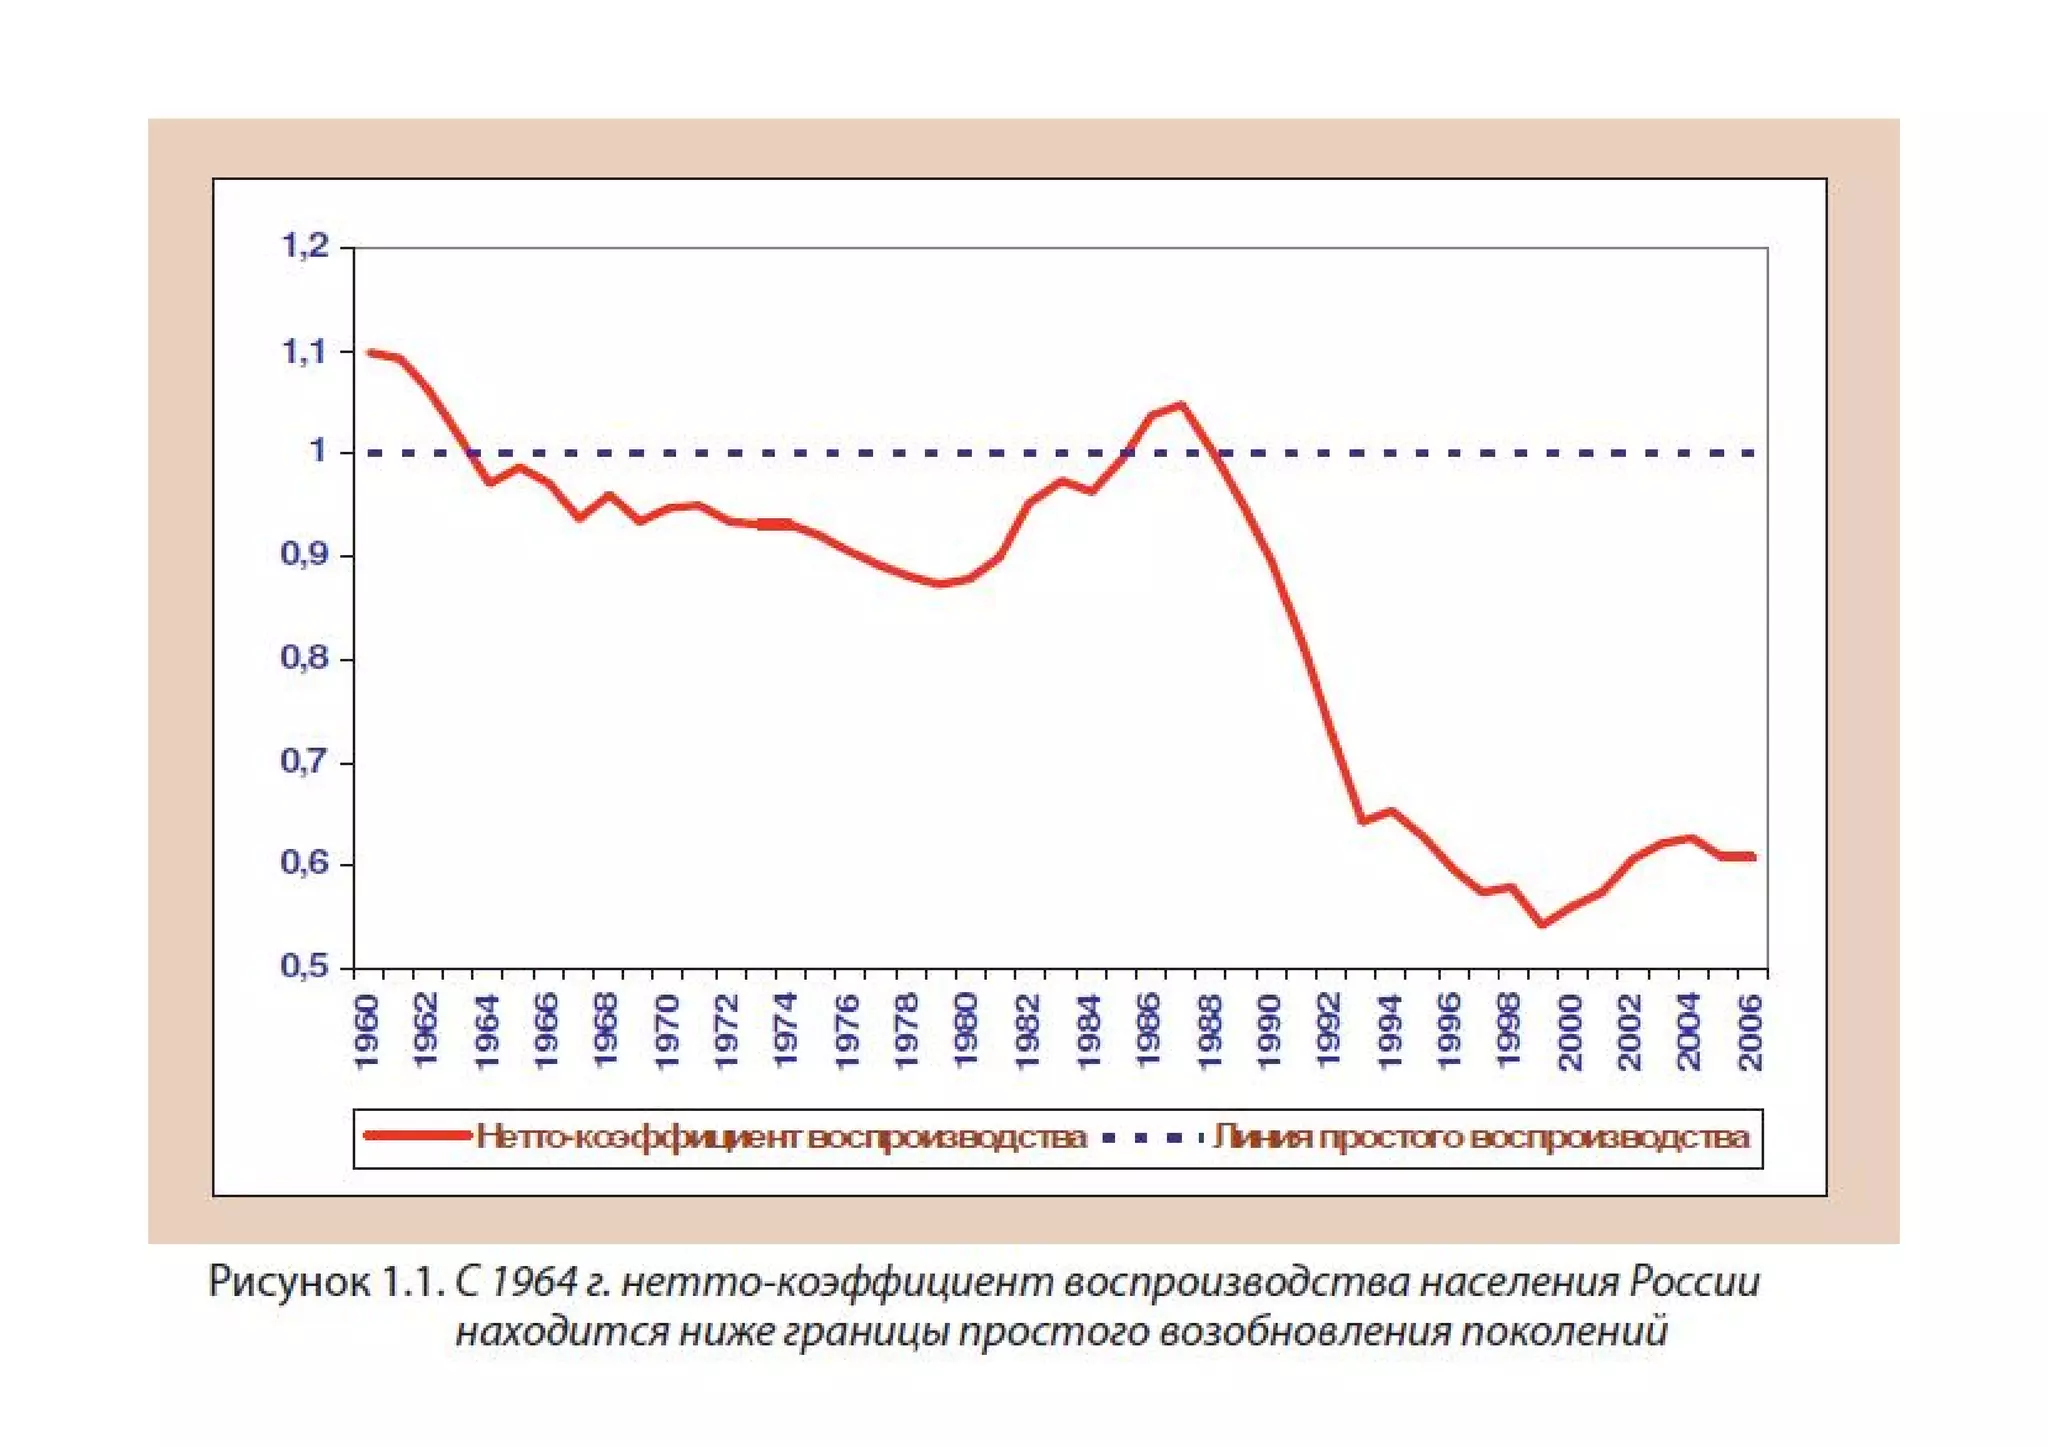
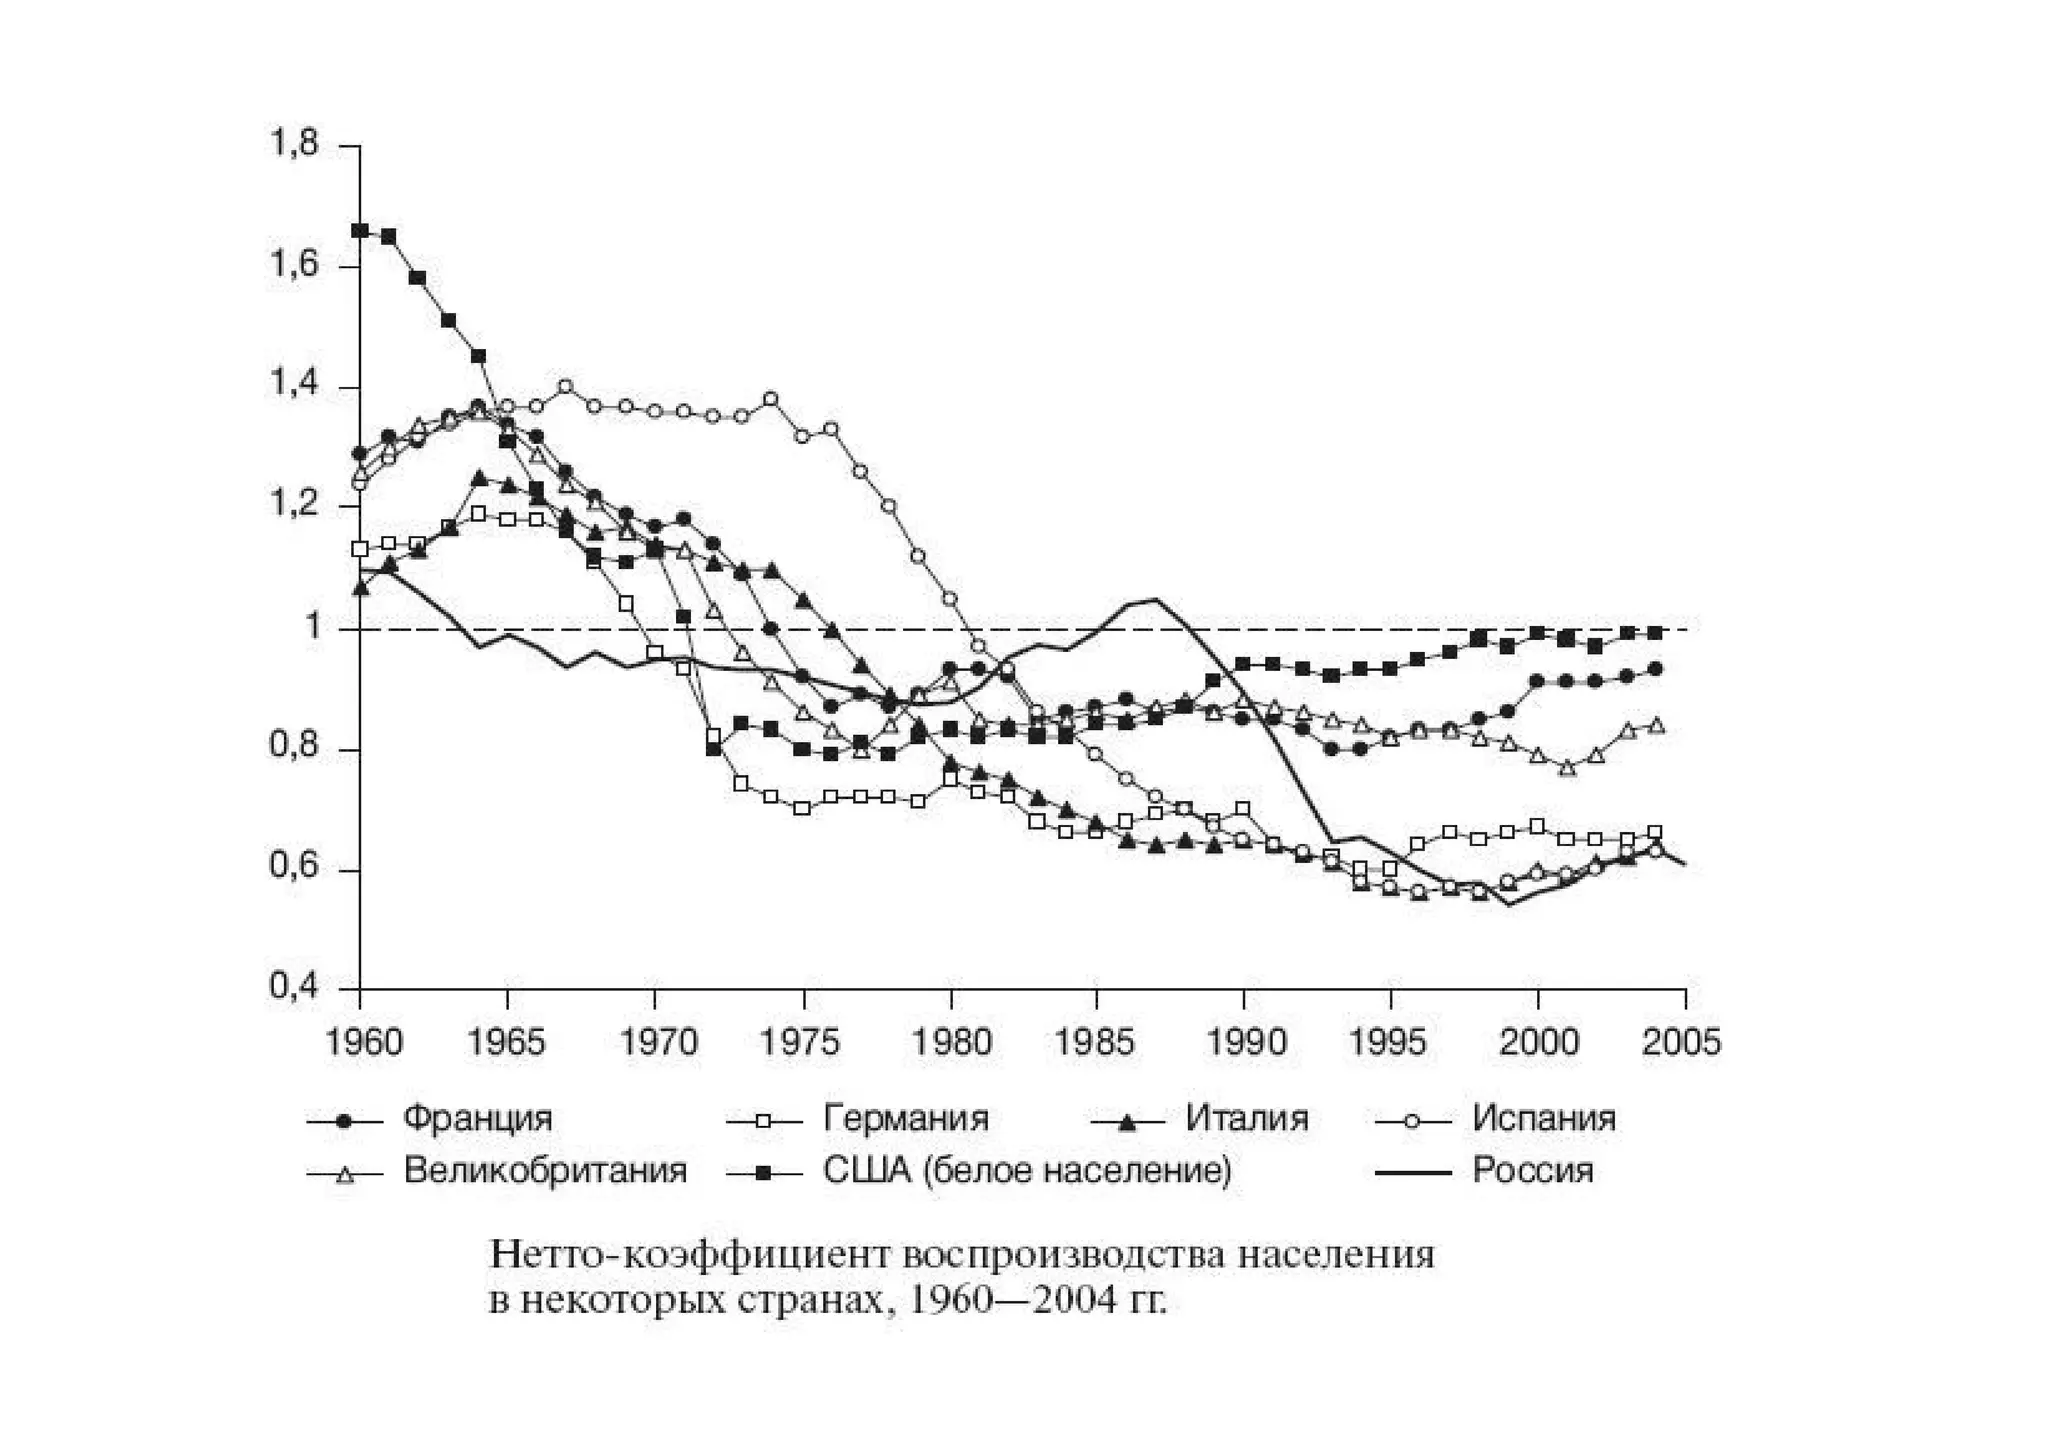
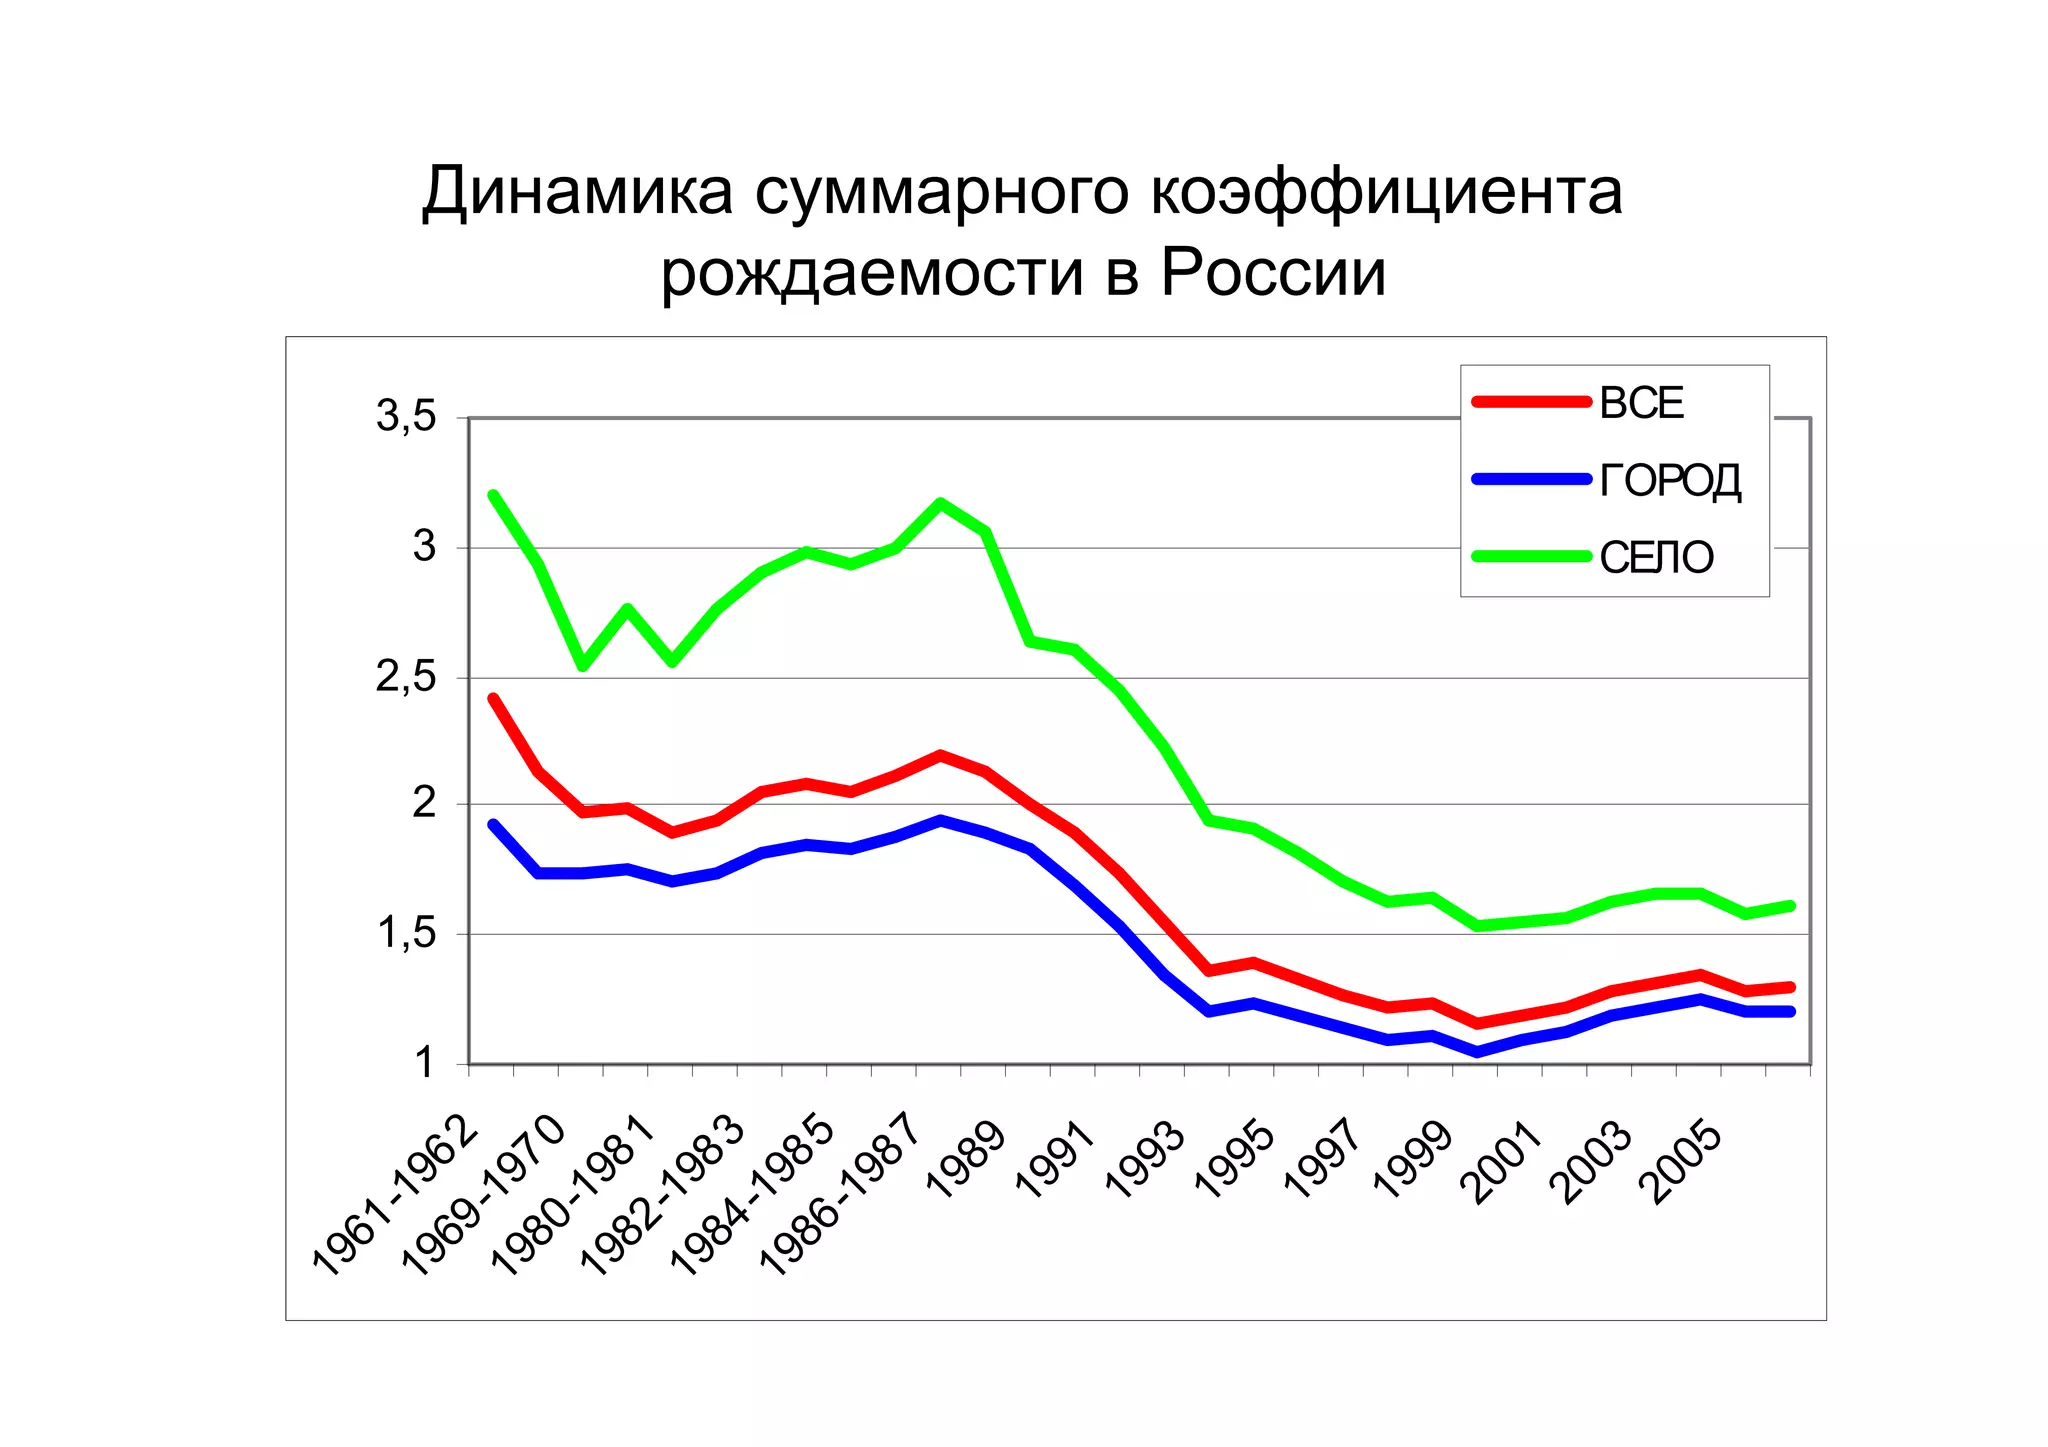
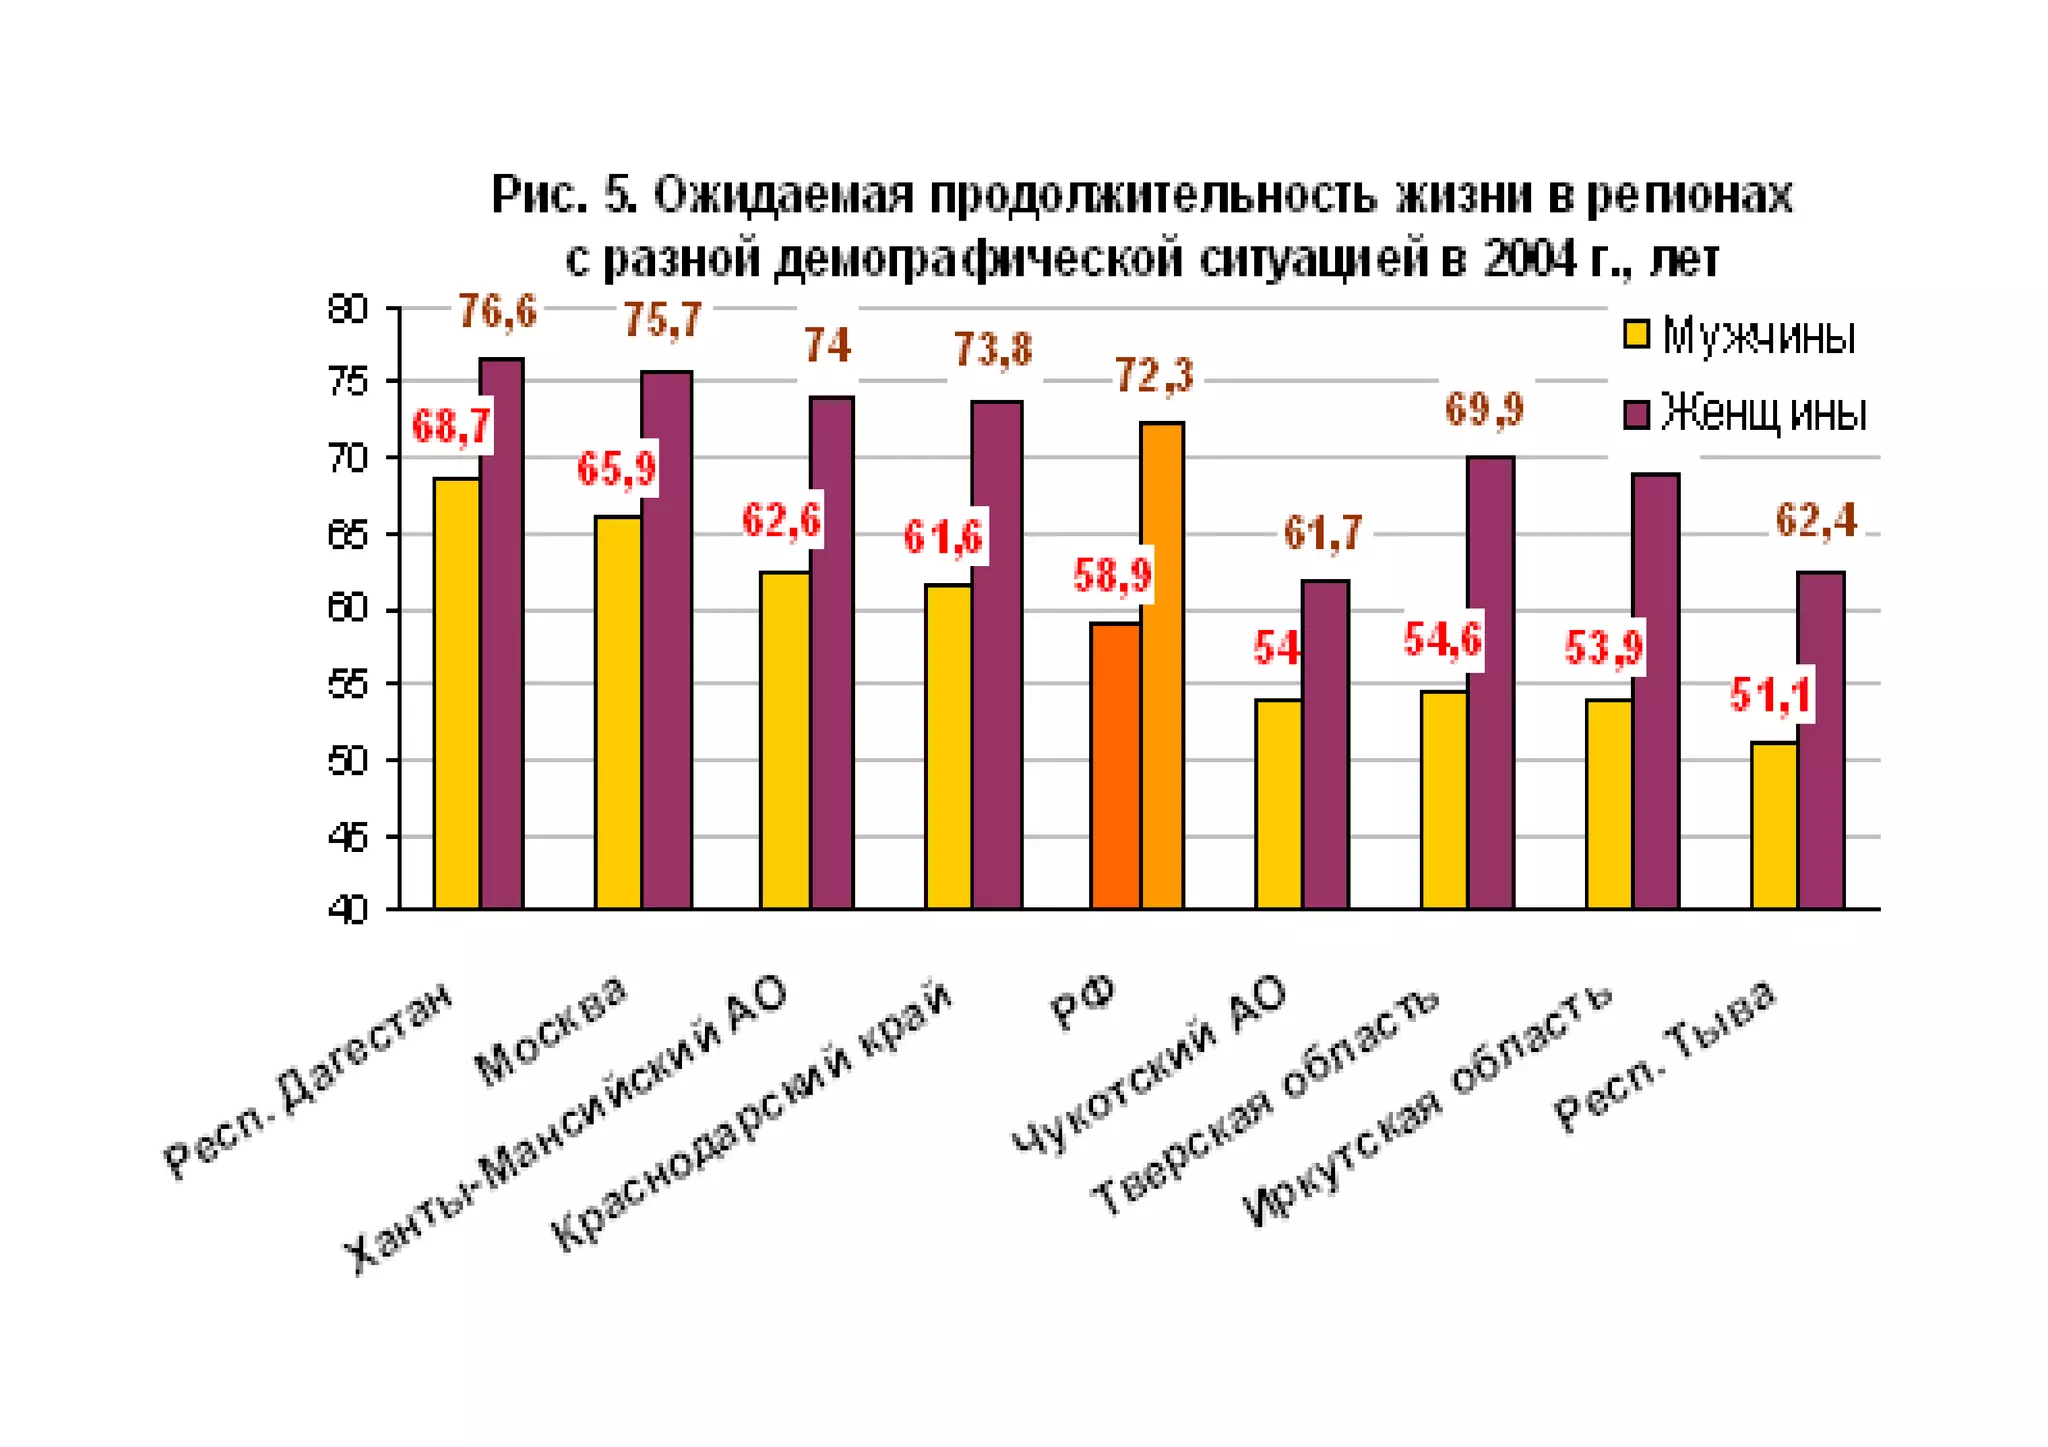
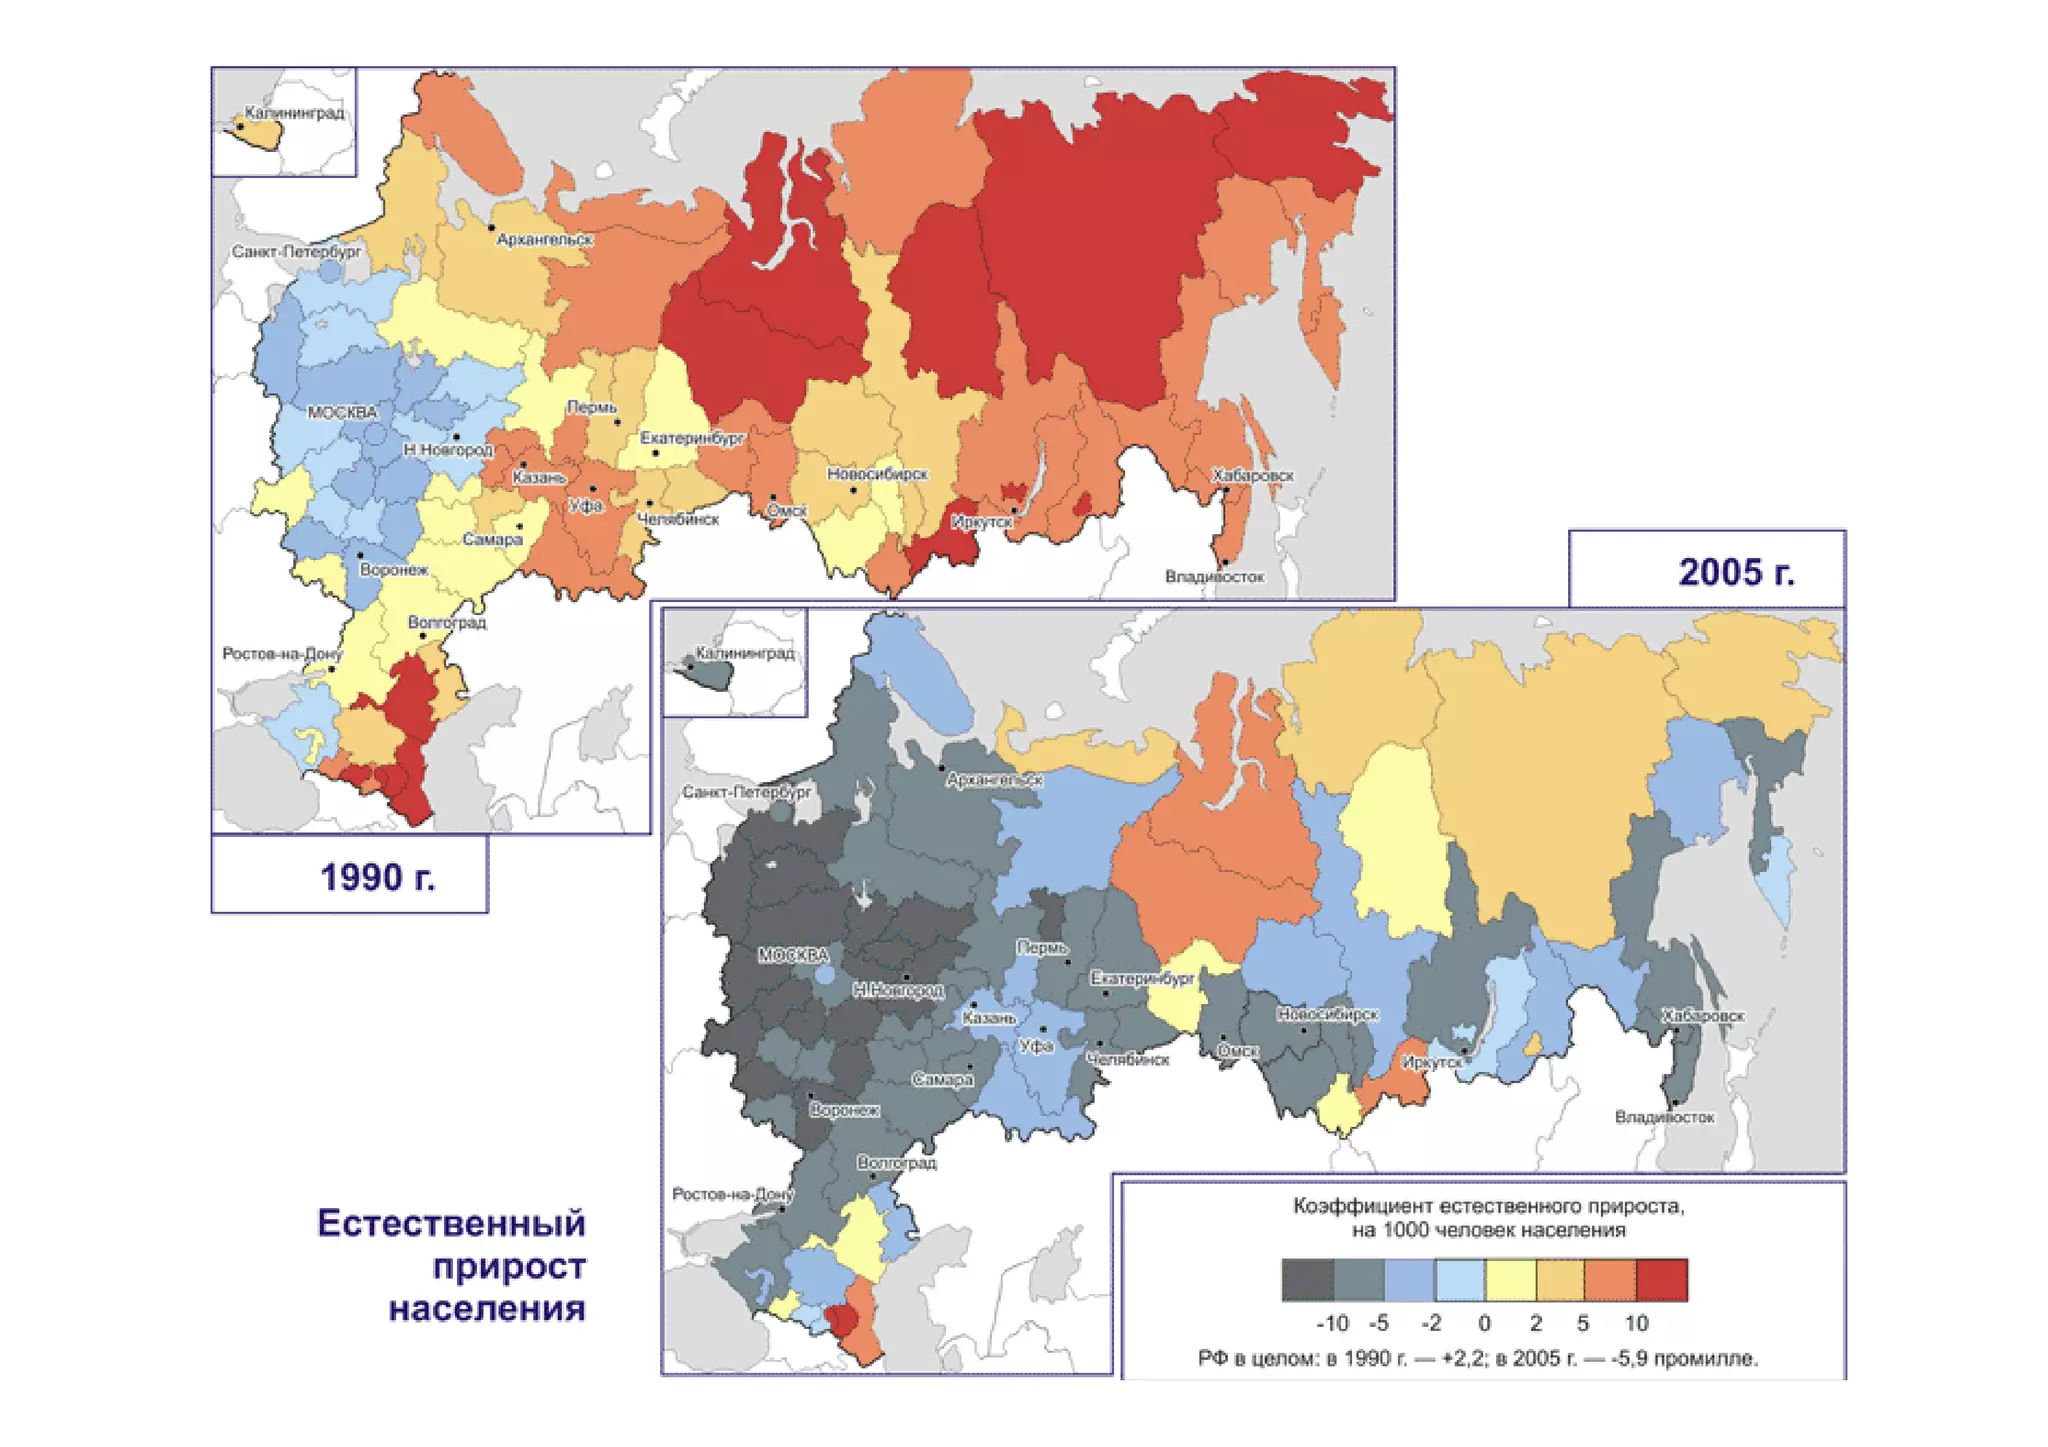
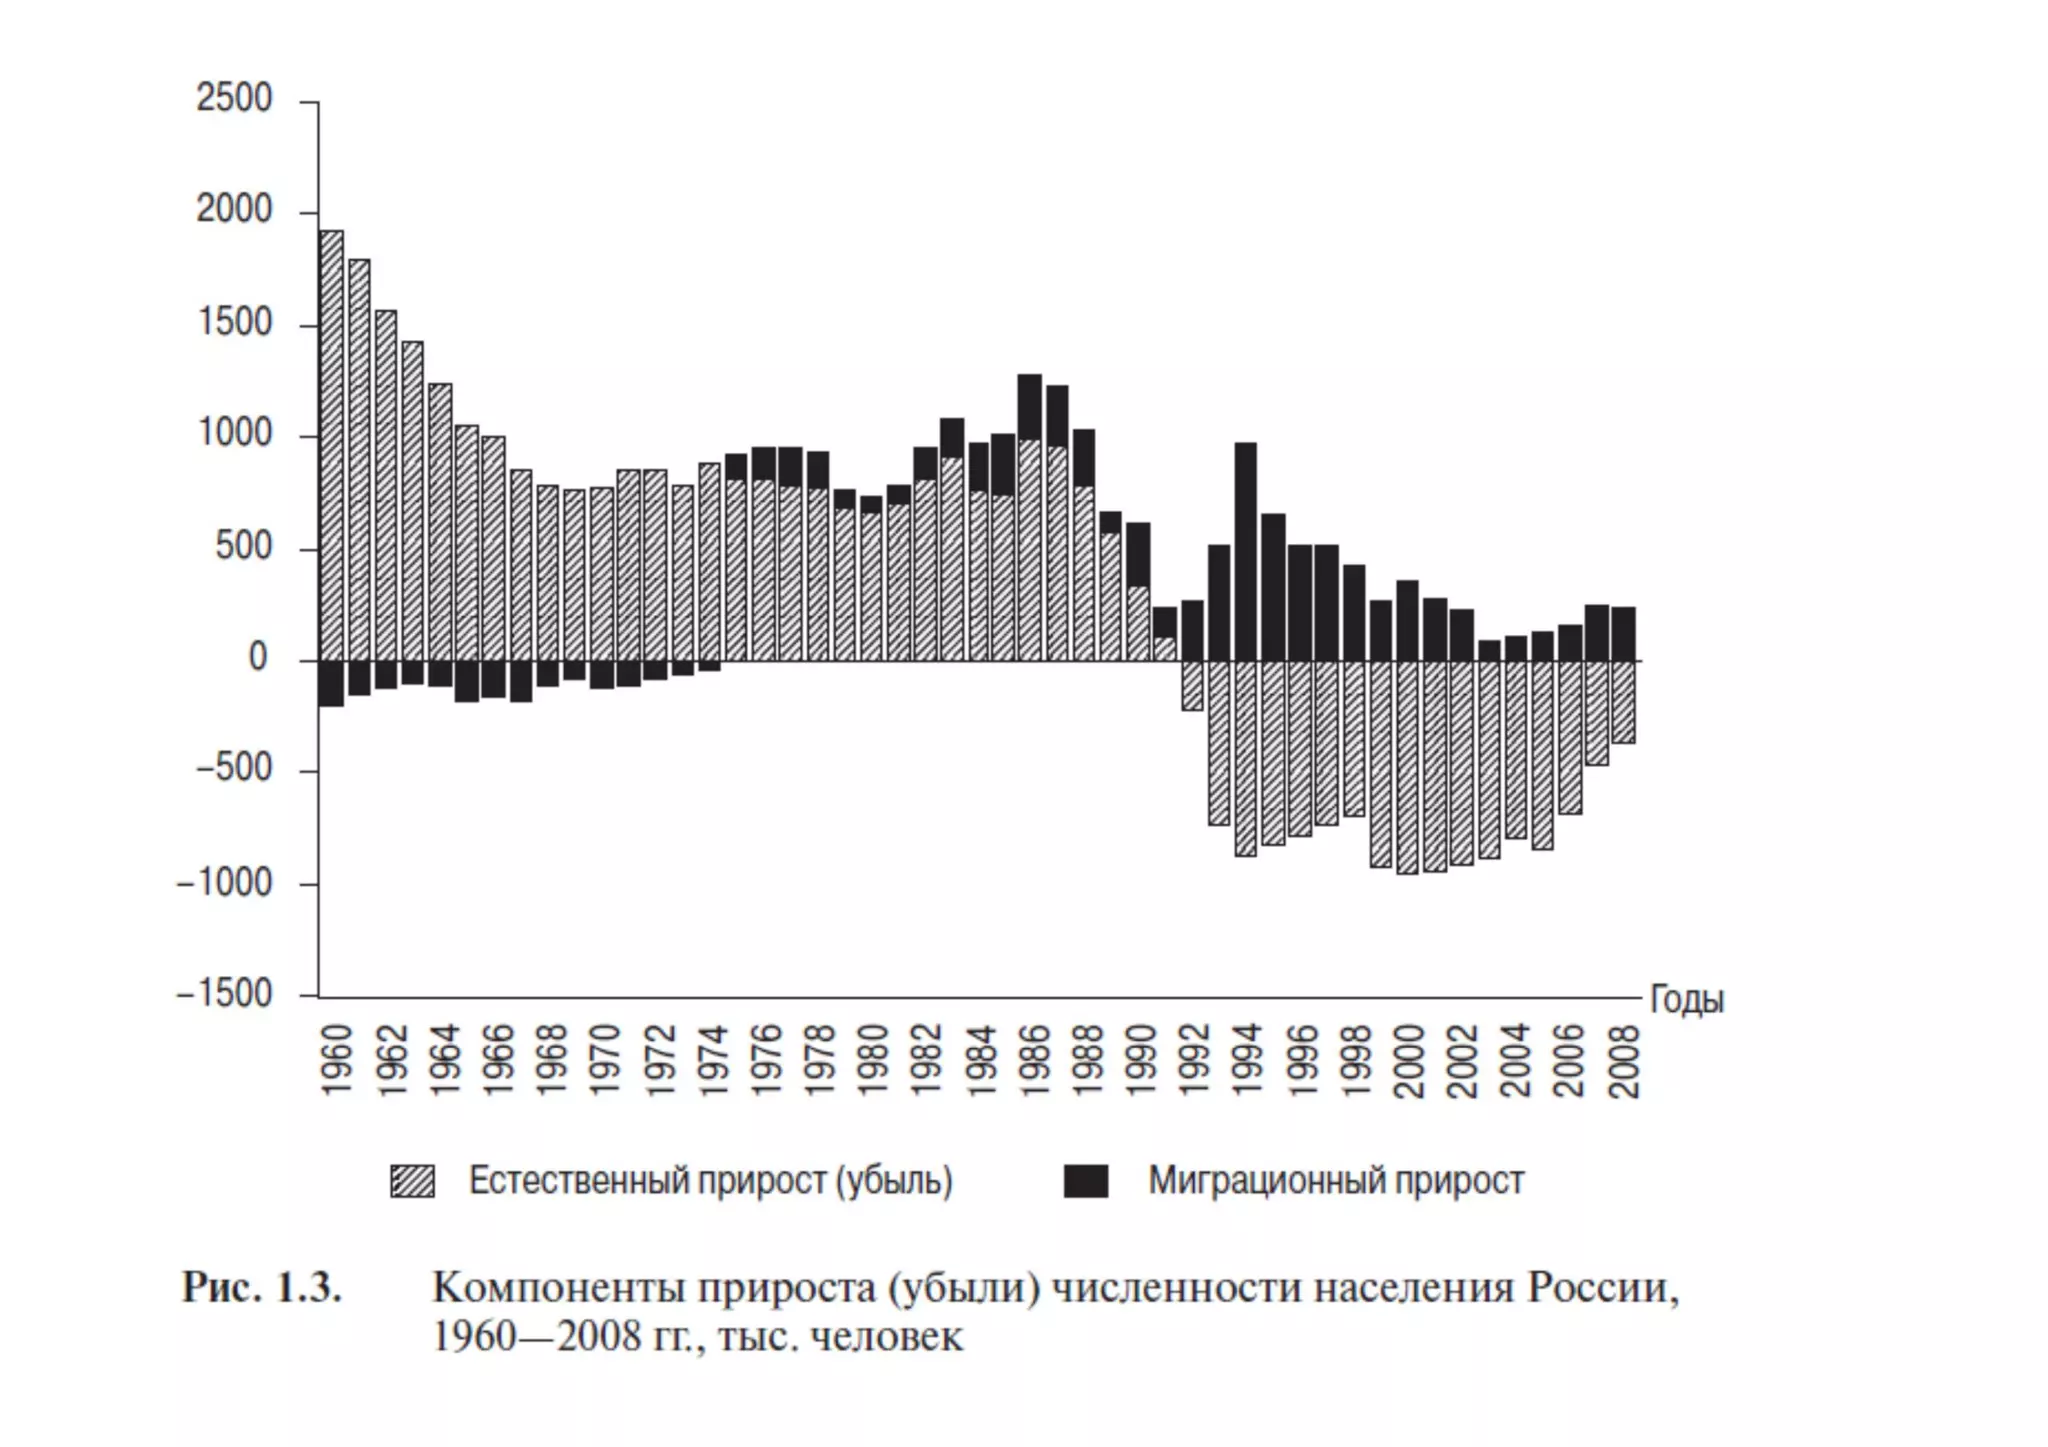
Население России

  на мировом фоне
Классические стадии
демографического перехода

 Stage 1       Stage 2              Stage 3   Stage 4


                                Birth rate

                    Natural
                   increase


           Death rate


                         Time
БЕЛЬГИЯ                                       ЗАИР

80 и ст арше                                   80 и старше

      70-74                                          70-74

      60-64                                          60-64

      50-54                                          50-54

      40-44                                          40-44

      30-34                                          30-34

      20-24                                          20-24

      10-14                                          10-14

        0-4                                            0-4

           1000   500         0   500   1000             1000   500          0   500   1000
World Population Growth Through History
Billions


             12

             11
                                                                      2100
             10
             9                                                     Modern
                 Old                                                 Age
              8                                             Iron   Middle
                Stone                            Bronze
                              New Stone Age       Age       Age    Ages
              7 Age

              6                                                      2000       Future

              5

              4                                                      1975

              3
                                                                     1950
              2
                                                                     1900
              1                     Black Death —The Plague         1800


                  1+ million 7000 6000 5000 4000 3000 2000 1000 A.D. A.D. A.D. A.D. A.D. A.D.
                    years B.C. B.C. B.C. B.C. B.C. B.C. B.C. 1 1000 2000 3000 4000 5000


Source: Population Reference Bureau; and United Nations, World Population Projections to 2100 (1998).
1897_Россия                            1995_Россия


80                                     80
70                                     70
60                                     60
50                                     50
40                                     40
30                                     30
20                                     20
10                                     10
0                                       0
     20   10         0       10   20        15   10     5      0    5
Projected Population Change, by Country
Percent Population Change, 2005-2050


Source: Population Reference Bureau, 2005 World Population Data Sheet.
Birth and Death Rates, Worldwide

Rates of birth, death, and natural increase per 1,000 population
40

35

30

25

20
                        Natural Increase
15

10

 5
 0
 1950- 1955- 1960- 1965- 1970- 1975- 1980- 1985- 1990- 1995- 2000-
 1955 1960 1965 1970 1975 1980 1985 1990 1995 2000 2005

                                      Birth rate     Death rate


Source: United Nations, World Population Prospects: The 2004 Revision, 2005.
Annual Increase in World
Millions
              Population
100

 90

 80

 70

 60

 50

 40

 30

 20

 10

   0
   1951 1956 1961 1966 1971 1976 1981 1986 1991 1996 2001 2005

Source: United Nations, World Population Prospects: The 2004 Revision, 2005.
Patterns of Fertility Decline
Average number of children per woman


  10


   8
                                                                                            Uganda


   6
                                                                                             Kenya


   4
                                                                                           Colombia

   2

                                                                                      South Korea
  0
1950–1955           1960–1965          1970–1975           1980–1985           1990–1995      2000–2005


Source: United Nations, World Population Prospects: The 2004 Revision, 2005.
Изменения в продолжительности жизни, оба пола                        Россия

  85                                                                                              Швеция
  80
                                                                                                  Турция
  75
  70                                                                                              Германия
лет


  65
  60
                                                                                                  Венгрия
  55                                                                                              Италия
  50
  45                                                                                              Япония
       1962

              1965

                     1968

                            1971

                                   1974

                                          1977

                                                 1980

                                                        1983

                                                               1986

                                                                      1989

                                                                             1992

                                                                                    1995

                                                                                           1998
                                                                                                  США
Динамика суммарного коэффициента
          рождаемости в России
  3,5                                                       ВСЕ
                                                            ГОРОД
    3                                                       СЕЛО

  2,5

    2

  1,5

    1
         2   0    1    3    5   7 9  1   3   5   7   9   1   3   5
      196 197 198 198 198 198 198 199 199 199 199 199 200 200 200
   1 - 69 - 80 - 82 - 84 - 86 -
196 19 19 19 19 19
Demogrf present
Demogrf present
Demogrf present
Demogrf present
Demogrf present
Demogrf present

Demogrf present

  • 1.
    Население России на мировом фоне
  • 2.
    Классические стадии демографического перехода Stage 1 Stage 2 Stage 3 Stage 4 Birth rate Natural increase Death rate Time
  • 3.
    БЕЛЬГИЯ ЗАИР 80 и ст арше 80 и старше 70-74 70-74 60-64 60-64 50-54 50-54 40-44 40-44 30-34 30-34 20-24 20-24 10-14 10-14 0-4 0-4 1000 500 0 500 1000 1000 500 0 500 1000
  • 4.
    World Population GrowthThrough History Billions 12 11 2100 10 9 Modern Old Age 8 Iron Middle Stone Bronze New Stone Age Age Age Ages 7 Age 6 2000 Future 5 4 1975 3 1950 2 1900 1 Black Death —The Plague 1800 1+ million 7000 6000 5000 4000 3000 2000 1000 A.D. A.D. A.D. A.D. A.D. A.D. years B.C. B.C. B.C. B.C. B.C. B.C. B.C. 1 1000 2000 3000 4000 5000 Source: Population Reference Bureau; and United Nations, World Population Projections to 2100 (1998).
  • 5.
    1897_Россия 1995_Россия 80 80 70 70 60 60 50 50 40 40 30 30 20 20 10 10 0 0 20 10 0 10 20 15 10 5 0 5
  • 6.
    Projected Population Change,by Country Percent Population Change, 2005-2050 Source: Population Reference Bureau, 2005 World Population Data Sheet.
  • 7.
    Birth and DeathRates, Worldwide Rates of birth, death, and natural increase per 1,000 population 40 35 30 25 20 Natural Increase 15 10 5 0 1950- 1955- 1960- 1965- 1970- 1975- 1980- 1985- 1990- 1995- 2000- 1955 1960 1965 1970 1975 1980 1985 1990 1995 2000 2005 Birth rate Death rate Source: United Nations, World Population Prospects: The 2004 Revision, 2005.
  • 8.
    Annual Increase inWorld Millions Population 100 90 80 70 60 50 40 30 20 10 0 1951 1956 1961 1966 1971 1976 1981 1986 1991 1996 2001 2005 Source: United Nations, World Population Prospects: The 2004 Revision, 2005.
  • 9.
    Patterns of FertilityDecline Average number of children per woman 10 8 Uganda 6 Kenya 4 Colombia 2 South Korea 0 1950–1955 1960–1965 1970–1975 1980–1985 1990–1995 2000–2005 Source: United Nations, World Population Prospects: The 2004 Revision, 2005.
  • 12.
    Изменения в продолжительностижизни, оба пола Россия 85 Швеция 80 Турция 75 70 Германия лет 65 60 Венгрия 55 Италия 50 45 Япония 1962 1965 1968 1971 1974 1977 1980 1983 1986 1989 1992 1995 1998 США
  • 18.
    Динамика суммарного коэффициента рождаемости в России 3,5 ВСЕ ГОРОД 3 СЕЛО 2,5 2 1,5 1 2 0 1 3 5 7 9 1 3 5 7 9 1 3 5 196 197 198 198 198 198 198 199 199 199 199 199 200 200 200 1 - 69 - 80 - 82 - 84 - 86 - 196 19 19 19 19 19