Download to read offline

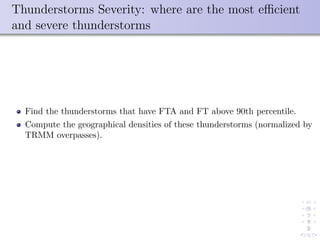
![Data and Methodology
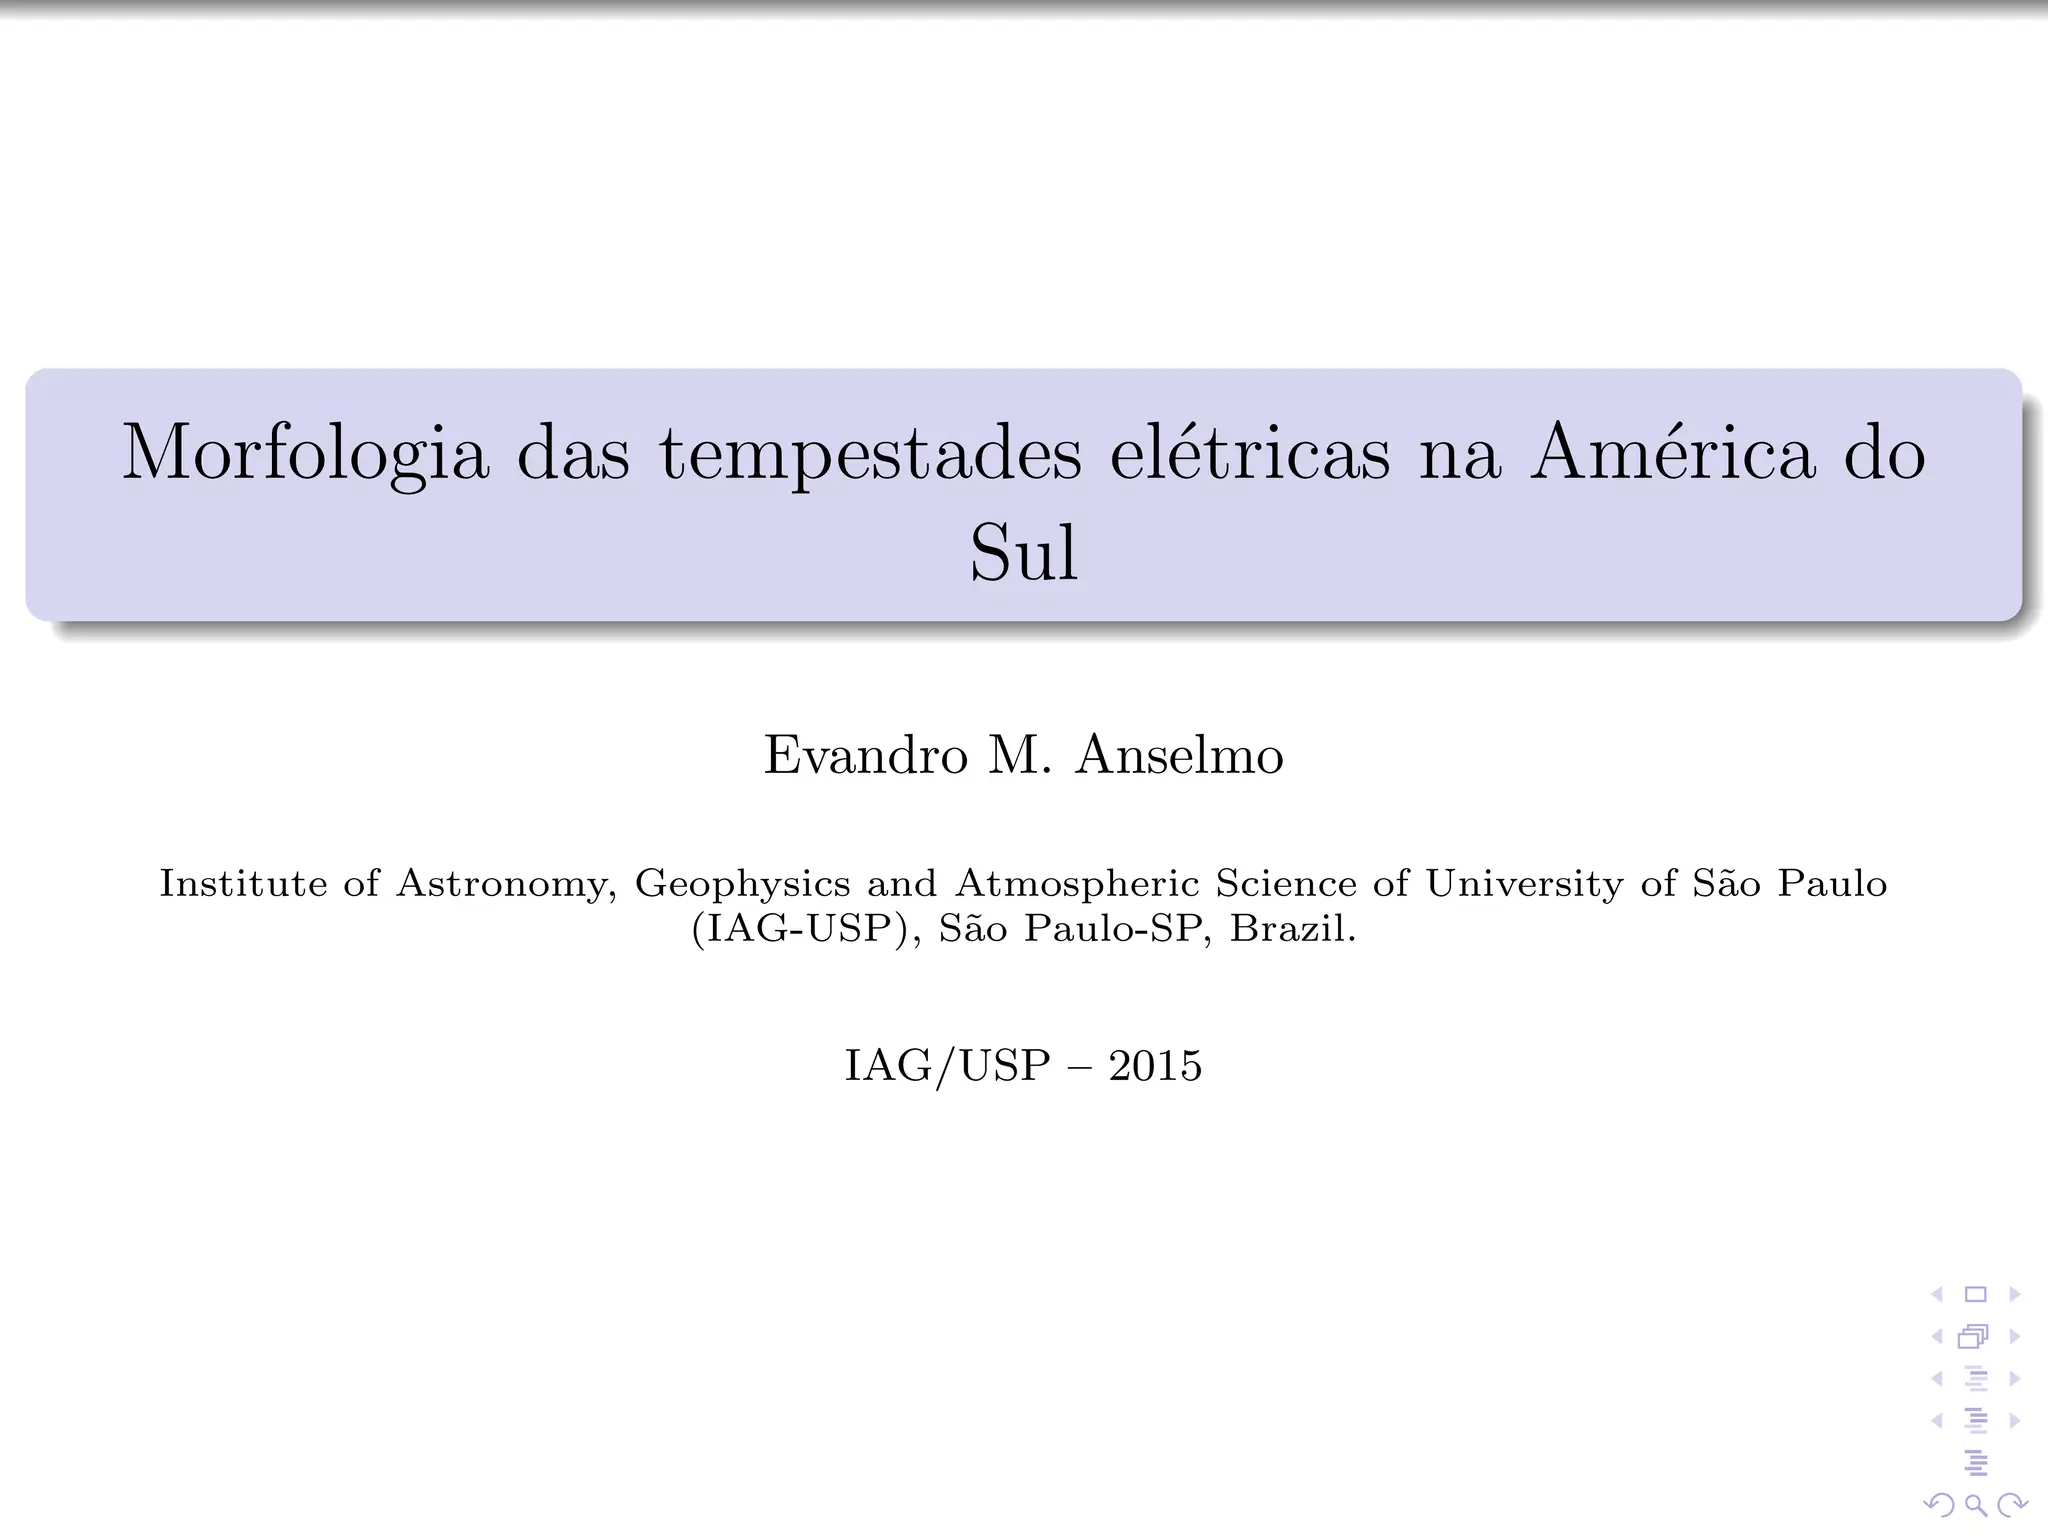
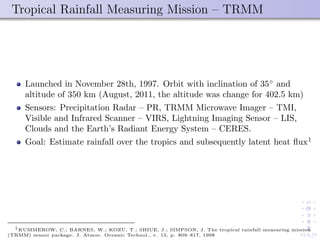
TRMM:
TRMM orbital v7 files: LIS, VIRS (1B01), and PR (2A25), between
1998–2011 ( 30TB of data).
During this period we had 79,932 TRMM orbits, but only 63,613 were
over South America (SA) 40◦
S–10◦
N and 90◦
–30◦
W.
NCEP RII:
NCEP RII reanalysis from 1998-2011: geopotential height and
temperature at 17 pressure levels. This data is used to convert TRMM PR
altitudes levels in temperature.
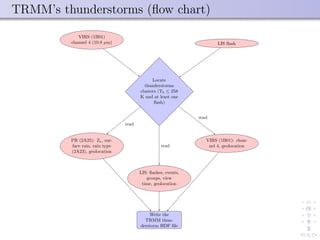
Defining thunderstorms:
Thunderstorms have been defined as clouds with brightness temperature
below 258 K at the 1B01 10.8 µm channel and had at least one LIS
lightning flash [Morales and Anagnostou, 2003]2
.
2Morales, C. A., and E. N. Anagnostou, Extending the capabilities of high-frequency rainfall estimation from
geostationary-based satellite infrared via a network of long-range lightning observations, J. Hydrometeor, 4,
141–159, 2003.](https://image.slidesharecdn.com/daa685b9-2de4-4c4e-8fc8-3045800453fb-160815182911/85/defesaEvandro-9-320.jpg)
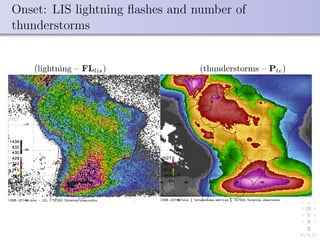
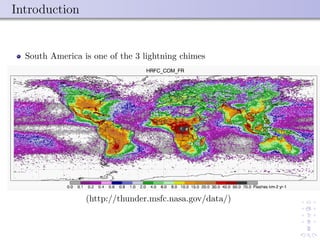
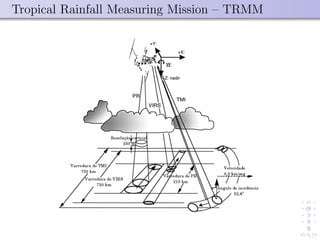
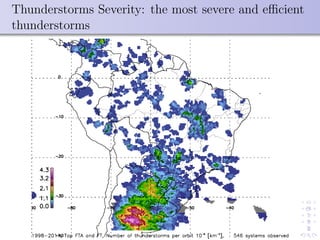
![Onset: Defining densities ratios
lightning [km−2
year−1
]
DEfl =
FLlis
VTlisAg
31557600 (1)
thunderstorms per orbit [km−2
]
DEte =
Pte
VTvirsAg
(2)
lightning per thunderstorms [km−2
year−1
]
DErt =
FLlis
VTlisAgPte
31557600 (3)](https://image.slidesharecdn.com/daa685b9-2de4-4c4e-8fc8-3045800453fb-160815182911/85/defesaEvandro-15-320.jpg)
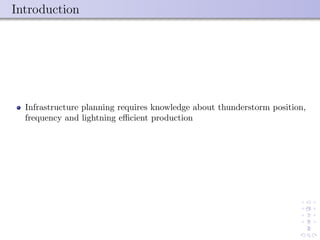
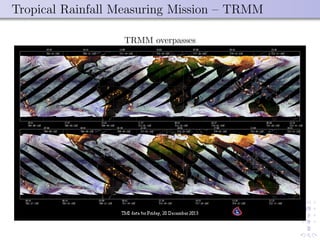
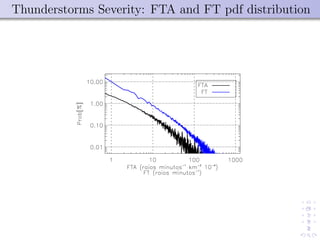
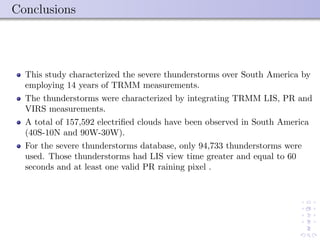
![Thunderstorms Severity: Defining severity index
Flash rate (FT) is defined as the ratio of number of lightning flashes (Nfl)
by the mean view time (V Tm) in the thunderstorm area extracted.
FT =
Nfl
V Tm
60 [min−1
] (4)
Flash rate normalized by thunderstorm area (FTA) is defined as the ratio
of number of lightning flashes (Nfl) by the mean view time (V Tm) and
thunderstorm area (At).
FTA =
Nfl
V TmAt
60 [min−1
km−2
] (5)](https://image.slidesharecdn.com/daa685b9-2de4-4c4e-8fc8-3045800453fb-160815182911/85/defesaEvandro-29-320.jpg)
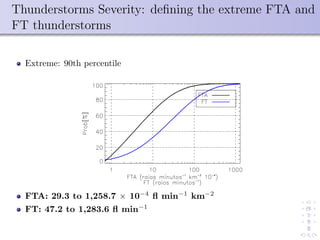
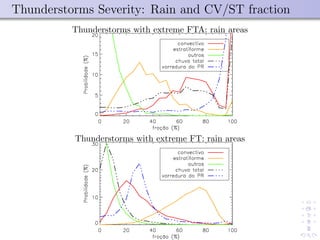
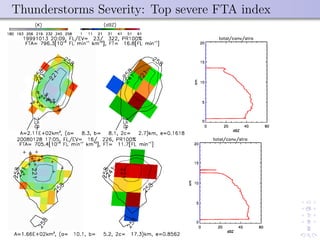
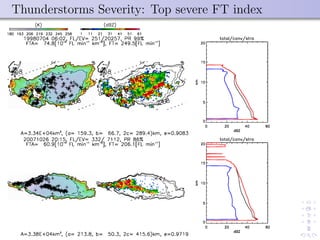
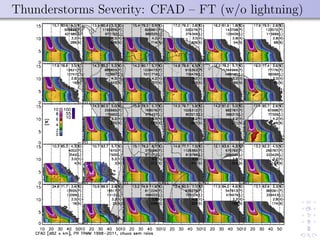
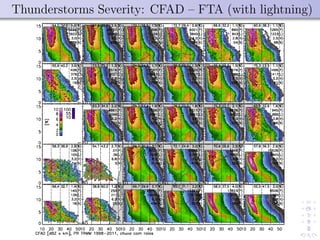
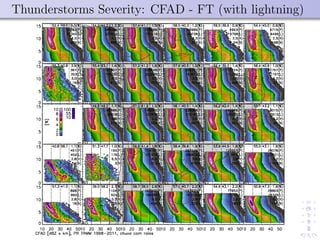
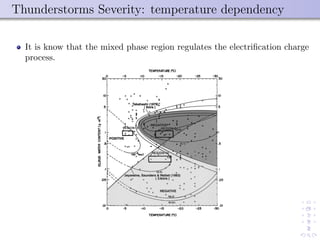
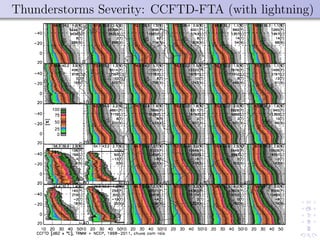
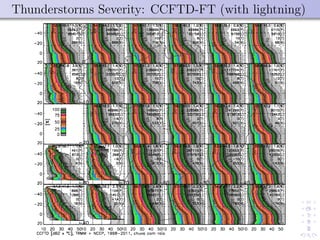
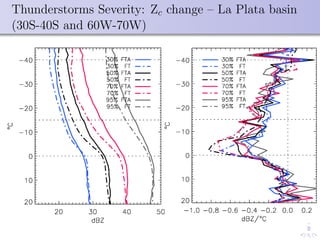
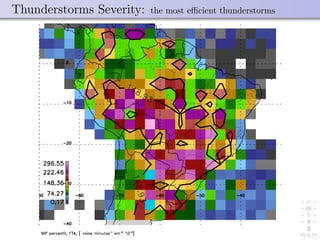
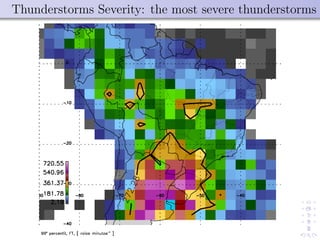
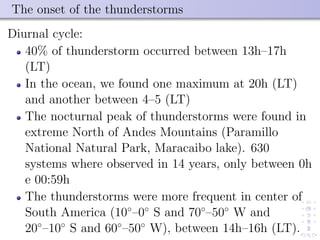
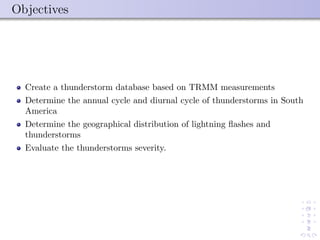
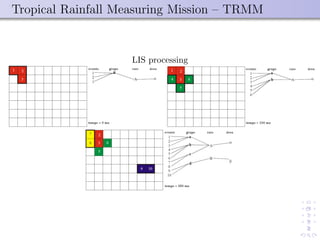
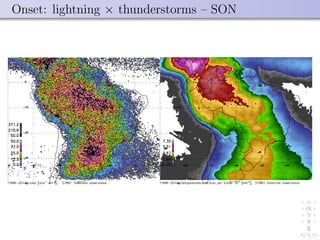
![Severity of Thunderstorms in South America
Two groups of severe systems are found:
FTA 29.3 to 1,258.7 × 10−4
fl min−1
km−2
FT 47.2 to 1,283.6 fl min−1
(above category 3 of Cecil et al. [2005] and
Zipser et al. [2006])
Cloud top Tb: FTA thunderstorms are 10 K colder than FT
thunderstorms
Convective × Stratiform rain fraction: FTA thunderstorms have 72%
of convective rain fraction and 32% stratiform and FT systems 22%
convective and 65% stratiform.
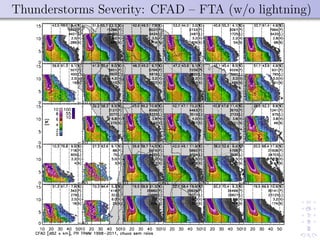
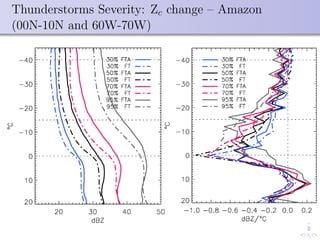
Lightning × non Lightning pixels (CFAD): profiles with lightning
pixels have higher Zc values, and are taller. In the layer between 5 and 7
km height, the Zc difference can reach 5 to 10 dBZ. At lower levels
(2–3km) Zc is above 50 dBZ compared to 40 dBZ for non-lightning pixels;
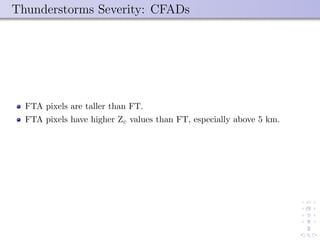
Lightning pixels (CFAD): FTA thunderstorms show 1-3 dBZ higher Zc
values than FT systems, specially above 5 km height;](https://image.slidesharecdn.com/daa685b9-2de4-4c4e-8fc8-3045800453fb-160815182911/85/defesaEvandro-59-320.jpg)
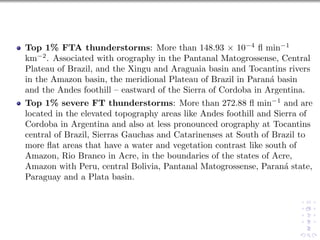

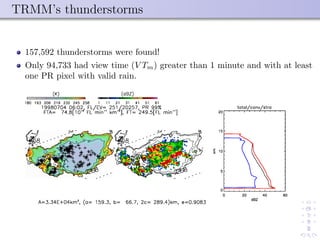
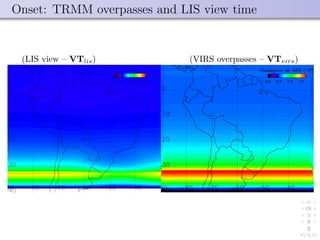
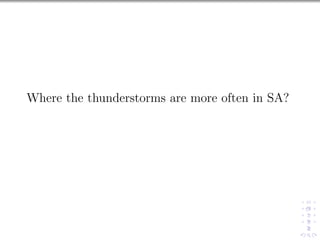
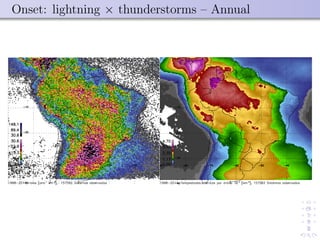
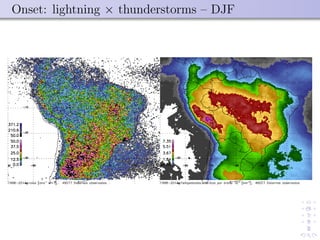
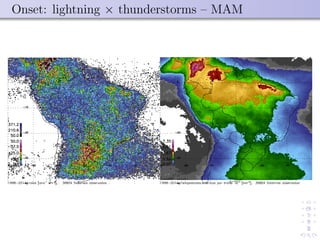
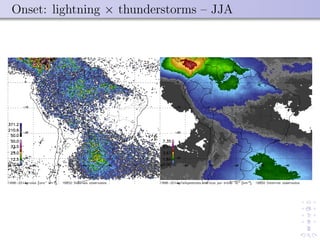
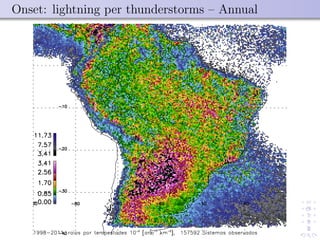
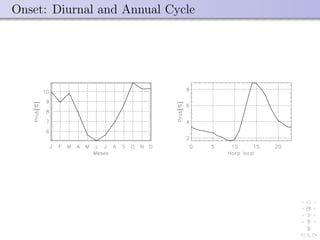
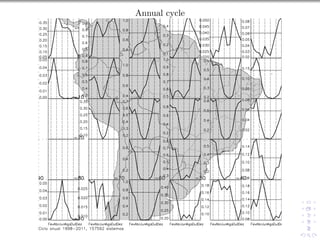
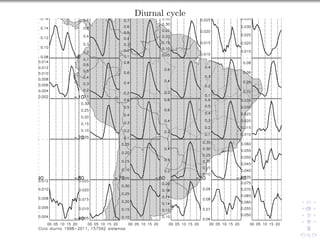
This document summarizes a study analyzing thunderstorm morphology in South America using TRMM satellite data from 1998-2011. Key findings include: 1) Thunderstorms peaked in January and October annually, with diurnal peaks between 13-17 hours local time. The most frequent thunderstorms occurred in central South America. 2) The highest lightning and thunderstorm densities were found along the northern coast of South America and in regions with high topography. 3) Severe thunderstorms were identified and had very high flash rates. The most severe storms occurred in areas with complex terrain in northern and central South America.


