The article discusses a study on using AI technologies for sustainable smart fisheries, focusing on forecasting potential fishing zones (PFZ) through deep learning and machine learning techniques. The authors developed a hybrid model combining autoregressive integrated moving average (ARIMA) and random forest techniques, achieving a 98% detection accuracy in mapping viable fishing areas using water quality indicators like salinity and dissolved oxygen. They emphasize the need for accurate fishing zone predictions to support the fishing industry in India, highlighting the research's potential benefits for fishermen and environmental sustainability.
![IAES International Journal of Artificial Intelligence (IJ-AI)
Vol. 13, No. 2, June 2024, pp. 1519~1525
ISSN: 2252-8938, DOI: 10.11591/ijai.v13.i2.pp1519-1525 1519
Journal homepage: http://ijai.iaescore.com
Deep learning and machine learning classification technique for
integrated forecasting
Vigilson Prem Monickaraj1
, Sterlin Rani Devakadacham2
, Nithyadevi Shanmugam3
,
Nithya Nandhakumar4
, Manjunathan Alagarsamy5
, Kannadhasan Suriyan6
1
Department of Computer Science and Engineering, R.M.K. College of Engineering and Technology, Tamil Nadu, India
2
Department of Computer Science and Engineering, R.M.D. Engineering College, Tamil Nadu, India
3
Department of Electronics and Communication Engineering, Dr.N.G.P. Institute of Technology, Tamil Nadu, India
4
Department of Computer Science and Engineering, K. Ramakrishnan College of Engineering, Tamil Nadu, India
5
Department of Electronics and Communication Engineering, K. Ramakrishnan College of Technology, Tamil Nadu, India
6
Department of Electronics and Communication Engineering, Study World College of Engineering, Tamil Nadu, India
Article Info ABSTRACT
Article history:
Received Dec 10, 2022
Revised Dec 25, 2023
Accepted Jan 27, 2024
Smart fisheries are increasingly using artificial intelligence (AI)
technologies to increase their sustainability. The potential fishing zone
(PFZ) forecasts several fish aggregation zones throughout the duration of the
prediction in any sea. The autoregressive integrated moving average
(ARIMA) and random forest model are used in the current study to provide a
technique for locating viable fishing zones in deep marine seas. A significant
amount of data was gathered for the database's creation, including
monitoring information for Indian fishing fleets from 2017 to 2019. Using
expert label datasets for validation, it was discovered that the model's
detection accuracy was 98%. Our method uses salinity and dissolved
oxygen, two crucial markers of water quality, to identify suitable fishing
zones for the first time. In the current research, a system was created to
identify and map the quantity of fishing activity. The tests use a number of
parameter measurements to evaluate the contrast-enhanced computed
tomography (CECT) approach to machine learning (ML) and deep learning
(DL) methodologies. The findings showed that the CECT had a 94%
accuracy rate compared to a convolutional neural network's 92% accuracy
rate for the 80% training data and 20% testing data.
Keywords:
Artificial intelligence
Classification technique
Convolutional neural network
Financial derivatives feature
potential fishing zone
This is an open access article under the CC BY-SA license.
Corresponding Author:
Vigilson Prem Monickaraj
R.M.K. College of Engineering and Technology
Chennai, Tamil Nadu, India
Email: vigiprem@gmail.com
1. INTRODUCTION
Many parties with interest in the issue are turning to artificial intelligence-based smart fisheries to
help alleviate the issue of declining fish populations [1]. Since 2018, the United Nations (UN), the European
Unions (EU), and several state governments have proclaimed a purportedly new "AI era" [2]. Since 2017, the
UN has had an artificial intelligence programme for global governance. In order to make sure that the
Sustainable Development Goals (SDGs) benefit everyone and promote the SDGs, AI was utilised to evaluate
the SDGs. Because of its superior resources, practical living places, and rich biodiversity, the coastal marine
environment is essential to India's economy. India's exclusive economic zone (EEZ), which includes islands
and extends 7517 km of coastline, is a key area for research and the utilisation of shared resources. Its total
area is 2.5 million km2
. The marine fishing sector employs about 14 million people and generates revenue by
exporting to untapped markets. Despite having a harvestable potential of 3.93 million tonnes, India produces](https://image.slidesharecdn.com/3322765-241129072510-59615281/75/Deep-learning-and-machine-learning-classification-technique-for-integrated-forecasting-1-2048.jpg)
![ ISSN:2252-8938
Int J Artif Intell, Vol. 13, No. 2, June 2024: 1519-1525
1520
around 2.94 million tonnes of marine fisheries annually [3], [4]. Finding the best fishing spots still presents a
challenge for anglers.
Both the maritime characteristics visible in satellite photos and data from ground truth sources have
been used to forecast the fishing zone. However, the majority of study frameworks made predictions using
aspects of oceanography, such as chlorophyll and sea surface temperature (SST). Machine and deep learning
techniques have already helped fishing zone prediction reach new heights. Long short-term memory (LSTM),
Markov models, Nave Bayes (NB) classifiers, support vector machines (SVM), and deep neural networks
(DNN) are some of the methods used to estimate the location of fisheries based on various oceanographic
variables. Less promising is that we still lack a reliable prognosis for Packet Filter (PF), which is a result of
the study. In this work, a brand-new hybrid model called hybrid ensemble DEEPFISHNETS (HE-DFNETS)
is suggested to address the aforementioned issue. The flitter bat optimised LSTM (FOLSTM) and double tier
convolutional neural networks (DTCN) are combined for an effective prediction of PFZs (PEZ) utilising
remote sensing pictures [5]–[8]. The results show how much better the RF model is than the GBDT model
and how well it can recover the SSA. Furthermore, the accuracy of the two models often decreases at depths
below 500 m.
Using SST data from satellites, SSHA data from sea surface height anomalies, and OHC700 climate
data, the artificial neural network (ANN) approach has been applied to assess OHC700 in the Indian Ocean.
The results suggest that the ANN method may be useful for accurately investigating OHC700 on a practically
continuous basis. This interaction seeks to anticipate the sensor simplicity of chlorophyll-A (C.A.) in the
upper expanse of the Arctic Ocean (AO) by assessing data from upper sea perception floats placed in the AO.
It is suggested to use a model that combines stacked auto encoder (SAE), bidirectional LSTM, and wavelet
change. These frameworks provide superior findings when comparing the mean absolute error (MAE) and
root mean square error (RMSE) of the experiment [9]–[12].
By looking at restrictions that specify the appropriateness of frame speed increases. It is shown how
ice condition may be dispersed among several pretrained conditions using a Kullback-Leibler disparity
metric. The study demonstrates that factual order approaches developed using measurement data provide
more precise and reliable results [13]–[18]. Automatic information systems (S-AIS), which have been offered
as a revolutionary way to follow the movements of fishing fleets in almost real time, are typically installed on
the majority of ocean-going boats nowadays. It is shown that PFZ may be predicted accurately utilising a
data mining (DM) strategy and an algorithm developed via study of water quality indicators. Finding PFZs
requires the use of two water quality indicators: salinity and dissolved oxygen [19]–[22]. For purse seiners, a
multi-layered filtration system was created based on vessel speed and operating time. When measured against
expert-labeled datasets, the average detection accuracies for trawler and longline fishing were 83% and 97%,
respectively. Our research is the only all-inclusive strategy currently available for detecting and classifying
probable fishing activity utilising the three main gear types used around the world [23]–[25].
2. RELATED WORKS
South West Atlantic digital echo-recording techniques for ANN training and testing: automated
credit and categorization in the classroom. The ANNs were created to extract energetic school and
bathymetric parameters from echo recordings. The best result was achieved by changing the input values for
species. Correct rates may reach 96% depending on the species, network design, and quantity of schools
utilised. It was recommended to do further study into this strategy as a practical tool for echogram analysis.
All aquatic creatures that depend on dissolved oxygen (DO), a critical indicator of water quality, must have it
to survive. The amount of DO present in water bodies in catchments may be influenced by both man-made
activities and natural occurrences. The quantity of dissolved oxygen in waterbodies is affected by a number
of factors, including water temperature, animal respiration and decomposition rates, the amount of oxygen
replenished by photosynthesizing plants, stream flow, and aeration. Water temperature significantly affects
the quantity of DO because warm water dissolves less oxygen than cold water. A number of sensors deployed
on satellites and other platforms, such aeroplanes, measure the quantity of radiation reflecting off the water's
surface at different wavelengths. The total suspended solids (TSS), chlorophyll a concentration, turbidity,
salinity, total phosphorus (TP), Secchi disc depth (SDD), temperature, pH, and dissolved organic carbon
(DOC) are just a few examples of water quality indicators that can be directly or indirectly determined using
these reflections. In order to monitor and evaluate the water quality, it is crucial to include contaminants that
are caused by the hydrological, biological, and chemical components of the water, among other factors. The
research thus covers the commonly used airborne and spaceborne sensors for evaluating the quality of water
and evaluates the utility of remotely sensed approaches for evaluating the quality of waterbodies. The
characteristics of airborne and spaceborne sensors, including their spectrum, spatial, and temporal
capabilities, are summarised to serve as a sensor selection guide. The research also looks at eleven water](https://image.slidesharecdn.com/3322765-241129072510-59615281/75/Deep-learning-and-machine-learning-classification-technique-for-integrated-forecasting-2-2048.jpg)

![Int J Artif Intell ISSN:2252-8938
Deep learning and machine learning classification technique for integrated … (Vigilson Prem Monickaraj)
1523
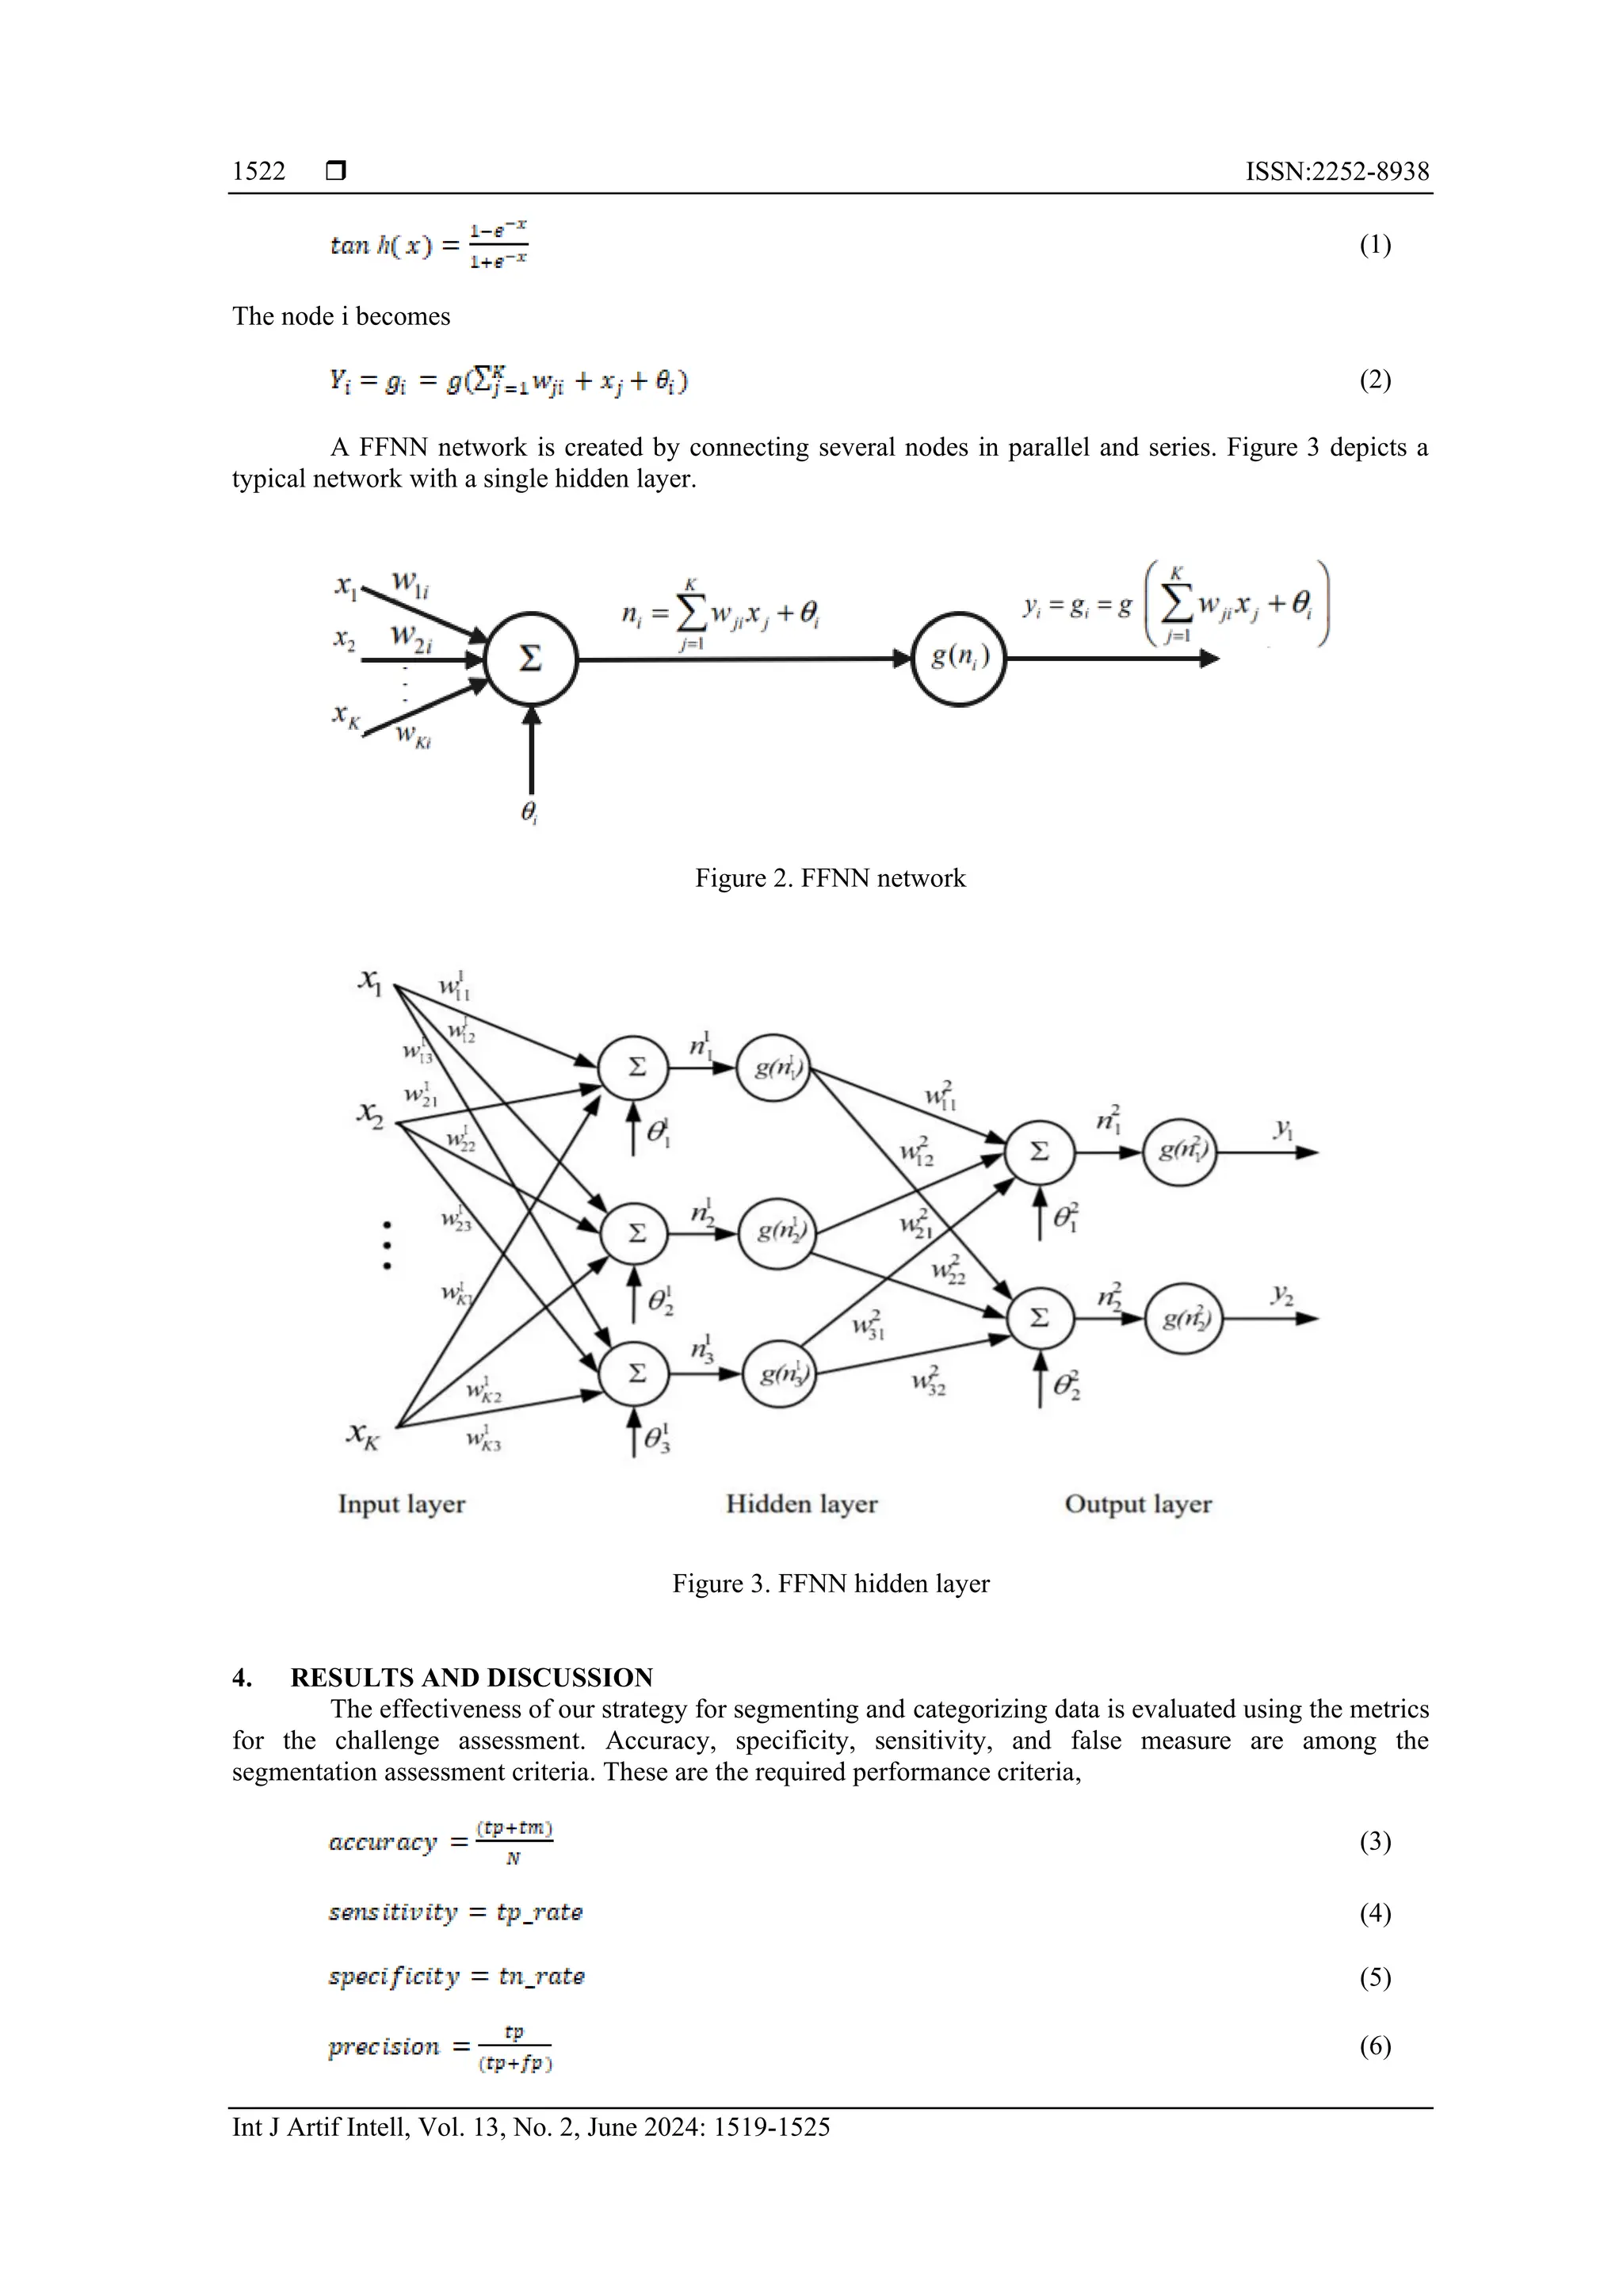
(7)
(8)
(9)
The letters tp, tn, fp, and fn, respectively, stand for the number of true positives, true negatives, false
positives, and false negatives. The overall number of pieces is N. To accurately forecast PFZ's future, the 16
criteria and other financial derivative features are used. Utilising efficient pre-processing methods, the
undesired and missing data are deleted. The neural network is the finest and most effective approach
currently in use for anticipating nonlinear occurrences. In order to forecast the IPFZ, the Function Fitting
Neural Network (FFNN) technique is primarily employed. In order to do the practical analysis, a number of
factors including the 80%-20%, 60%-40%, and future data are employed. The findings show that the
recommended FFNN obtained 90% accuracy compared to the previous neural network's 86% accuracy
utilising financial derivative characteristics for the accessible dataset's 80%–20%. To safeguard the general
populace's health, clean, secure drinking water must always be available. By using risk assessment and
management strategies, beginning with watershed areas and ending with home storage vessels, drinking
water safety may be efficiently assured. In the current investigation, risk variables impacting water quality
throughout the distribution network may be found using the Wireless Session Protocol [WSP] method. The
primary causes of faecal coliforms entering potable water have been identified as inconsistent water supply
and inadequate distribution network maintenance. Small risks were well controlled, and immediate remedial
action was implemented. However, our analysis demonstrates that in order to ensure the sustainability of the
WSP, local water management teams must have ongoing assistance and direction. The comparison of the
proposed technique toward other techniques are shown in Table 1.
Table 1. Performance evaluation of proposed technique
Classification technique Sensitivity Specificity Precision Recall G-mean
Probabilistic neural network (PNN) 1.0025 0.8598 0.0994 1.0025 0.9565
Function fitting neural network (FFNN) 1.0025 0.9895 0.0884 1.0025 0.9851
Convolutional neural network (CNN) 1.0025 0.9258 0.1209 1.0025 0.9882
Proposed Method 1.0025 0.9280 0.1541 1.0025 0.9795
5. CONCLUSION
Modern ecology and conservation have significant challenges in accurately monitoring the
worldwide spread of varied human influences, such as fishing. Average annual fish production in India is just
2 tonnes per person. Through increasing fish exports, knowledge sharing regarding sustainable fishing
methods, and high productivity, there is an opportunity to raise the living standards of Indian fishermen. The
major objectives of this project are to find a solution to this issue and assist the fishermen in locating
productive fishing zones and locations. Using pre-processing and normalisation techniques, missing values
and undesirable data are eliminated from the collected data. IPFZ prediction will be carried out in the future
using the feature selection approach and the CECT methodology. The fishing effort maps of other nations,
particularly those for remote regions and the high seas, are rife with doubt. While some nations routinely
monitor their coastal fisheries in their territorial waters, others do not. To prioritise and carry out international
fisheries management and conservation initiatives, a fuller knowledge of the world's fishing fleets is required.
4,827 fishing settlements, 2,914 fish landing facilities, and 7589 miles of marine coastline may be found in
India. In this industry, there are between 13 and 14 million workers. 14 criteria are then employed to extract
the important features, together with geometrical and financial derivatives considerations. The results
revealed that the suggested CECT approach had an accuracy of over 93% for the 85%-25% range and 72%
for the analysis of future data.
REFERENCES
[1] N. Mishra, M. Tech Scholar, and A. Kushwaha, “Rainfall prediction using gaussian process regression classifier,” International
Journal of Advanced Research in Computer Engineering & Technology (IJARCET), vol. 8, no. 8, pp. 2278–1323, 2019.
[2] U. Shah, S. Garg, N. Sisodiya, N. Dube, and S. Sharma, “Rainfall prediction: Accuracy enhancement using machine learning and
forecasting techniques,” PDGC 2018 - 2018 5th International Conference on Parallel, Distributed and Grid Computing,
pp. 776–782, 2018, doi: 10.1109/PDGC.2018.8745763.
[3] E. Hernández, “Rainfall prediction: A deep learning approach,” International Conference on Hybrid Artificial Intelligence
Systems, 2016.](https://image.slidesharecdn.com/3322765-241129072510-59615281/75/Deep-learning-and-machine-learning-classification-technique-for-integrated-forecasting-5-2048.jpg)
![ ISSN:2252-8938
Int J Artif Intell, Vol. 13, No. 2, June 2024: 1519-1525
1524
[4] S. Manandhar, S. Dev, Y. H. Lee, Y. S. Meng, and S. Winkler, “A data-driven approach for accurate rainfall prediction,” IEEE
Transactions on Geoscience and Remote Sensing, vol. 57, no. 11, pp. 9323–9330, 2019, doi: 10.1109/TGRS.2019.2926110.
[5] M. A. Hashmani, S. M. Jameel, S. S. H. Rizvi, and S. Shukla, “An adaptive federated machine learning-based intelligent system
for skin disease detection: A step toward an intelligent dermoscopy device,” Applied Sciences (Switzerland), vol. 11, no. 5,
pp. 1–19, 2021, doi: 10.3390/app11052145.
[6] H. Li, Y. Pan, J. Zhao, and L. Zhang, “Skin disease diagnosis with deep learning: A review,” Neurocomputing, vol. 464,
pp. 364–393, 2021, doi: 10.1016/j.neucom.2021.08.096.
[7] M. Dildar et al., “Skin cancer detection: A review using deep learning techniques,” International Journal of Environmental
Research and Public Health, vol. 18, no. 10, 2021, doi: 10.3390/ijerph18105479.
[8] S. Verma, A. K., Pal, S., & Kumar, “Comparison of skin disease prediction by feature selection using ensemble data mining
techniques,” Informatics in Medicine Unlocked, 2019.
[9] V. Jaychandra Reddy and T. J. Nagalakshmi, “Skin disease detection using artificial neural network,” Indian Journal of Public
Health Research and Development, vol. 10, no. 11, pp. 3829–3832, 2019, doi: 10.5958/0976-5506.2019.04183.4.
[10] N. S. Alkolifi Alenezi, “A method of skin disease detection using image processing and machine learning,” Procedia Computer
Science, vol. 163, pp. 85–92, 2019, doi: 10.1016/j.procs.2019.12.090.
[11] D. S. Santhiya, S. S. L. Pravallika, M. A. Sukrutha, I. Nishanth, N. Iswarya, and D. Aishwarya, “Skin disease detection using V2
and V3 in machine learning,” International Journal of Engineering Science and Computing, vol. 9, no. 4, pp. 21343–21347, 2019.
[12] S. Bhadula*, S. Sharma, P. Juyal, and C. Kulshrestha, “Machine learning algorithms-based skin disease detection,” International
Journal of Innovative Technology and Exploring Engineering, vol. 9, no. 2, pp. 4044–4049, 2019,
doi: 10.35940/ijitee.b7686.129219.
[13] F. Warsi, R. Khanam, S. Kamya, and C. P. Suárez-Araujo, “An efficient 3D color-texture feature and neural network technique
for melanoma detection,” Informatics in Medicine Unlocked, vol. 17, 2019, doi: 10.1016/j.imu.2019.100176.
[14] S. S. P. and N. Leelavathy S, Jaichandran R, Shobana R, Vasudevan, “Skin disease detection using computer vision and machine
learning technique,” European Journal of Molecular & Clinical Medicine, vol. 7, no. 4, pp. 2999–3003, 2020.
[15] F. Ghobadi and D. Kang, “Improving long-term streamflow prediction in a poorly gauged basin using geo-spatiotemporal
mesoscale data and attention-based deep learning: A comparative study,” Journal of Hydrology, vol. 615, p. 128608, 2022,
doi: 10.1016/j.jhydrol.2022.128608.
[16] R. M. A. Ikram, B. B. Hazarika, D. Gupta, S. Heddam, and O. Kisi, “Streamflow prediction in mountainous region using new
machine learning and data preprocessing methods: a case study,” Neural Computing and Applications, vol. 35, no. 12,
pp. 9053–9070, 2023, doi: 10.1007/s00521-022-08163-8.
[17] F. Granata, F. Di Nunno, and G. de Marinis, “Stacked machine learning algorithms and bidirectional long short-term memory
networks for multi-step ahead streamflow forecasting: A comparative study,” Journal of Hydrology, vol. 613, p. 128431, 2022,
doi: 10.1016/j.jhydrol.2022.128431.
[18] F. Granata, F. Di Nunno, M. Najafzadeh, and I. Demir, “A stacked machine learning algorithm for multi-step ahead prediction of
soil moisture,” Hydrology, vol. 10, no. 1, 2023, doi: 10.3390/hydrology10010001.
[19] Y. Zhang et al., “Accurate prediction of water quality in urban drainage network with integrated EMD-LSTM model,” Journal of
Cleaner Production, vol. 354, p. 131724, 2022, doi: 10.1016/j.jclepro.2022.131724.
[20] Z. Li et al., “Developing stacking ensemble models for multivariate contamination detection in water distribution systems,”
Science of the Total Environment, vol. 828, p. 154284, 2022, doi: 10.1016/j.scitotenv.2022.154284.
[21] D. H. Nguyen, X. H. Le, D. T. Anh, S. H. Kim, and D. H. Bae, “Hourly streamflow forecasting using a Bayesian additive
regression tree model hybridized with a genetic algorithm,” Journal of Hydrology, vol. 606, p. 127445, 2022,
doi: 10.1016/j.jhydrol.2022.127445.
[22] Y. Liu, G. Hou, F. Huang, H. Qin, B. Wang, and L. Yi, “Directed graph deep neural network for multi-step daily streamflow
forecasting,” Journal of Hydrology, vol. 607, p. 127515, 2022, doi: 10.1016/j.jhydrol.2022.127515.
[23] R. M. Adnan, R. R. Mostafa, A. Elbeltagi, Z. M. Yaseen, S. Shahid, and O. Kisi, “Development of new machine learning model
for streamflow prediction: case studies in Pakistan,” Stochastic Environmental Research and Risk Assessment, vol. 36, no. 4,
pp. 999–1033, 2022, doi: 10.1007/s00477-021-02111-z.
[24] R. M. Adnan, R. R. Mostafa, O. Kisi, Z. M. Yaseen, S. Shahid, and M. Zounemat-Kermani, “Improving streamflow prediction
using a new hybrid ELM model combined with hybrid particle swarm optimization and grey wolf optimization,” Knowledge-
Based Systems, vol. 230, p. 107379, 2021, doi: 10.1016/j.knosys.2021.107379.
[25] by Ali Javed to et al., “Cluster analysis of time series data with application to hydrological events and serious illness
conversations a dissertation presented,” Graduate College Dissertations and Theses, The University of Vermont and State
Agricultural College, Burlington, Vermont, 2021.
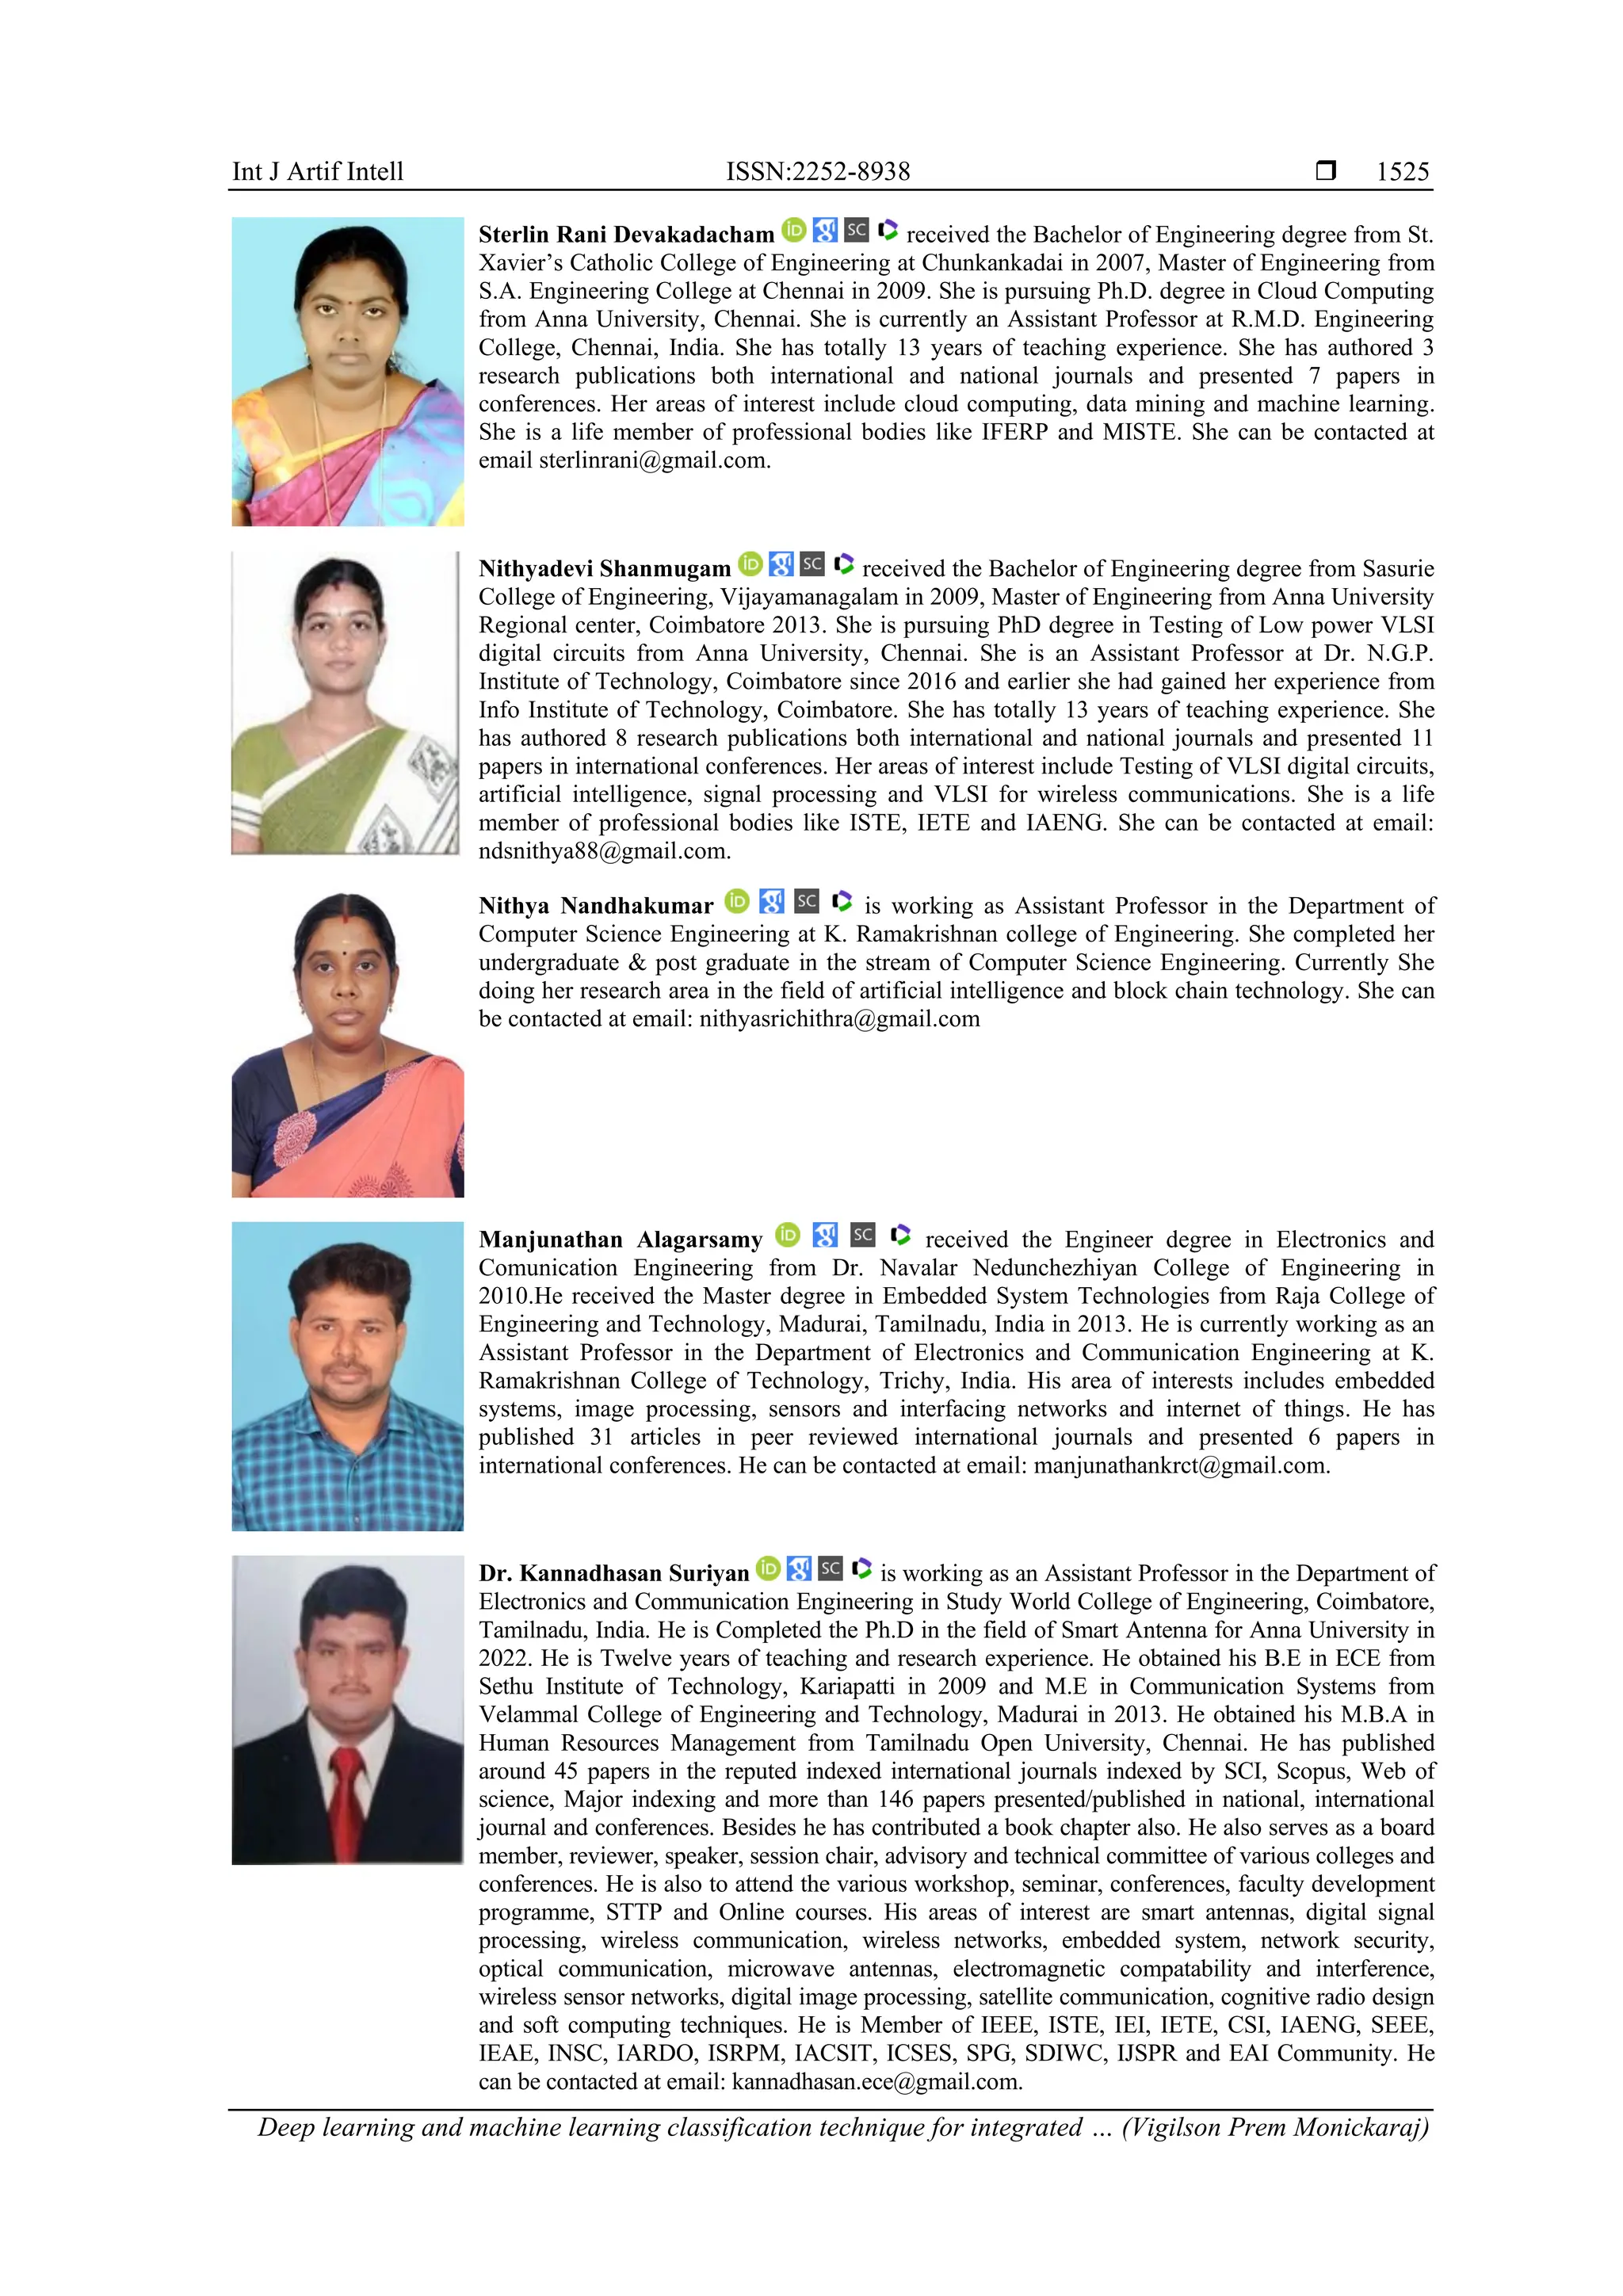
BIOGRAPHIES OF AUTHORS
Vigilson Prem Monickaraj completed his B. Sc. Degree in Physics from M. K.
University and Post Graduate Diploma in Computer Application from M. S. University in the
years 1992 and 1993 respectively. He received his M. Sc. Degree in Computer Science from
Bharathidasan University in the year 1996 and M. Phil. Degree in Computer Science in the year
2003 from M. S. University. He completed his M.E. degree in Computer Science and
Engineering (2006) from Anna University. He received his Ph.D. Degreee in Information and
Communication Engineering from Anna University in 2013. His research interests lie in the
areas of mobile agents, networks, distributed system, database, and network security. He has
over 26 years of teaching experience. He has around 25 publications in the international
conferences and referred journals. At present, he is working as a Professor in the Department of
Computer Science and Engineerig at R.M.K. College of Engineering and Technology,
Puduvoyal. He can be contacted at email: vigiprem@gmail.com](https://image.slidesharecdn.com/3322765-241129072510-59615281/75/Deep-learning-and-machine-learning-classification-technique-for-integrated-forecasting-6-2048.jpg)


![Vibe Coding vs. Spec-Driven Development [Free Meetup]](https://cdn.slidesharecdn.com/ss_thumbnails/vibecodingvsspecdrivendevelopment-251209105622-43f455e7-thumbnail.jpg?width=640&height=640&fit=bounds)


