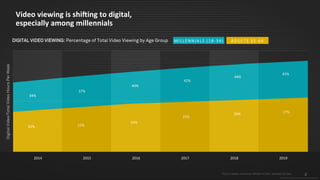
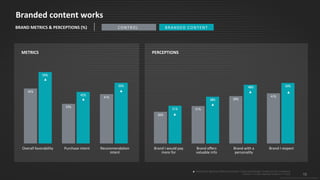
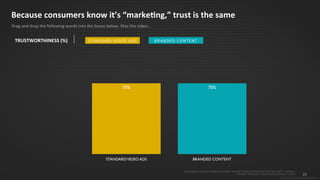
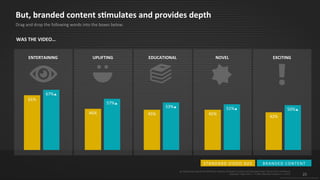
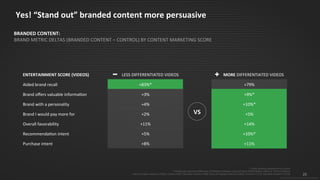
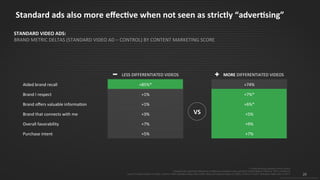
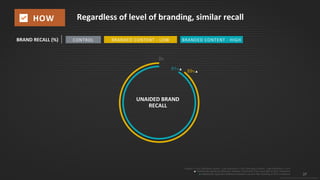
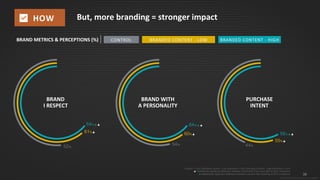
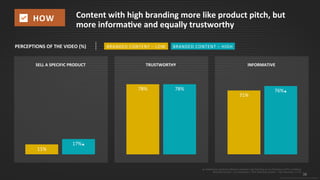
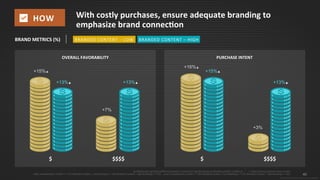
1
© 2015 IPG Media Lab. Proprietary & Confidential
THE GLOBAL GUIDE TO WHAT WORKS
DECONSTRUCTING BRANDED CONTENT
2
© 2015 IPG Media Lab. Proprietary & Confidential
Video viewing is shifting to digital,
especially among millennials
34%
37%
40%
42%
44%
45%
20% 22%
24%
25%
26% 27%
MILLENNIALS (18-34) ADULTS 35-64DIGITAL VIDEO VIEWING: Percentage of Total Video Viewing by Age Group
DigitalVideo/TotalVideoHoursPerWeek
2014 2015 2016 2017 2018 2019
*Source: Nielsen, ComScore, MAGNA GLOBAL estimates US Data 2
© 2015 IPG Media Lab. Proprietary & Confidential
2014 2015 2016 2017 2018 2019
3
© 2015 IPG Media Lab. Proprietary & Confidential
…And it’s ubiquitous
01
CHILE
02
COLOMBIA
03
DENMARK
04
ISRAEL
05
MALAYSIA
06
POLAND
07
PORTUGAL
08
THAILAND
09
TURKEY
10
UAE
% OF PEOPLE WHO HAVE WATCHED ONLINE VIDEO WITHIN PAST 6 MONTHS
*Source: WAVE; UM Global Survey 3
90% 90% 89%
93%
82%
88%
93% 91%
31%
86%
© 2015 IPG Media Lab. Proprietary & Confidential
4
© 2015 IPG Media Lab. Proprietary & Confidential
Brands are following suit and building content to tell their stories
EXPECTED CHANGE IN CONTENT MARKETING BUDGET
According to Business Professionals in Denmark
*Source: www.eMarketer.com; Brand Movers, “Content Marketing i Danmark 2015” in conjunction with Huset Markedsforing, March 26, 2015
6%
SIGNIFICANT INCREASE
44%
INCREASE
15%
DON’T KNOW
2%
DECREASE
33%
REMAIN THE SAME
5
© 2015 IPG Media Lab. Proprietary & Confidential
The intersection of video and data gives
advertisers the opportunity to create stories
that are relevant, and in fact, create multiple
sequential stories that address different
segments. One would almost argue that the
investment in content should be as much as, if
not more, than the investment in
programmatic media dollars.
5PHOTO: ExchangeWire.com
Arun Kumar
GLOBAL PRESIDENT, CADREON
Why the trend
6
© 2015 IPG Media Lab. Proprietary & Confidential
But, what is branded
content…exactly?
6
© 2015 IPG Media Lab. Proprietary & Confidential
7
© 2015 IPG Media Lab. Proprietary & Confidential
OUR DEFINITION:
Branded Content (noun):
Content that lives on its own, produced by and for the
brand, as opposed to content produced by someone else
that the brand affixes itself to.
7
© 2015 IPG Media Lab. Proprietary & Confidential
8
© 2015 IPG Media Lab. Proprietary & Confidential
Rather than asking marketers, we surveyed
14,780 consumers globally to learn what
branded content is, what they think about
it, and determine how effective it is.
8
© 2015 IPG Media Lab. Proprietary & Confidential
9
© 2015 IPG Media Lab. Proprietary & Confidential
9
© 2015 IPG Media Lab. Proprietary & Confidential
We sought to answer these questions:
What CONSUMERS think about branded content?
How is branded content perceived differently in different parts
of the world?
And, how does that translate into BRANDING EFFECTIVENESS?
10
© 2015 IPG Media Lab. Proprietary & Confidential
RECRUITED
PARTICIPANTS
In 10 countries from
representative
online panel (n=14,780)
1
2
GATHERED
DEMOGRAPHICS
Methodology
3
CONTENT/BRAND
INTERESTS
Matched to 1 of 5 test brands in
country based on content
interests
10
© 2015 IPG Media Lab. Proprietary & Confidential
11
© 2015 IPG Media Lab. Proprietary & Confidential
Methodology
3
CONTENT/BRAND
INTERESTS
Matched to 1 of 5 test brands in
country based on content
interests
4
SURVEYED
PARTICIPANTS
Brand Metrics
Message Perceptions
Brand Perceptions
Video Perceptions
11
RANDOMLY ASSIGNED TO TEST CELL
 Video hosted on mocked-up YouTube Page
 Videos and brands vary by country
BRANDED CONTENT
STANDARD VIDEO AD
CONTROL
© 2015 IPG Media Lab. Proprietary & Confidential
12
© 2015 IPG Media Lab. Proprietary & Confidential
What we tested
STANDARD VIDEO AD
Pre-roll ad for test brand followed
by video content
(ad lengths were typically
:30 sec or less)
BRANDED CONTENT
Video supplied by test brand that
they define as branded content
(average ad length was 130
seconds)
CONTROL
Video content without brand
mentions
13
© 2015 IPG Media Lab. Proprietary & Confidential
1
2
3
5
6
7
8
9
4
10
Where and who we tested
13
ALCOHOL
APPLIANCES
AUTOMOTIVE: CAR
AUTOMOTIVE: TIRES
BABY PRODUCTS
BEAUTY PRODUCTS
BEVERAGE
CLEANING PRODUCTS
CLOTHING
TELECOMMUNICATIONS
FINANCE
FOOD
HEALTH
OTC MEDICINE
PET FOOD
QUICK SERVICE RESTAURANTS
RETAIL
TOYS
TRAVEL
WE TESTED IN 10 COUNTRIES AND 19 VERTICALS:
VERTICALS
© 2015 IPG Media Lab. Proprietary & Confidential
14
© 2015 IPG Media Lab. Proprietary & Confidential
Where and who we tested
14
ALCOHOL
APPLIANCES
AUTOMOTIVE: CAR
AUTOMOTIVE: TIRES
BABY PRODUCTS
BEAUTY PRODUCTS
BEVERAGE
CLEANING PRODUCTS
CLOTHING
TELECOMMUNICATIONS
FINANCE
FOOD
HEALTH
OTC MEDICINE
PET FOOD
QUICK SERVICE RESTAURANTS
RETAIL
TOYS
TRAVEL
01
CHILE
02
COLOMBIA
03
DENMARK
04
ISRAEL
05
MALAYSIA
06
POLAND
07
PORTUGAL
08
THAILAND
09
TURKEY
10
UAE
WE TESTED IN 10 COUNTRIES AND 19 VERTICALS:
VERTICALS
© 2015 IPG Media Lab. Proprietary & Confidential
15
© 2015 IPG Media Lab. Proprietary & Confidential
Branded content works
▲=Statistically significant difference between Control and Branded Content at 90% confidence
Control n = 4,564; Branded Content n = 4,619
BRAND METRICS & PERCEPTIONS (%) BRANDED CONTENTCONTROL
METRICS PERCEPTIONS
26%
31%
39%
41%
31%
38%
48% 50%
45%
33%
41%
59%
42%
50%
Brand I would pay
more for
Brand offers
valuable info
Brand with a
personality
Brand I respectOverall favorability Purchase intent Recommendation
intent
▲
▲
▲
▲
▲
▲ ▲
16
© 2015 IPG Media Lab. Proprietary & Confidential
Do consumers know the difference?
16
© 2015 IPG Media Lab. Proprietary & Confidential
17
© 2015 IPG Media Lab. Proprietary & Confidential
ASIA
Thailand
Malaysia
EUROPE
Turkey
Poland
Portugal
Denmark
LATIN AMERICA
Colombia
Chile
MIDDLE EAST
UAE
Israel
Branded content also understood to be part of brands’ advertising strategies;
Perceptions vary by country
On the scale below, where does the video belong?
United States BC/Ad n=3,869/3,344; Denmark BC/Ad n = 501/497; Israel BC/Ad n = 282/282; UAE BC/Ad n = 355/326; Chile BC/Ad n = 509/506; Turkey BC/Ad n = 502/504; Colombia BC/Ad n = 505/509;
Malaysia BC/Ad n = 410/404; Poland BC/Ad n = 551/535; Portugal BC/Ad n = 504/504; Thailand BC/Ad n = 500/502 / ▲ = Statistically significant difference between Branded Content & Standard Video Ads at 90% confidence
*CONTENT MARKETING SCALE: Name for the question asked
CONTENT MARKETING SCORE*
ADVERTISING NOT ADVERTISING
AVG STANDARD VIDEO AD AVG BRANDED CONTENT
100 4020 30 50 7060 80 10090
UNITED STATES
18
© 2015 IPG Media Lab. Proprietary & Confidential
The Middle East is least discerning about branded content
On the scale below, where does the video belong?
CONTENT MARKETING SCORE*
ADVERTISING NOT ADVERTISING
ASIA
EUROPE
LATIN AMERICA
MIDDLE EAST
▲ = Statistically significant difference between Branded Content & Standard Video Ads at 90% confidence
Europe: Ad n=2,040; BC n=2,058; Asia: Ad n=906, BC n=910; Latin America: Ad n=1,015, BC n=1,014; Middle East: Ad n= 608, BC n=637
*CONTENT MARKETING SCALE: Name for the question asked
AVG STANDARD VIDEO AD AVG BRANDED CONTENT
100 4020 30 50 7060 80 10090
19
© 2015 IPG Media Lab. Proprietary & Confidential
CPG AUTO TELECOM FINANCE1 0 0
9 0
8 0
7 0
6 0
5 0
4 0
3 0
2 0
1 0
Opportunities in every category to tell story that makes branded content stand out
On the scale below, where does the video belong?
▲= Statistically significant difference between lowest score and highest score at 90% confidence
Auto BC n = 840; CPG BC n = 2,360; Finance BC n = 373; Telecom BC n = 443; *Included only categories with 3+ videos
CONTENT MARKETING SCORE*
NOT ADVERTISING
ADVERTISING
VIDEO WITH LOWEST SCORE VIDEO WITH HIGHEST SCORE
20
© 2015 IPG Media Lab. Proprietary & Confidential
Then, how exactly is branded
content different?
© 2015 IPG Media Lab. Proprietary & Confidential
21
© 2015 IPG Media Lab. Proprietary & Confidential
▲=Statistically significant difference between Branded Content and Standard Video Ads at 90% confidence
+ =Data showing Ad/Branded Content minus Branded Content/Ad / Standard Video Ads n = 4,569; Branded Content n = 4,619
Both considered marketing, just different types
Drag the two words that best describe the video you saw into the box.
How-To Video, +5%▲
Sponsored Show, +4%▲
Presentation, +3%▲
Brand Promotion, +3%▲
Entertainment, +3%▲
Advertising, +10%▲
IS MORE LIKE…ARE MORE LIKE…
22% MARKETING▲21% MARKETING
VIDEO CLASSIFICATION: MARKETING
BRANDED CONTENTSTANDARD VIDEO ADS
22
© 2015 IPG Media Lab. Proprietary & Confidential
Because consumers know it’s “marketing,” trust is the same
Drag and drop the following words into the boxes below. Was the video…
▲=Statistically significant difference between Branded Content and Standard Video Ads at 90% confidence
Standard Video Ads n=4,569, Branded Content n=4,619
70% 70%
STANDARD VIDEO ADS BRANDED CONTENT
BRANDED CONTENTSTANDARD VIDEO ADSTRUSTWORTHINESS (%)
23
© 2015 IPG Media Lab. Proprietary & Confidential
EDUCATIONAL NOVEL EXCITINGENTERTAINING UPLIFTING
But, branded content stimulates and provides depth
Drag and drop the following words into the boxes below.
WAS THE VIDEO…
61%
67%▲
46%
57%▲
45%
53%▲
45%
51%▲
42%
50%▲
▲=Statistically significant difference between Branded Content and Standard Video Ads at 90% confidence
Standard Video Ads n = 4,569; Branded Content n = 4,619 23
BRANDED CONTENTSTANDARD VIDEO ADS
© 2015 IPG Media Lab. Proprietary & Confidential
24
© 2015 IPG Media Lab. Proprietary & Confidential
Does the content marketing
scale really matter when it
comes to effectiveness?
© 2015 IPG Media Lab. Proprietary & Confidential
25
© 2015 IPG Media Lab. Proprietary & Confidential
ENTERTAINMENT SCORE (VIDEOS) LESS DIFFERENTIATED VIDEOS MORE DIFFERENTIATED VIDEOS
Aided brand recall +83%* +79%
Brand offers valuable information +3% +9%*
Brand with a personality +4% +10%*
Brand I would pay more for +2% +5%
Overall favorability +11% +14%
Recommendation intent +5% +10%*
Purchase intent +8% +11%
Yes! “Stand out” branded content more persuasive
+ =Data showing exposed minus control
* =Statistically significant difference of difference between Less and More Differentiated Videos at 90% confidence
Less (10 lowest videos on CMS): Control n=827; Branded Content n=820; More (40 highest videos on CMS): Control n=3,737; Branded Content n=3,799
BRANDED CONTENT:
BRAND METRIC DELTAS (BRANDED CONTENT – CONTROL) BY CONTENT MARKETING SCORE
VS
26
© 2015 IPG Media Lab. Proprietary & Confidential
LESS DIFFERENTIATED VIDEOS MORE DIFFERENTIATED VIDEOS
Aided brand recall +85%* +74%
Brand I respect +1% +7%*
Brand offers valuable information +1% +6%*
Brand that connects with me +3% +5%
Overall favorability +7% +9%
Purchase intent +5% +7%
Standard ads also more effective when not seen as strictly “advertising”
+ =Data showing exposed minus control
* =Statistically significant difference of difference between Less and More Differentiated Videos at 90% confidence
Less (10 lowest videos on CMS): Control n=957 Standard Video Ads n=952; More (40 highest videos on CMS): Control n=3,607; Standard Video Ads n=3,617
STANDARD VIDEO ADS:
BRAND METRIC DELTAS (STANDARD VIDEO AD – CONTROL) BY CONTENT MARKETING SCORE
VS
27
© 2015 IPG Media Lab. Proprietary & Confidential
Differentiated ads show
more than just product
and price
What do you think the brand's primary
intention was for creating the video you just
watched?
▲=Statistically significant difference between Less and More at 90% confidence
Less (10 lowest videos on CMS): Control n=957; Standard Video Ad n=952; More (40 highest videos on CMS): Control n=3,607; Standard Video Ad n=3,617
% of Consumers who said brand’s intention was
to sell a product
STANDARD VIDEO ADS
25%▲
19%
LESS DIFFERENTIATED
MORE DIFFERENTIATED
28
© 2015 IPG Media Lab. Proprietary & Confidential
How can branded content
be optimized?
28
© 2015 IPG Media Lab. Proprietary & Confidential
29
© 2015 IPG Media Lab. Proprietary & Confidential
A MARKETER’S GUIDE
WHAT
What type of content
should you create?
WHY
What should the intention
be for creating the video?
WHERE
Where should the content
be posted?
HOW
How often should the
brand be mentioned?
29
© 2015 IPG Media Lab. Proprietary & Confidential
30
© 2015 IPG Media Lab. Proprietary & Confidential
It’s worth spending the extra money and effort to create
high quality content
Along the following dimensions, what is your opinion of the video content you just watched? (Quality of video content)
WHAT
+7%▲
+1%
+10%▲
+4%▲ +4%▲
+11%▲*
+7%▲*
+16%▲*
+13%▲*
+14%▲*
BRAND WITH A PERSONALITY BRAND I WOULD PAY MORE
FOR
OVERALL FAVORABILITY RECOMMENDATION INTENT PURCHASE INTENT
HIGH QUALITYLOW QUALITYBRAND METRICS & PERCPTIONS (∆)
+ =Data showing exposed minus control
▲=Statistically significant difference between Control and Test (Low Quality/High Quality) at 90% confidence; *=statistically significant difference of difference at 90% confidence
Low Quality: Control n=1,910; Branded Content n=1,925; High Quality: Control n=2,654; Branded Content n=2,694
© 2015 IPG Media Lab. Proprietary & Confidential
30
31
© 2015 IPG Media Lab. Proprietary & Confidential
Drag and drop the following words into the boxes below. Was the video…
+ =Data showing exposed minus control
▲=Statistically significant difference between Less and More Differentiated Content at 90% confidence
Less (10 lowest videos on CMS) Branded Content n=820; More (40 highest videos on CMS) Branded Content n=3,799
WHAT
DIFFERENCE BETWEEN PERCEPTIONS OF DIFFERENTIATED BRANDED CONTENT
VS. LESS DIFFERENTIATED BRANDED CONTENT
Providing original entertainment is table stakes
ENTERTAINING, +5%▲
ORIGINAL, +1%
32
© 2015 IPG Media Lab. Proprietary & Confidential
Instead, create content that provides trustworthy
information
Drag and drop the following words into the boxes below. Was the video…
+ =Data showing exposed minus control
▲=Statistically significant difference between Less and More Differentiated Content at 90% confidence
Less (10 lowest videos on CMS) Branded Content n=820; More (40 highest videos on CMS) Branded Content n=3,799
WHAT
DIFFERENCE BETWEEN PERCEPTIONS OF DIFFERENTIATED BRANDED CONTENT
VS. LESS DIFFERENTIATED BRANDED CONTENT
ENTERTAINING, +5%▲
ORIGINAL, +1%
+24%▲
+28%▲
+22%▲
+30%▲EDUCATIONAL
INFORMATIVE
AUTHENTIC
TRUSTWORTHY
33
© 2015 IPG Media Lab. Proprietary & Confidential
In fact, producing entertaining videos is irrelevant to
performance of video
+ =Data showing exposed minus control
* =Statistically significant difference of difference between Less and More Entertaining Videos at 90% confidence
25 Less Entertaining Videos: Control n=2,266; Branded Content n=2,307; 25 More Entertaining Videos: Control n=2,298; Branded Content n=2,312
WHAT
ENTERTAINMENT SCORE (VIDEOS) LESS ENTERTAINING MORE ENTERTAINING
Brand I respect +10% +8%
Brand that creates quality products +8% +8%
Brand offers valuable information +8% +8%
Brand with a personality +7% +10%
Overall favorability +16%* +11%
Recommendation intent +9% +11%
Purchase intent +9% +9%
VS
BRANDED CONTENT:
BRAND METRIC DELTAS (BRANDED CONTENT – CONTROL) BY ENTERTAINMENT SCORE
34
© 2015 IPG Media Lab. Proprietary & Confidential
TRUST SCORE
But, providing trustworthy information
= higher performance
* =Statistically significant difference of difference between Less and More Trustworthy/Informative Videos at 90% confidence / + =Data showing exposed minus control
25 Less Trust/Informative Videos: Control n=2,230/2,212; Branded Content n=2,249/2,227; / 25 More Trust/Informative Videos: Control n=2,334/2,352; Branded Content n=2,370/2,392
WHAT
VIDEOS LESS MORE
Brand I respect +5% +13%*
Brand that creates quality products +6% +11%*
Brand that connects with me +2% +9%*
Overall Favorability +9% +18%*
Recommendation Intent +5% +13%*
Purchase Intent +5% +15%*
INFORMATIVE SCORE
VIDEOS LESS MORE
Brand I respect +7% +11%*
Brand that creates quality products +5% +11%*
Brand that connects with me +3% +8%*
Overall Favorability +11% +16%*
Recommendation Intent +6% +12%*
Purchase Intent +6% +14%*
BRANDED CONTENT:
BRAND METRIC DELTAS (BRANDED CONTENT – CONTROL)
35
© 2015 IPG Media Lab. Proprietary & Confidential
34%
20%
22%
12%
5% 5% 2%
26% 18%
25%
14%
6% 2%
10%
Standard Video Ads = Brand-centric education
Branded Content = Consumer-centric education
Standard Video Ads n = 4,569; Branded Content n = 4,619
WHY
WHAT DO YOU THINK THE BRAND'S PRIMARY INTENTION WAS FOR
CREATING THE VIDEO YOU JUST WATCHED?
To inform people about their products and services
To sell a specific product
To stand out from other companies offering similar products and services
To be perceived as relevant to their customers
To educate people
To entertain
Other
BRANDED CONTENT STANDARD VIDEO ADS
36
Nuts and bolts of testing branding levels
Determined how level of
branding effects perceptions and
effectiveness of branded content
SCIENTIFICALLY TESTED
5 COUNTRIES
Included countries with editable
high-branding videos
Chile, Colombia, Poland,
Portugal, Thailand
TEST CELLS
Branded Content – High Branding:
Content supplied by participating
brands
Branded Content – Low Branding:
Edited original branded content to
include ½ of original branding
VIDEO EDITING
Removed approximately ½ of
branding mentions to make video
with low branding
© 2015 IPG Media Lab. Proprietary & Confidential
HOW
37
© 2015 IPG Media Lab. Proprietary & Confidential
Regardless of level of branding, similar recall
Control n = 514; Branding Content - Low Branding n = 524; Branding Content – High Branding n = 515
▲=Statistically significant difference between Control and Test (Low/High) at 90% confidence
▲=Statistically significant difference between Low and High Branding at 90% confidence
BRAND RECALL (%)
0%
91%▲
89%▲
UNAIDED BRAND
RECALL
HOW
BRANDED CONTENT - HIGHBRANDED CONTENT - LOWCONTROL
38
© 2015 IPG Media Lab. Proprietary & Confidential
But, more branding = stronger impact
Control n = 514; Branding Content - Low Branding n = 524; Branding Content – High Branding n = 515
▲=Statistically significant difference between Control and Test (Low/High) at 90% confidence
▲=Statistically significant difference between Low and High Branding at 90% confidence
52%
64%▲▲
61%▲
BRAND
I RESPECT
BRAND METRICS & PERCEPTIONS (%)
54%
64%▲▲
60%▲
BRAND WITH
A PERSONALITY
44%
58%▲▲
55%▲
PURCHASE
INTENT
HOW
BRANDED CONTENT - HIGHBRANDED CONTENT - LOWCONTROL
39
© 2015 IPG Media Lab. Proprietary & Confidential
Content with high branding more like product pitch, but
more informative and equally trustworthy
HOW
11%
17%▲
78% 78%
71%
76%▲
SELL A SPECIFIC PRODUCT TRUSTWORTHY INFORMATIVE
PERCEPTIONS OF THE VIDEO (%) BRANDED CONTENT – HIGHBRANDED CONTENT – LOW
▲=Statistically significant difference between High Branding & Low Branding at 90% confidence
Branding Content - Low Branding n = 524; Branding Content – High Branding n = 515
40
© 2015 IPG Media Lab. Proprietary & Confidential
With costly purchases, ensure adequate branding to
emphasize brand connection
▲=Statistically significant difference between Control and High Branding/Low Branding at 90% confidence / + =Data showing exposed minus control
(High Consideration) Control n = 213; Branded Content – Low Branding n = 209; Branded Content – High Branding n = 219; (Low Consideration) Control n = 302; Branded Content – Low Branding n = 315; Branded Content – High branding n = 297
HOW
OVERALL FAVORABILITY
BRAND METRICS (%) BRANDED CONTENT – HIGHBRANDED CONTENT – LOW
$ $$$$ $ $$$$
PURCHASE INTENT
+15%▲
+16%▲
+13%▲
+15%▲
+13%▲
+7%
+3%
+13%▲
41
Understand how the platform
where branded contest is posted
effects perceptions and
effectiveness
SCIENTIFICALLY TESTED
2 COUNTRIES
Tested in markets with
comparable competitor to
YouTube
Thailand & Malaysia
COMPETITOR TEST
CELLS
Control – Competitor Platform:
Video without brand mentions
hosted on mock competitor page
Branded Content – Competitor
Platform: Branded content hosted
on mock competitor page
© 2015 IPG Media Lab. Proprietary & Confidential
Nuts and bolts of testing site placementWHERE
Control: Video without brand
mentions hosted on mock
YouTube page
Branded Content: Branded content
hosted on mock YouTube page
42
© 2015 IPG Media Lab. Proprietary & Confidential
While no difference for overall opinion, premium sites can
have a halo effect on preference and intent
WHERE
BRAND METRICS & PERCEPTIONS (∆)
+11%▲
+5%
+0%
+2%
+13%▲
+8%▲ +8%▲*
+10%▲*
OVERALL FAVORABILITY RECOMMENDATION INTENT BRAND I PREFER PURCHASE INTENT
BRANDED CONTENT - COMPETITOR SITE BRANDED CONTENT – YOUTUBE.COM
© 2015 IPG Media Lab. Proprietary & Confidential
42
+ =Data showing exposed minus control
▲=Statistically significant difference between Control and Test (YouTube/Competitor site) at 90% confidence; *=Statistically significant difference of difference between YouTube.com and Competitor site at 85% confidence
YouTube.com: Control n = 875, Branded Content n = 910; Competitor Site: Control n = 260, Branded Content n = 251
43
© 2015 IPG Media Lab. Proprietary & Confidential
People’s love for YouTube improves brand metrics
+ =Data showing exposed minus control
Branded Content: Ok (1-4) n = 193; Like (5) n = 560; Love (6) n= 984; Adore (7) n = 2,002; Control: Ok (1-4) n =211; Like (5) n = 573; Love (6) n= 941; Adore (7) n = 1,976
*Excluded 9 brands that had unequal distribution of opinions across 4 cells
WHERE
OPINIONS OF
5%
IT’S OKAY
15% LIKE
54% ADORE
26% LOVE
BRANDED CONTENT:
Persuasion/Perception Metrics (∆) by Opinions of YouTube
-10%
0%
10%
20%
-4%
-1%
+5%▲
+8%
▲
BRAND THAT CONNECTS
+2%
+7%▲
+16%
▲
+15%
▲
OVERALL FAVORABILTY
-3%
+5%▲
+10▲
+13%
▲
PURCHASE INTENT
44
© 2015 IPG Media Lab. Proprietary & Confidential
Opportunity To Differentiate Further
Be creative – The sky is the limit!
On the scale below where does the video belong?
Branded Content n = 4,619
ADVERTISING NOT ADVERTISING
CONTENT MARKETING SCORE
23.9 DIFFERENTIATION SCORE:
BRANDED CONTENT
45
© 2015 IPG Media Lab. Proprietary & Confidential
Marketer Go Do’s
LOCATION
Location, Location, Location
- place content on premium
sites
INFORMATION
Branded content is more than
providing entertainment.
Provide valuable information
to your consumers
BRANDING
Don’t be afraid to
incorporate branding,
especially for high
consideration brands
Spend the extra money to
make high quality content
– it’s worth it
SPEND
46
© 2015 IPG Media Lab. Proprietary & Confidential
Answers lead to more questions…
46
© 2015 IPG Media Lab. Proprietary & Confidential
47
© 2015 IPG Media Lab. Proprietary & Confidential
SO WHAT’S NEXT?
Does running branded content as a pre-roll influence perceptions and/or effectiveness?
When branded content is run as pre-roll, does the content that follows impact
effectiveness?
Is creating “mini” versions of branded content for pre-roll an effective strategy?
Does including “influencers” in branded content create a bigger impact?
How long with it last? As long as this influencer culture lasts?
47
© 2015 IPG Media Lab. Proprietary & Confidential
48
© 2015 IPG Media Lab. Proprietary & Confidential
Please contact Kara Manatt for questions: kara.manatt@ipglab.com
THANK YOU!
49
© 2015 IPG Media Lab. Proprietary & Confidential
APPENDIX
© 2015 IPG Media Lab. Proprietary & Confidential
50
© 2015 IPG Media Lab. Proprietary & Confidential
BRAND SURVEY QUESTIONS
BRAND METRICS:
Unaided Brand Recall: Thinking about the video you just viewed, which brands do you recall being mentioned or shown? If
you are not sure, you may guess or leave it blank
Overall Favorability: How would you describe your overall opinion of each of the following brands?
Purchase Intent (varies by category): Have likely are you to purchase/consider purchasing/consider switching to each of the
following brands within the next month/3months/6months?
Recommendation Intent: How likely are you to recommend the following brands to a friend, family member, or colleague?
BRAND PERCEPTIONS:
Please indicate how much you agree of disagree with each of the following statements about the following brand.
Brand I would pay more for: <Brand> is worth paying more for
Brand I respect: <Brand> is a brand I respect
Brand that creates quality products: <Brand> creates quality products
Brand offers valuable information: <Brand> offers valuable information
Brand I prefer: <Brand> is a brand I prefer
Brand that connects with me: <Brand> is a brand that connects with me
Brand with a personality: <Brand> is a brand with a personality

Deconstructing Branded Content: The Global Guide To What Works

  • 1.
    1 © 2015 IPGMedia Lab. Proprietary & Confidential THE GLOBAL GUIDE TO WHAT WORKS DECONSTRUCTING BRANDED CONTENT
  • 2.
    2 © 2015 IPGMedia Lab. Proprietary & Confidential Video viewing is shifting to digital, especially among millennials 34% 37% 40% 42% 44% 45% 20% 22% 24% 25% 26% 27% MILLENNIALS (18-34) ADULTS 35-64DIGITAL VIDEO VIEWING: Percentage of Total Video Viewing by Age Group DigitalVideo/TotalVideoHoursPerWeek 2014 2015 2016 2017 2018 2019 *Source: Nielsen, ComScore, MAGNA GLOBAL estimates US Data 2 © 2015 IPG Media Lab. Proprietary & Confidential 2014 2015 2016 2017 2018 2019
  • 3.
    3 © 2015 IPGMedia Lab. Proprietary & Confidential …And it’s ubiquitous 01 CHILE 02 COLOMBIA 03 DENMARK 04 ISRAEL 05 MALAYSIA 06 POLAND 07 PORTUGAL 08 THAILAND 09 TURKEY 10 UAE % OF PEOPLE WHO HAVE WATCHED ONLINE VIDEO WITHIN PAST 6 MONTHS *Source: WAVE; UM Global Survey 3 90% 90% 89% 93% 82% 88% 93% 91% 31% 86% © 2015 IPG Media Lab. Proprietary & Confidential
  • 4.
    4 © 2015 IPGMedia Lab. Proprietary & Confidential Brands are following suit and building content to tell their stories EXPECTED CHANGE IN CONTENT MARKETING BUDGET According to Business Professionals in Denmark *Source: www.eMarketer.com; Brand Movers, “Content Marketing i Danmark 2015” in conjunction with Huset Markedsforing, March 26, 2015 6% SIGNIFICANT INCREASE 44% INCREASE 15% DON’T KNOW 2% DECREASE 33% REMAIN THE SAME
  • 5.
    5 © 2015 IPGMedia Lab. Proprietary & Confidential The intersection of video and data gives advertisers the opportunity to create stories that are relevant, and in fact, create multiple sequential stories that address different segments. One would almost argue that the investment in content should be as much as, if not more, than the investment in programmatic media dollars. 5PHOTO: ExchangeWire.com Arun Kumar GLOBAL PRESIDENT, CADREON Why the trend
  • 6.
    6 © 2015 IPGMedia Lab. Proprietary & Confidential But, what is branded content…exactly? 6 © 2015 IPG Media Lab. Proprietary & Confidential
  • 7.
    7 © 2015 IPGMedia Lab. Proprietary & Confidential OUR DEFINITION: Branded Content (noun): Content that lives on its own, produced by and for the brand, as opposed to content produced by someone else that the brand affixes itself to. 7 © 2015 IPG Media Lab. Proprietary & Confidential
  • 8.
    8 © 2015 IPGMedia Lab. Proprietary & Confidential Rather than asking marketers, we surveyed 14,780 consumers globally to learn what branded content is, what they think about it, and determine how effective it is. 8 © 2015 IPG Media Lab. Proprietary & Confidential
  • 9.
    9 © 2015 IPGMedia Lab. Proprietary & Confidential 9 © 2015 IPG Media Lab. Proprietary & Confidential We sought to answer these questions: What CONSUMERS think about branded content? How is branded content perceived differently in different parts of the world? And, how does that translate into BRANDING EFFECTIVENESS?
  • 10.
    10 © 2015 IPGMedia Lab. Proprietary & Confidential RECRUITED PARTICIPANTS In 10 countries from representative online panel (n=14,780) 1 2 GATHERED DEMOGRAPHICS Methodology 3 CONTENT/BRAND INTERESTS Matched to 1 of 5 test brands in country based on content interests 10 © 2015 IPG Media Lab. Proprietary & Confidential
  • 11.
    11 © 2015 IPGMedia Lab. Proprietary & Confidential Methodology 3 CONTENT/BRAND INTERESTS Matched to 1 of 5 test brands in country based on content interests 4 SURVEYED PARTICIPANTS Brand Metrics Message Perceptions Brand Perceptions Video Perceptions 11 RANDOMLY ASSIGNED TO TEST CELL  Video hosted on mocked-up YouTube Page  Videos and brands vary by country BRANDED CONTENT STANDARD VIDEO AD CONTROL © 2015 IPG Media Lab. Proprietary & Confidential
  • 12.
    12 © 2015 IPGMedia Lab. Proprietary & Confidential What we tested STANDARD VIDEO AD Pre-roll ad for test brand followed by video content (ad lengths were typically :30 sec or less) BRANDED CONTENT Video supplied by test brand that they define as branded content (average ad length was 130 seconds) CONTROL Video content without brand mentions
  • 13.
    13 © 2015 IPGMedia Lab. Proprietary & Confidential 1 2 3 5 6 7 8 9 4 10 Where and who we tested 13 ALCOHOL APPLIANCES AUTOMOTIVE: CAR AUTOMOTIVE: TIRES BABY PRODUCTS BEAUTY PRODUCTS BEVERAGE CLEANING PRODUCTS CLOTHING TELECOMMUNICATIONS FINANCE FOOD HEALTH OTC MEDICINE PET FOOD QUICK SERVICE RESTAURANTS RETAIL TOYS TRAVEL WE TESTED IN 10 COUNTRIES AND 19 VERTICALS: VERTICALS © 2015 IPG Media Lab. Proprietary & Confidential
  • 14.
    14 © 2015 IPGMedia Lab. Proprietary & Confidential Where and who we tested 14 ALCOHOL APPLIANCES AUTOMOTIVE: CAR AUTOMOTIVE: TIRES BABY PRODUCTS BEAUTY PRODUCTS BEVERAGE CLEANING PRODUCTS CLOTHING TELECOMMUNICATIONS FINANCE FOOD HEALTH OTC MEDICINE PET FOOD QUICK SERVICE RESTAURANTS RETAIL TOYS TRAVEL 01 CHILE 02 COLOMBIA 03 DENMARK 04 ISRAEL 05 MALAYSIA 06 POLAND 07 PORTUGAL 08 THAILAND 09 TURKEY 10 UAE WE TESTED IN 10 COUNTRIES AND 19 VERTICALS: VERTICALS © 2015 IPG Media Lab. Proprietary & Confidential
  • 15.
    15 © 2015 IPGMedia Lab. Proprietary & Confidential Branded content works ▲=Statistically significant difference between Control and Branded Content at 90% confidence Control n = 4,564; Branded Content n = 4,619 BRAND METRICS & PERCEPTIONS (%) BRANDED CONTENTCONTROL METRICS PERCEPTIONS 26% 31% 39% 41% 31% 38% 48% 50% 45% 33% 41% 59% 42% 50% Brand I would pay more for Brand offers valuable info Brand with a personality Brand I respectOverall favorability Purchase intent Recommendation intent ▲ ▲ ▲ ▲ ▲ ▲ ▲
  • 16.
    16 © 2015 IPGMedia Lab. Proprietary & Confidential Do consumers know the difference? 16 © 2015 IPG Media Lab. Proprietary & Confidential
  • 17.
    17 © 2015 IPGMedia Lab. Proprietary & Confidential ASIA Thailand Malaysia EUROPE Turkey Poland Portugal Denmark LATIN AMERICA Colombia Chile MIDDLE EAST UAE Israel Branded content also understood to be part of brands’ advertising strategies; Perceptions vary by country On the scale below, where does the video belong? United States BC/Ad n=3,869/3,344; Denmark BC/Ad n = 501/497; Israel BC/Ad n = 282/282; UAE BC/Ad n = 355/326; Chile BC/Ad n = 509/506; Turkey BC/Ad n = 502/504; Colombia BC/Ad n = 505/509; Malaysia BC/Ad n = 410/404; Poland BC/Ad n = 551/535; Portugal BC/Ad n = 504/504; Thailand BC/Ad n = 500/502 / ▲ = Statistically significant difference between Branded Content & Standard Video Ads at 90% confidence *CONTENT MARKETING SCALE: Name for the question asked CONTENT MARKETING SCORE* ADVERTISING NOT ADVERTISING AVG STANDARD VIDEO AD AVG BRANDED CONTENT 100 4020 30 50 7060 80 10090 UNITED STATES
  • 18.
    18 © 2015 IPGMedia Lab. Proprietary & Confidential The Middle East is least discerning about branded content On the scale below, where does the video belong? CONTENT MARKETING SCORE* ADVERTISING NOT ADVERTISING ASIA EUROPE LATIN AMERICA MIDDLE EAST ▲ = Statistically significant difference between Branded Content & Standard Video Ads at 90% confidence Europe: Ad n=2,040; BC n=2,058; Asia: Ad n=906, BC n=910; Latin America: Ad n=1,015, BC n=1,014; Middle East: Ad n= 608, BC n=637 *CONTENT MARKETING SCALE: Name for the question asked AVG STANDARD VIDEO AD AVG BRANDED CONTENT 100 4020 30 50 7060 80 10090
  • 19.
    19 © 2015 IPGMedia Lab. Proprietary & Confidential CPG AUTO TELECOM FINANCE1 0 0 9 0 8 0 7 0 6 0 5 0 4 0 3 0 2 0 1 0 Opportunities in every category to tell story that makes branded content stand out On the scale below, where does the video belong? ▲= Statistically significant difference between lowest score and highest score at 90% confidence Auto BC n = 840; CPG BC n = 2,360; Finance BC n = 373; Telecom BC n = 443; *Included only categories with 3+ videos CONTENT MARKETING SCORE* NOT ADVERTISING ADVERTISING VIDEO WITH LOWEST SCORE VIDEO WITH HIGHEST SCORE
  • 20.
    20 © 2015 IPGMedia Lab. Proprietary & Confidential Then, how exactly is branded content different? © 2015 IPG Media Lab. Proprietary & Confidential
  • 21.
    21 © 2015 IPGMedia Lab. Proprietary & Confidential ▲=Statistically significant difference between Branded Content and Standard Video Ads at 90% confidence + =Data showing Ad/Branded Content minus Branded Content/Ad / Standard Video Ads n = 4,569; Branded Content n = 4,619 Both considered marketing, just different types Drag the two words that best describe the video you saw into the box. How-To Video, +5%▲ Sponsored Show, +4%▲ Presentation, +3%▲ Brand Promotion, +3%▲ Entertainment, +3%▲ Advertising, +10%▲ IS MORE LIKE…ARE MORE LIKE… 22% MARKETING▲21% MARKETING VIDEO CLASSIFICATION: MARKETING BRANDED CONTENTSTANDARD VIDEO ADS
  • 22.
    22 © 2015 IPGMedia Lab. Proprietary & Confidential Because consumers know it’s “marketing,” trust is the same Drag and drop the following words into the boxes below. Was the video… ▲=Statistically significant difference between Branded Content and Standard Video Ads at 90% confidence Standard Video Ads n=4,569, Branded Content n=4,619 70% 70% STANDARD VIDEO ADS BRANDED CONTENT BRANDED CONTENTSTANDARD VIDEO ADSTRUSTWORTHINESS (%)
  • 23.
    23 © 2015 IPGMedia Lab. Proprietary & Confidential EDUCATIONAL NOVEL EXCITINGENTERTAINING UPLIFTING But, branded content stimulates and provides depth Drag and drop the following words into the boxes below. WAS THE VIDEO… 61% 67%▲ 46% 57%▲ 45% 53%▲ 45% 51%▲ 42% 50%▲ ▲=Statistically significant difference between Branded Content and Standard Video Ads at 90% confidence Standard Video Ads n = 4,569; Branded Content n = 4,619 23 BRANDED CONTENTSTANDARD VIDEO ADS © 2015 IPG Media Lab. Proprietary & Confidential
  • 24.
    24 © 2015 IPGMedia Lab. Proprietary & Confidential Does the content marketing scale really matter when it comes to effectiveness? © 2015 IPG Media Lab. Proprietary & Confidential
  • 25.
    25 © 2015 IPGMedia Lab. Proprietary & Confidential ENTERTAINMENT SCORE (VIDEOS) LESS DIFFERENTIATED VIDEOS MORE DIFFERENTIATED VIDEOS Aided brand recall +83%* +79% Brand offers valuable information +3% +9%* Brand with a personality +4% +10%* Brand I would pay more for +2% +5% Overall favorability +11% +14% Recommendation intent +5% +10%* Purchase intent +8% +11% Yes! “Stand out” branded content more persuasive + =Data showing exposed minus control * =Statistically significant difference of difference between Less and More Differentiated Videos at 90% confidence Less (10 lowest videos on CMS): Control n=827; Branded Content n=820; More (40 highest videos on CMS): Control n=3,737; Branded Content n=3,799 BRANDED CONTENT: BRAND METRIC DELTAS (BRANDED CONTENT – CONTROL) BY CONTENT MARKETING SCORE VS
  • 26.
    26 © 2015 IPGMedia Lab. Proprietary & Confidential LESS DIFFERENTIATED VIDEOS MORE DIFFERENTIATED VIDEOS Aided brand recall +85%* +74% Brand I respect +1% +7%* Brand offers valuable information +1% +6%* Brand that connects with me +3% +5% Overall favorability +7% +9% Purchase intent +5% +7% Standard ads also more effective when not seen as strictly “advertising” + =Data showing exposed minus control * =Statistically significant difference of difference between Less and More Differentiated Videos at 90% confidence Less (10 lowest videos on CMS): Control n=957 Standard Video Ads n=952; More (40 highest videos on CMS): Control n=3,607; Standard Video Ads n=3,617 STANDARD VIDEO ADS: BRAND METRIC DELTAS (STANDARD VIDEO AD – CONTROL) BY CONTENT MARKETING SCORE VS
  • 27.
    27 © 2015 IPGMedia Lab. Proprietary & Confidential Differentiated ads show more than just product and price What do you think the brand's primary intention was for creating the video you just watched? ▲=Statistically significant difference between Less and More at 90% confidence Less (10 lowest videos on CMS): Control n=957; Standard Video Ad n=952; More (40 highest videos on CMS): Control n=3,607; Standard Video Ad n=3,617 % of Consumers who said brand’s intention was to sell a product STANDARD VIDEO ADS 25%▲ 19% LESS DIFFERENTIATED MORE DIFFERENTIATED
  • 28.
    28 © 2015 IPGMedia Lab. Proprietary & Confidential How can branded content be optimized? 28 © 2015 IPG Media Lab. Proprietary & Confidential
  • 29.
    29 © 2015 IPGMedia Lab. Proprietary & Confidential A MARKETER’S GUIDE WHAT What type of content should you create? WHY What should the intention be for creating the video? WHERE Where should the content be posted? HOW How often should the brand be mentioned? 29 © 2015 IPG Media Lab. Proprietary & Confidential
  • 30.
    30 © 2015 IPGMedia Lab. Proprietary & Confidential It’s worth spending the extra money and effort to create high quality content Along the following dimensions, what is your opinion of the video content you just watched? (Quality of video content) WHAT +7%▲ +1% +10%▲ +4%▲ +4%▲ +11%▲* +7%▲* +16%▲* +13%▲* +14%▲* BRAND WITH A PERSONALITY BRAND I WOULD PAY MORE FOR OVERALL FAVORABILITY RECOMMENDATION INTENT PURCHASE INTENT HIGH QUALITYLOW QUALITYBRAND METRICS & PERCPTIONS (∆) + =Data showing exposed minus control ▲=Statistically significant difference between Control and Test (Low Quality/High Quality) at 90% confidence; *=statistically significant difference of difference at 90% confidence Low Quality: Control n=1,910; Branded Content n=1,925; High Quality: Control n=2,654; Branded Content n=2,694 © 2015 IPG Media Lab. Proprietary & Confidential 30
  • 31.
    31 © 2015 IPGMedia Lab. Proprietary & Confidential Drag and drop the following words into the boxes below. Was the video… + =Data showing exposed minus control ▲=Statistically significant difference between Less and More Differentiated Content at 90% confidence Less (10 lowest videos on CMS) Branded Content n=820; More (40 highest videos on CMS) Branded Content n=3,799 WHAT DIFFERENCE BETWEEN PERCEPTIONS OF DIFFERENTIATED BRANDED CONTENT VS. LESS DIFFERENTIATED BRANDED CONTENT Providing original entertainment is table stakes ENTERTAINING, +5%▲ ORIGINAL, +1%
  • 32.
    32 © 2015 IPGMedia Lab. Proprietary & Confidential Instead, create content that provides trustworthy information Drag and drop the following words into the boxes below. Was the video… + =Data showing exposed minus control ▲=Statistically significant difference between Less and More Differentiated Content at 90% confidence Less (10 lowest videos on CMS) Branded Content n=820; More (40 highest videos on CMS) Branded Content n=3,799 WHAT DIFFERENCE BETWEEN PERCEPTIONS OF DIFFERENTIATED BRANDED CONTENT VS. LESS DIFFERENTIATED BRANDED CONTENT ENTERTAINING, +5%▲ ORIGINAL, +1% +24%▲ +28%▲ +22%▲ +30%▲EDUCATIONAL INFORMATIVE AUTHENTIC TRUSTWORTHY
  • 33.
    33 © 2015 IPGMedia Lab. Proprietary & Confidential In fact, producing entertaining videos is irrelevant to performance of video + =Data showing exposed minus control * =Statistically significant difference of difference between Less and More Entertaining Videos at 90% confidence 25 Less Entertaining Videos: Control n=2,266; Branded Content n=2,307; 25 More Entertaining Videos: Control n=2,298; Branded Content n=2,312 WHAT ENTERTAINMENT SCORE (VIDEOS) LESS ENTERTAINING MORE ENTERTAINING Brand I respect +10% +8% Brand that creates quality products +8% +8% Brand offers valuable information +8% +8% Brand with a personality +7% +10% Overall favorability +16%* +11% Recommendation intent +9% +11% Purchase intent +9% +9% VS BRANDED CONTENT: BRAND METRIC DELTAS (BRANDED CONTENT – CONTROL) BY ENTERTAINMENT SCORE
  • 34.
    34 © 2015 IPGMedia Lab. Proprietary & Confidential TRUST SCORE But, providing trustworthy information = higher performance * =Statistically significant difference of difference between Less and More Trustworthy/Informative Videos at 90% confidence / + =Data showing exposed minus control 25 Less Trust/Informative Videos: Control n=2,230/2,212; Branded Content n=2,249/2,227; / 25 More Trust/Informative Videos: Control n=2,334/2,352; Branded Content n=2,370/2,392 WHAT VIDEOS LESS MORE Brand I respect +5% +13%* Brand that creates quality products +6% +11%* Brand that connects with me +2% +9%* Overall Favorability +9% +18%* Recommendation Intent +5% +13%* Purchase Intent +5% +15%* INFORMATIVE SCORE VIDEOS LESS MORE Brand I respect +7% +11%* Brand that creates quality products +5% +11%* Brand that connects with me +3% +8%* Overall Favorability +11% +16%* Recommendation Intent +6% +12%* Purchase Intent +6% +14%* BRANDED CONTENT: BRAND METRIC DELTAS (BRANDED CONTENT – CONTROL)
  • 35.
    35 © 2015 IPGMedia Lab. Proprietary & Confidential 34% 20% 22% 12% 5% 5% 2% 26% 18% 25% 14% 6% 2% 10% Standard Video Ads = Brand-centric education Branded Content = Consumer-centric education Standard Video Ads n = 4,569; Branded Content n = 4,619 WHY WHAT DO YOU THINK THE BRAND'S PRIMARY INTENTION WAS FOR CREATING THE VIDEO YOU JUST WATCHED? To inform people about their products and services To sell a specific product To stand out from other companies offering similar products and services To be perceived as relevant to their customers To educate people To entertain Other BRANDED CONTENT STANDARD VIDEO ADS
  • 36.
    36 Nuts and boltsof testing branding levels Determined how level of branding effects perceptions and effectiveness of branded content SCIENTIFICALLY TESTED 5 COUNTRIES Included countries with editable high-branding videos Chile, Colombia, Poland, Portugal, Thailand TEST CELLS Branded Content – High Branding: Content supplied by participating brands Branded Content – Low Branding: Edited original branded content to include ½ of original branding VIDEO EDITING Removed approximately ½ of branding mentions to make video with low branding © 2015 IPG Media Lab. Proprietary & Confidential HOW
  • 37.
    37 © 2015 IPGMedia Lab. Proprietary & Confidential Regardless of level of branding, similar recall Control n = 514; Branding Content - Low Branding n = 524; Branding Content – High Branding n = 515 ▲=Statistically significant difference between Control and Test (Low/High) at 90% confidence ▲=Statistically significant difference between Low and High Branding at 90% confidence BRAND RECALL (%) 0% 91%▲ 89%▲ UNAIDED BRAND RECALL HOW BRANDED CONTENT - HIGHBRANDED CONTENT - LOWCONTROL
  • 38.
    38 © 2015 IPGMedia Lab. Proprietary & Confidential But, more branding = stronger impact Control n = 514; Branding Content - Low Branding n = 524; Branding Content – High Branding n = 515 ▲=Statistically significant difference between Control and Test (Low/High) at 90% confidence ▲=Statistically significant difference between Low and High Branding at 90% confidence 52% 64%▲▲ 61%▲ BRAND I RESPECT BRAND METRICS & PERCEPTIONS (%) 54% 64%▲▲ 60%▲ BRAND WITH A PERSONALITY 44% 58%▲▲ 55%▲ PURCHASE INTENT HOW BRANDED CONTENT - HIGHBRANDED CONTENT - LOWCONTROL
  • 39.
    39 © 2015 IPGMedia Lab. Proprietary & Confidential Content with high branding more like product pitch, but more informative and equally trustworthy HOW 11% 17%▲ 78% 78% 71% 76%▲ SELL A SPECIFIC PRODUCT TRUSTWORTHY INFORMATIVE PERCEPTIONS OF THE VIDEO (%) BRANDED CONTENT – HIGHBRANDED CONTENT – LOW ▲=Statistically significant difference between High Branding & Low Branding at 90% confidence Branding Content - Low Branding n = 524; Branding Content – High Branding n = 515
  • 40.
    40 © 2015 IPGMedia Lab. Proprietary & Confidential With costly purchases, ensure adequate branding to emphasize brand connection ▲=Statistically significant difference between Control and High Branding/Low Branding at 90% confidence / + =Data showing exposed minus control (High Consideration) Control n = 213; Branded Content – Low Branding n = 209; Branded Content – High Branding n = 219; (Low Consideration) Control n = 302; Branded Content – Low Branding n = 315; Branded Content – High branding n = 297 HOW OVERALL FAVORABILITY BRAND METRICS (%) BRANDED CONTENT – HIGHBRANDED CONTENT – LOW $ $$$$ $ $$$$ PURCHASE INTENT +15%▲ +16%▲ +13%▲ +15%▲ +13%▲ +7% +3% +13%▲
  • 41.
    41 Understand how theplatform where branded contest is posted effects perceptions and effectiveness SCIENTIFICALLY TESTED 2 COUNTRIES Tested in markets with comparable competitor to YouTube Thailand & Malaysia COMPETITOR TEST CELLS Control – Competitor Platform: Video without brand mentions hosted on mock competitor page Branded Content – Competitor Platform: Branded content hosted on mock competitor page © 2015 IPG Media Lab. Proprietary & Confidential Nuts and bolts of testing site placementWHERE Control: Video without brand mentions hosted on mock YouTube page Branded Content: Branded content hosted on mock YouTube page
  • 42.
    42 © 2015 IPGMedia Lab. Proprietary & Confidential While no difference for overall opinion, premium sites can have a halo effect on preference and intent WHERE BRAND METRICS & PERCEPTIONS (∆) +11%▲ +5% +0% +2% +13%▲ +8%▲ +8%▲* +10%▲* OVERALL FAVORABILITY RECOMMENDATION INTENT BRAND I PREFER PURCHASE INTENT BRANDED CONTENT - COMPETITOR SITE BRANDED CONTENT – YOUTUBE.COM © 2015 IPG Media Lab. Proprietary & Confidential 42 + =Data showing exposed minus control ▲=Statistically significant difference between Control and Test (YouTube/Competitor site) at 90% confidence; *=Statistically significant difference of difference between YouTube.com and Competitor site at 85% confidence YouTube.com: Control n = 875, Branded Content n = 910; Competitor Site: Control n = 260, Branded Content n = 251
  • 43.
    43 © 2015 IPGMedia Lab. Proprietary & Confidential People’s love for YouTube improves brand metrics + =Data showing exposed minus control Branded Content: Ok (1-4) n = 193; Like (5) n = 560; Love (6) n= 984; Adore (7) n = 2,002; Control: Ok (1-4) n =211; Like (5) n = 573; Love (6) n= 941; Adore (7) n = 1,976 *Excluded 9 brands that had unequal distribution of opinions across 4 cells WHERE OPINIONS OF 5% IT’S OKAY 15% LIKE 54% ADORE 26% LOVE BRANDED CONTENT: Persuasion/Perception Metrics (∆) by Opinions of YouTube -10% 0% 10% 20% -4% -1% +5%▲ +8% ▲ BRAND THAT CONNECTS +2% +7%▲ +16% ▲ +15% ▲ OVERALL FAVORABILTY -3% +5%▲ +10▲ +13% ▲ PURCHASE INTENT
  • 44.
    44 © 2015 IPGMedia Lab. Proprietary & Confidential Opportunity To Differentiate Further Be creative – The sky is the limit! On the scale below where does the video belong? Branded Content n = 4,619 ADVERTISING NOT ADVERTISING CONTENT MARKETING SCORE 23.9 DIFFERENTIATION SCORE: BRANDED CONTENT
  • 45.
    45 © 2015 IPGMedia Lab. Proprietary & Confidential Marketer Go Do’s LOCATION Location, Location, Location - place content on premium sites INFORMATION Branded content is more than providing entertainment. Provide valuable information to your consumers BRANDING Don’t be afraid to incorporate branding, especially for high consideration brands Spend the extra money to make high quality content – it’s worth it SPEND
  • 46.
    46 © 2015 IPGMedia Lab. Proprietary & Confidential Answers lead to more questions… 46 © 2015 IPG Media Lab. Proprietary & Confidential
  • 47.
    47 © 2015 IPGMedia Lab. Proprietary & Confidential SO WHAT’S NEXT? Does running branded content as a pre-roll influence perceptions and/or effectiveness? When branded content is run as pre-roll, does the content that follows impact effectiveness? Is creating “mini” versions of branded content for pre-roll an effective strategy? Does including “influencers” in branded content create a bigger impact? How long with it last? As long as this influencer culture lasts? 47 © 2015 IPG Media Lab. Proprietary & Confidential
  • 48.
    48 © 2015 IPGMedia Lab. Proprietary & Confidential Please contact Kara Manatt for questions: kara.manatt@ipglab.com THANK YOU!
  • 49.
    49 © 2015 IPGMedia Lab. Proprietary & Confidential APPENDIX © 2015 IPG Media Lab. Proprietary & Confidential
  • 50.
    50 © 2015 IPGMedia Lab. Proprietary & Confidential BRAND SURVEY QUESTIONS BRAND METRICS: Unaided Brand Recall: Thinking about the video you just viewed, which brands do you recall being mentioned or shown? If you are not sure, you may guess or leave it blank Overall Favorability: How would you describe your overall opinion of each of the following brands? Purchase Intent (varies by category): Have likely are you to purchase/consider purchasing/consider switching to each of the following brands within the next month/3months/6months? Recommendation Intent: How likely are you to recommend the following brands to a friend, family member, or colleague? BRAND PERCEPTIONS: Please indicate how much you agree of disagree with each of the following statements about the following brand. Brand I would pay more for: <Brand> is worth paying more for Brand I respect: <Brand> is a brand I respect Brand that creates quality products: <Brand> creates quality products Brand offers valuable information: <Brand> offers valuable information Brand I prefer: <Brand> is a brand I prefer Brand that connects with me: <Brand> is a brand that connects with me Brand with a personality: <Brand> is a brand with a personality