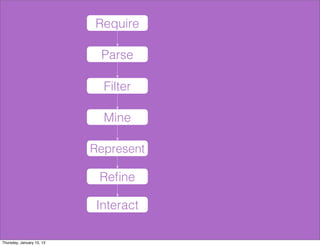
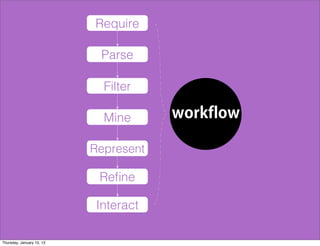
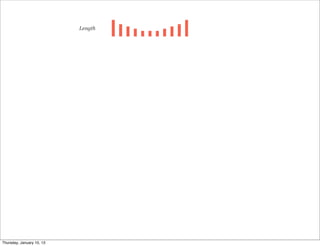
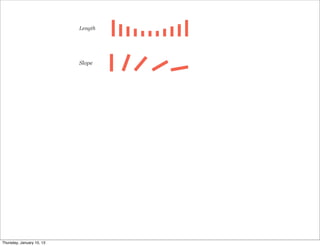
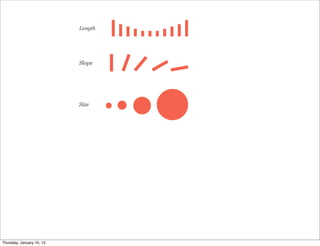
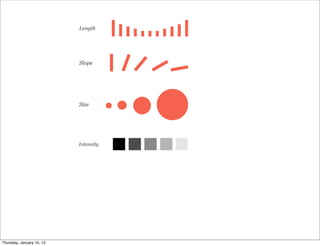
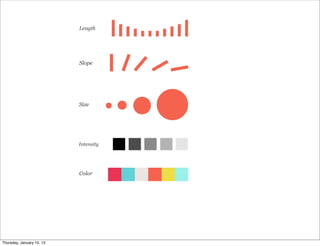
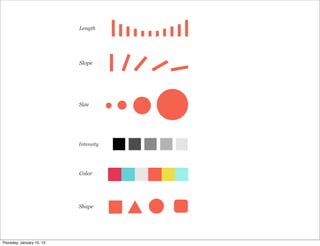
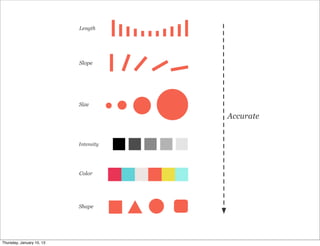
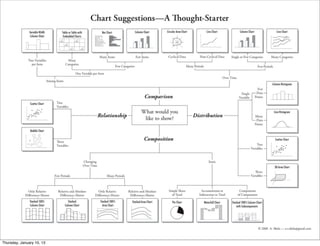
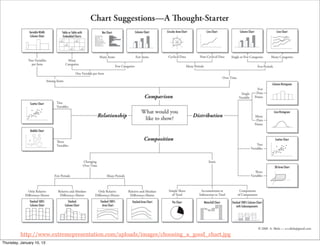
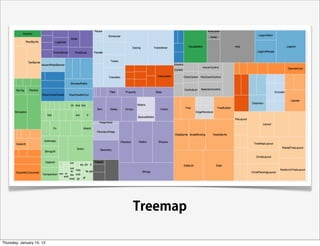
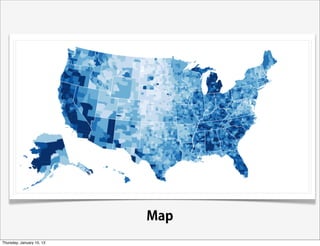
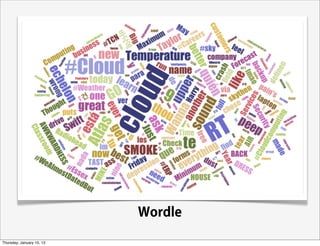
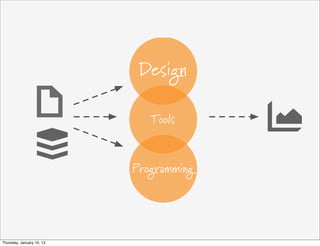
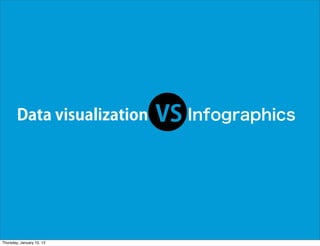
This document provides an overview of data visualization concepts and best practices. It discusses the common workflow of requiring, parsing, filtering, mining, representing, refining and interacting with data. It also covers graphic vocabulary elements like length, slope, size, intensity, color and shape. Common and uncommon chart types are presented like bar charts, treemaps and word clouds. Best practices around accurate, clear and effective visualization are recommended. Finally, popular tools for design, programming and implementing visualizations are listed.


![Festool [state of the industry] keynote presentation (1)](https://cdn.slidesharecdn.com/ss_thumbnails/festoolstateoftheindustrykeynotepresentation1-130401161053-phpapp02-thumbnail.jpg?width=640&height=640&fit=bounds)


