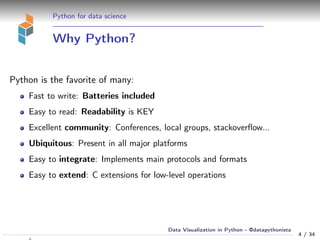
The document presents an overview of data visualization in Python, discussing its advantages, ecosystem, and various libraries such as Matplotlib, Seaborn, Bokeh, Holoviews, Datashader, Folium, and yt. It highlights Python's strengths for data science, including ease of integration and wide community support, while also detailing the functionalities of these visualization tools. The conclusion emphasizes Python's versatility in creating a range of visualizations from standard plots to interactive 3D representations.
![Visualization tools
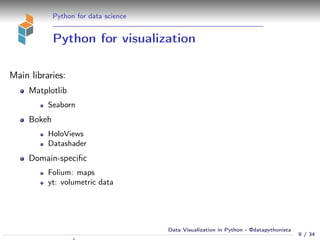
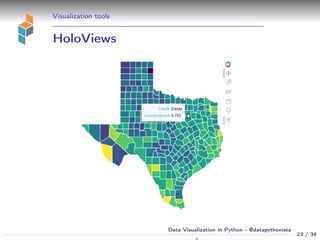
HoloViews
import numpy as np
import holoviews as hv
from bokeh.sampledata.us_counties import data as counties
from bokeh.sampledata.unemployment import data as unemployment
hv.extension(’bokeh’)
counties = {code: county for code, county in counties.items() if county[’state’] == ’tx’}
county_xs = [county[’lons’] for county in counties.values()]
county_ys = [county[’lats’] for county in counties.values()]
county_names = [county[’name’] for county in counties.values()]
county_rates = [unemployment[county_id] for county_id in counties]
county_polys = {name: hv.Polygons((xs, ys), level=rate, vdims=[’Unemployment’])
for name, xs, ys, rate in zip(county_names, county_xs, county_ys,
county_rates)}
choropleth = hv.NdOverlay(county_polys, kdims=[’County’])
plot_opts = dict(logz=True, tools=[’hover’], xaxis=None, yaxis=None,
show_grid=False, show_frame=False, width=500, height=500)
style = dict(line_color=’white’)
choropleth({’Polygons’: {’style’: style, ’plot’: plot_opts}})
22 / 34
Data Visualization in Python - @datapythonista
N](https://image.slidesharecdn.com/datavisualizationinpythonv2-171103225436-241217213048-454dd8fd/85/datavisualizationinpythonv2-171103225436-pdf-22-320.jpg)
![Visualization tools
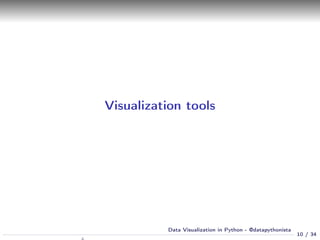
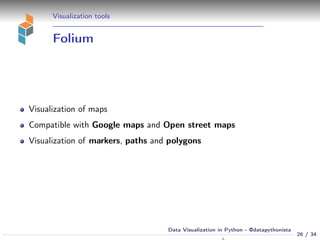
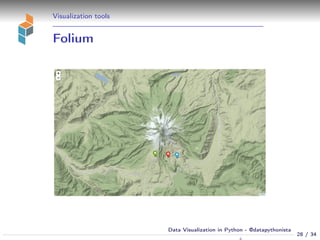
Folium
import folium
m = folium.Map(location=[45.372, -121.6972],
zoom_start=12,
tiles=’Stamen Terrain’)
folium.Marker(location=[45.3288, -121.6625],
popup=’Mt. Hood Meadows’,
icon=folium.Icon(icon=’cloud’)).add_to(m)
folium.Marker(location=[45.3311, -121.7113],
popup=’Timberline Lodge’,
icon=folium.Icon(color=’green’)).add_to(m)
folium.Marker(location=[45.3300, -121.6823],
popup=’Some Other Location’,
icon=folium.Icon(color=’red’, icon=’info-sign’)).add_to(m)
m
27 / 34
Data Visualization in Python - @datapythonista
N](https://image.slidesharecdn.com/datavisualizationinpythonv2-171103225436-241217213048-454dd8fd/85/datavisualizationinpythonv2-171103225436-pdf-27-320.jpg)
![Visualization tools
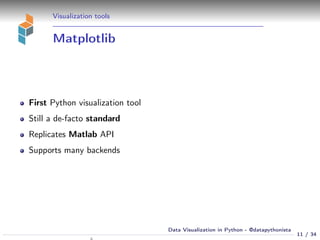
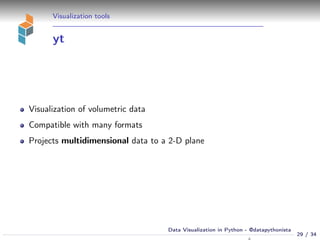
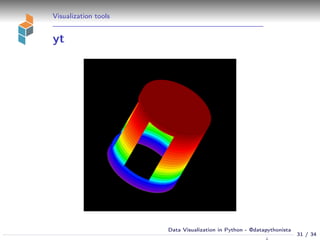
yt
import yt
ds = yt.load(’MOOSE_sample_data/out.e-s010’)
sc = yt.create_scene(ds)
ms = sc.get_source()
ms.cmap = ’Eos A’
cam = sc.camera
cam.focus = ds.arr([0.0, 0.0, 0.0], ’code_length’)
cam_pos = ds.arr([-3.0, 3.0, -3.0], ’code_length’)
north_vector = ds.arr([0.0, -1.0, -1.0], ’dimensionless’)
cam.set_position(cam_pos, north_vector)
cam.resolution = (800, 800)
sc.save()
30 / 34
Data Visualization in Python - @datapythonista
N](https://image.slidesharecdn.com/datavisualizationinpythonv2-171103225436-241217213048-454dd8fd/85/datavisualizationinpythonv2-171103225436-pdf-30-320.jpg)


![[DSC Europe 25] Raul Cruz Bonilla - Harnessing GEN AI in Fashion, Luxury and ...](https://cdn.slidesharecdn.com/ss_thumbnails/me7nvup5thwqzwzblbvw-raul-cruz-harnessing-ai-en-luxury-260123083019-32ac5a43-thumbnail.jpg?width=640&height=640&fit=bounds)


![[DSC Europe 25] Ekaterina Bubenko - Behind the Curtain: How Data Roles Collab...](https://cdn.slidesharecdn.com/ss_thumbnails/anmv6x8dstqbbzchoklr-ekaterina-bubenko-behind-the-curtain-how-data-roles-collaborate-in-the-ai-era-a-260123083019-4b252ec7-thumbnail.jpg?width=640&height=640&fit=bounds)

![[DSC Europe 25] Predrag Maletic - Scaling AI in Banking – Our Strategic Journ...](https://cdn.slidesharecdn.com/ss_thumbnails/qu2onv0aruwlvqtygmxx-predrag-maletic-scaling-ai-in-banking-260123083019-6cf1da1d-thumbnail.jpg?width=640&height=640&fit=bounds)