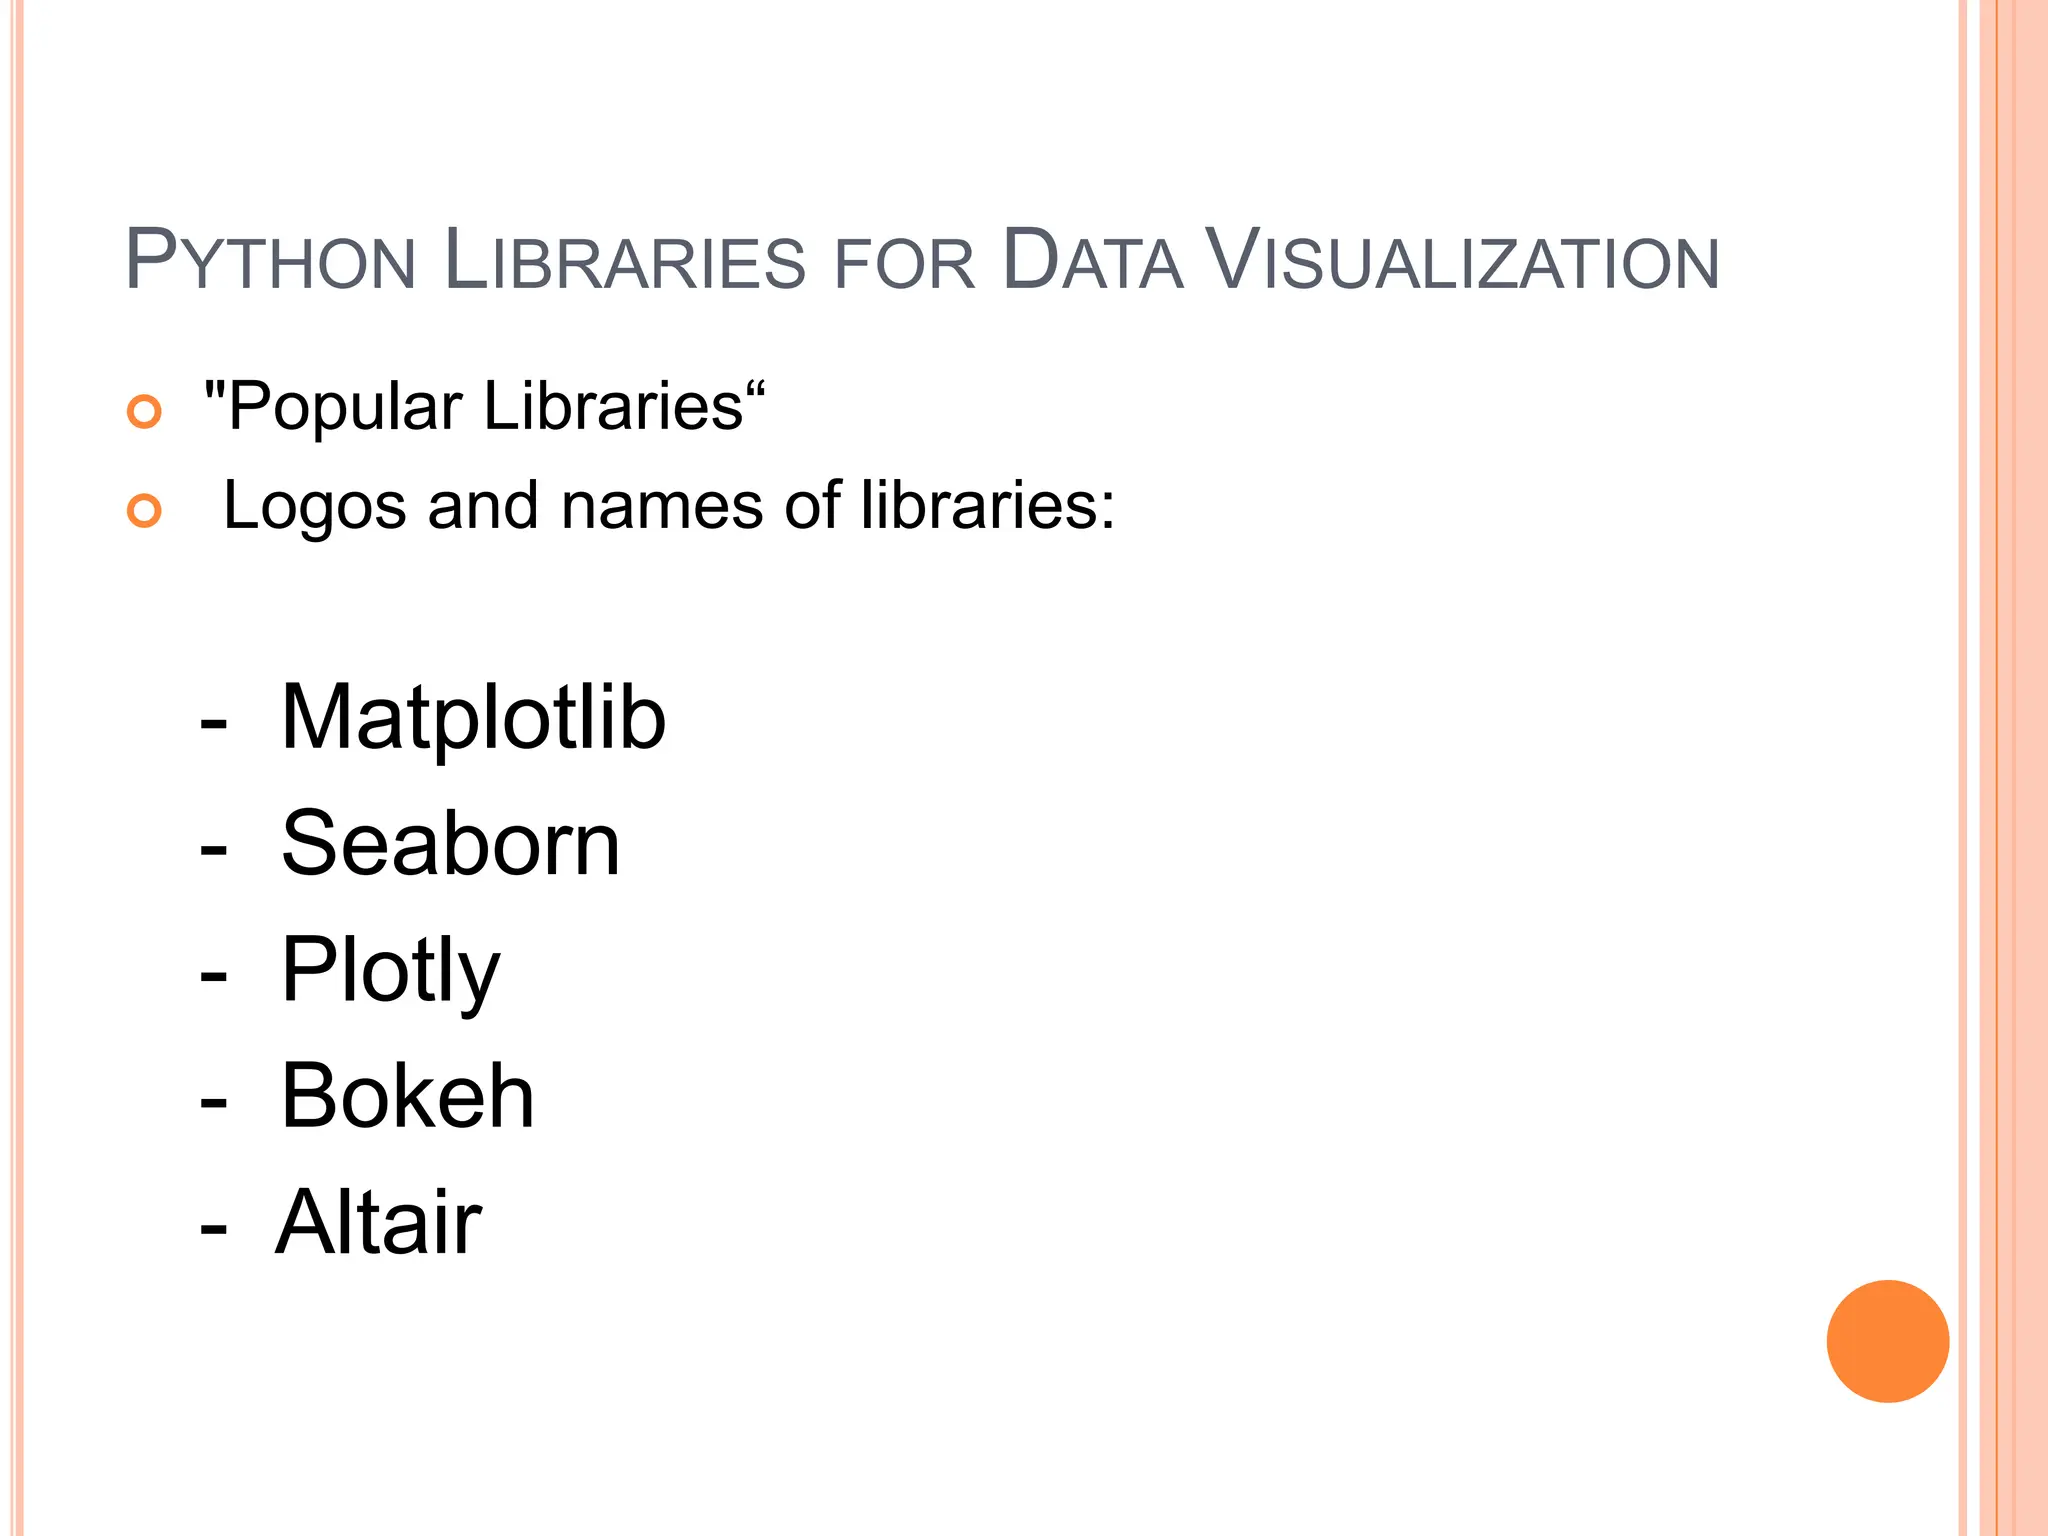
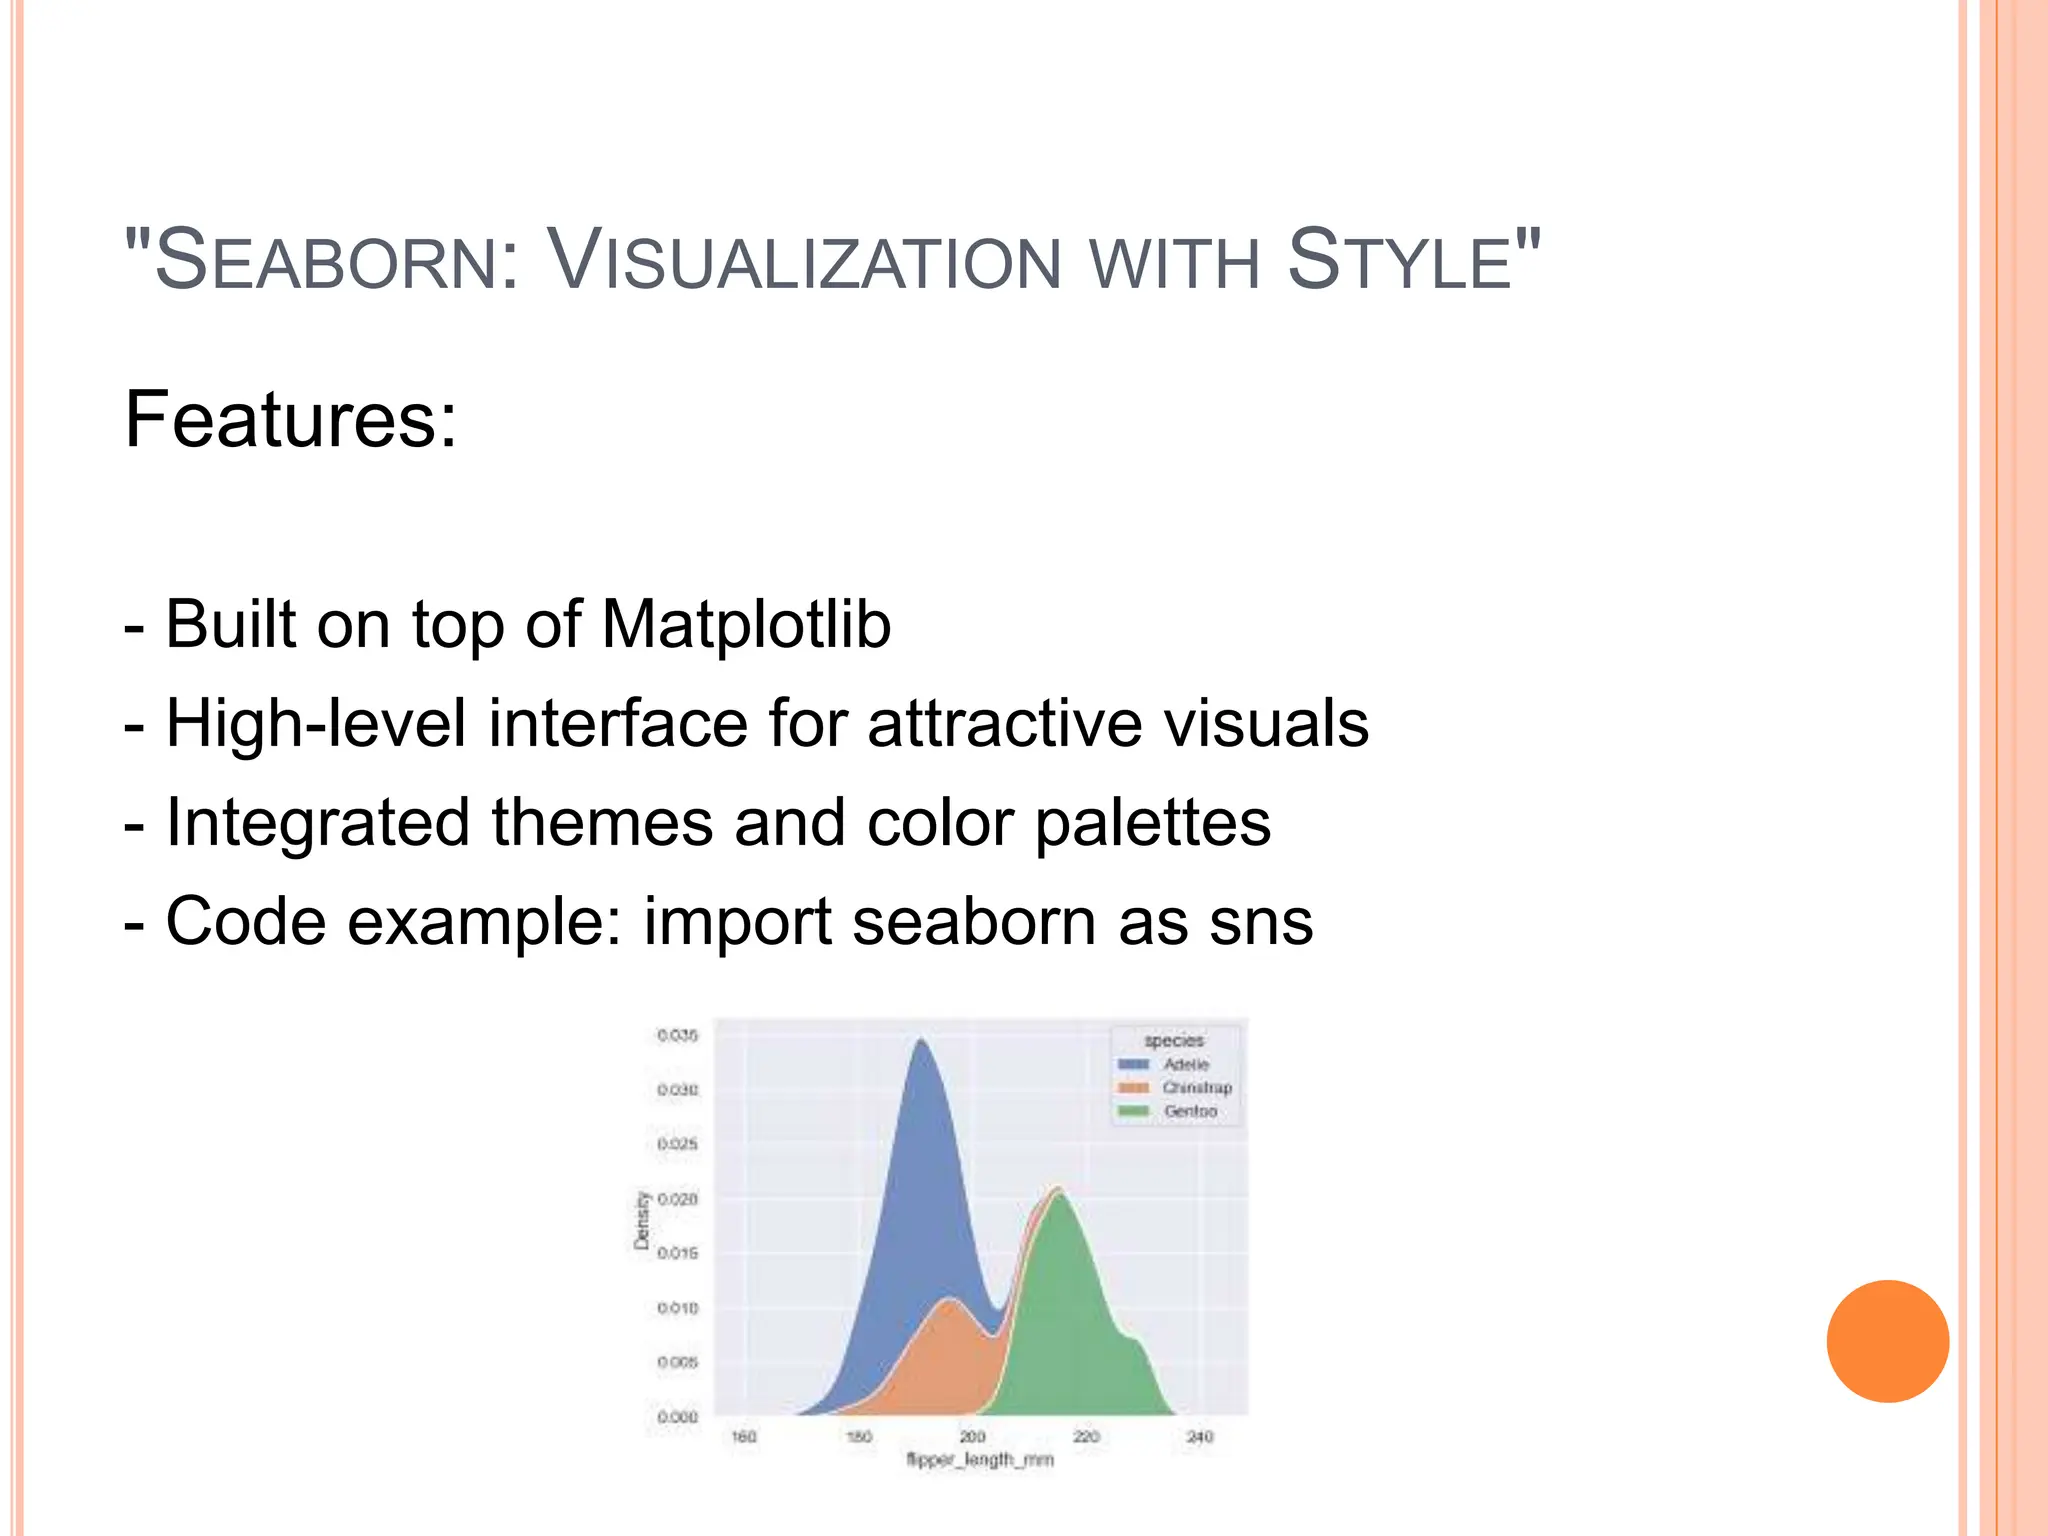
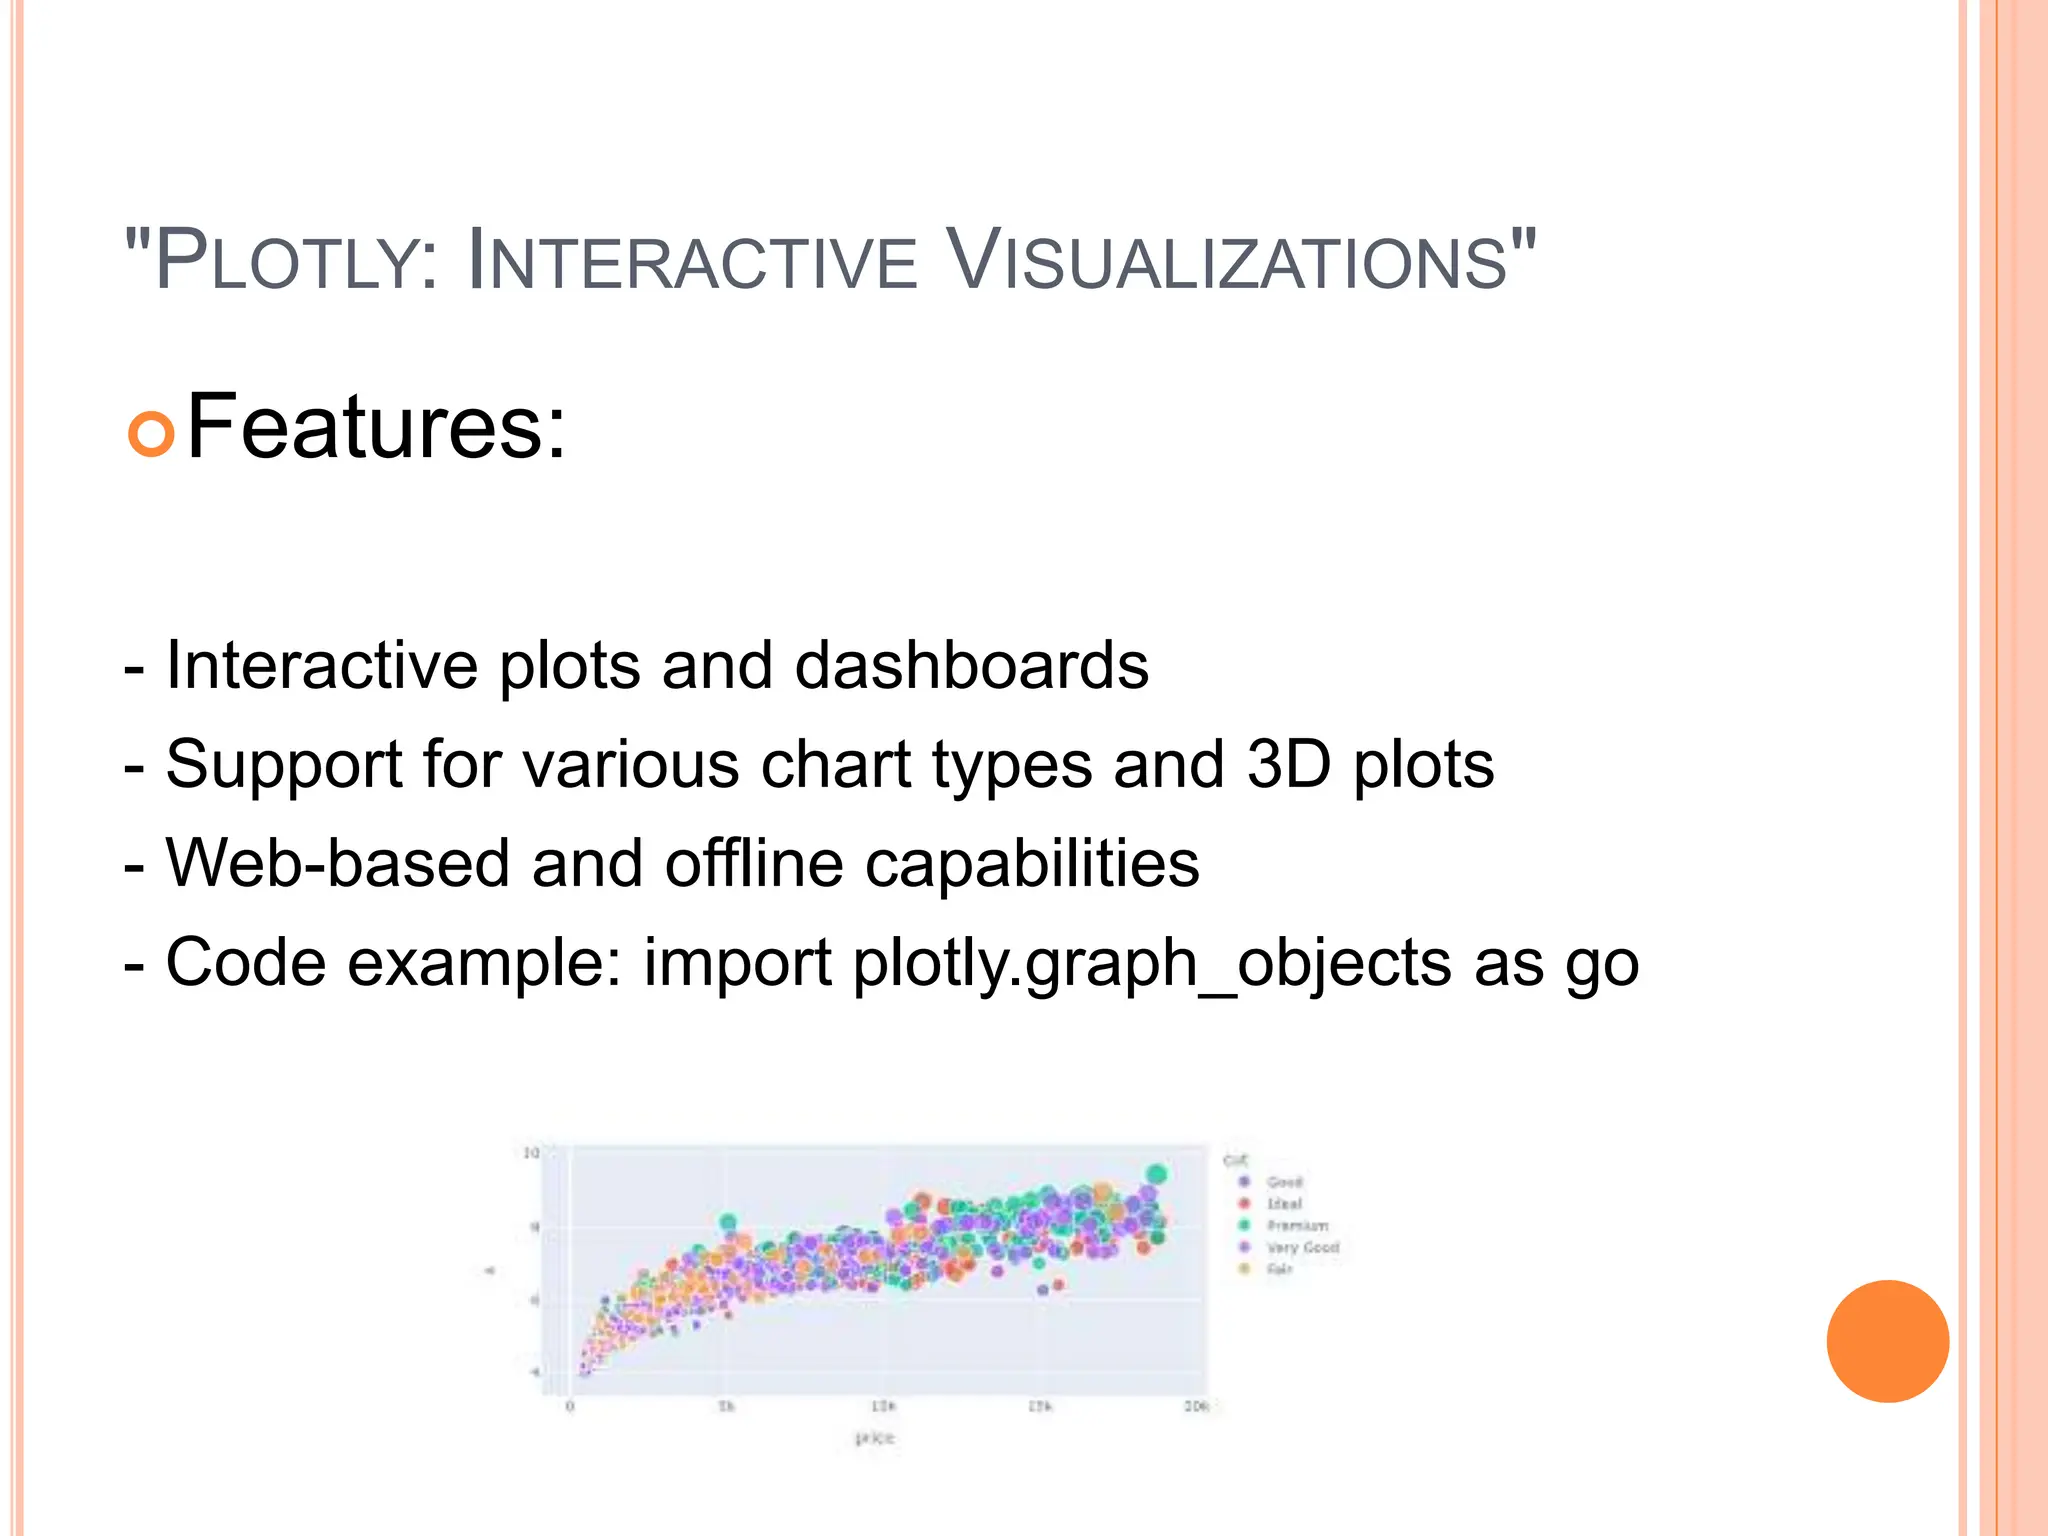
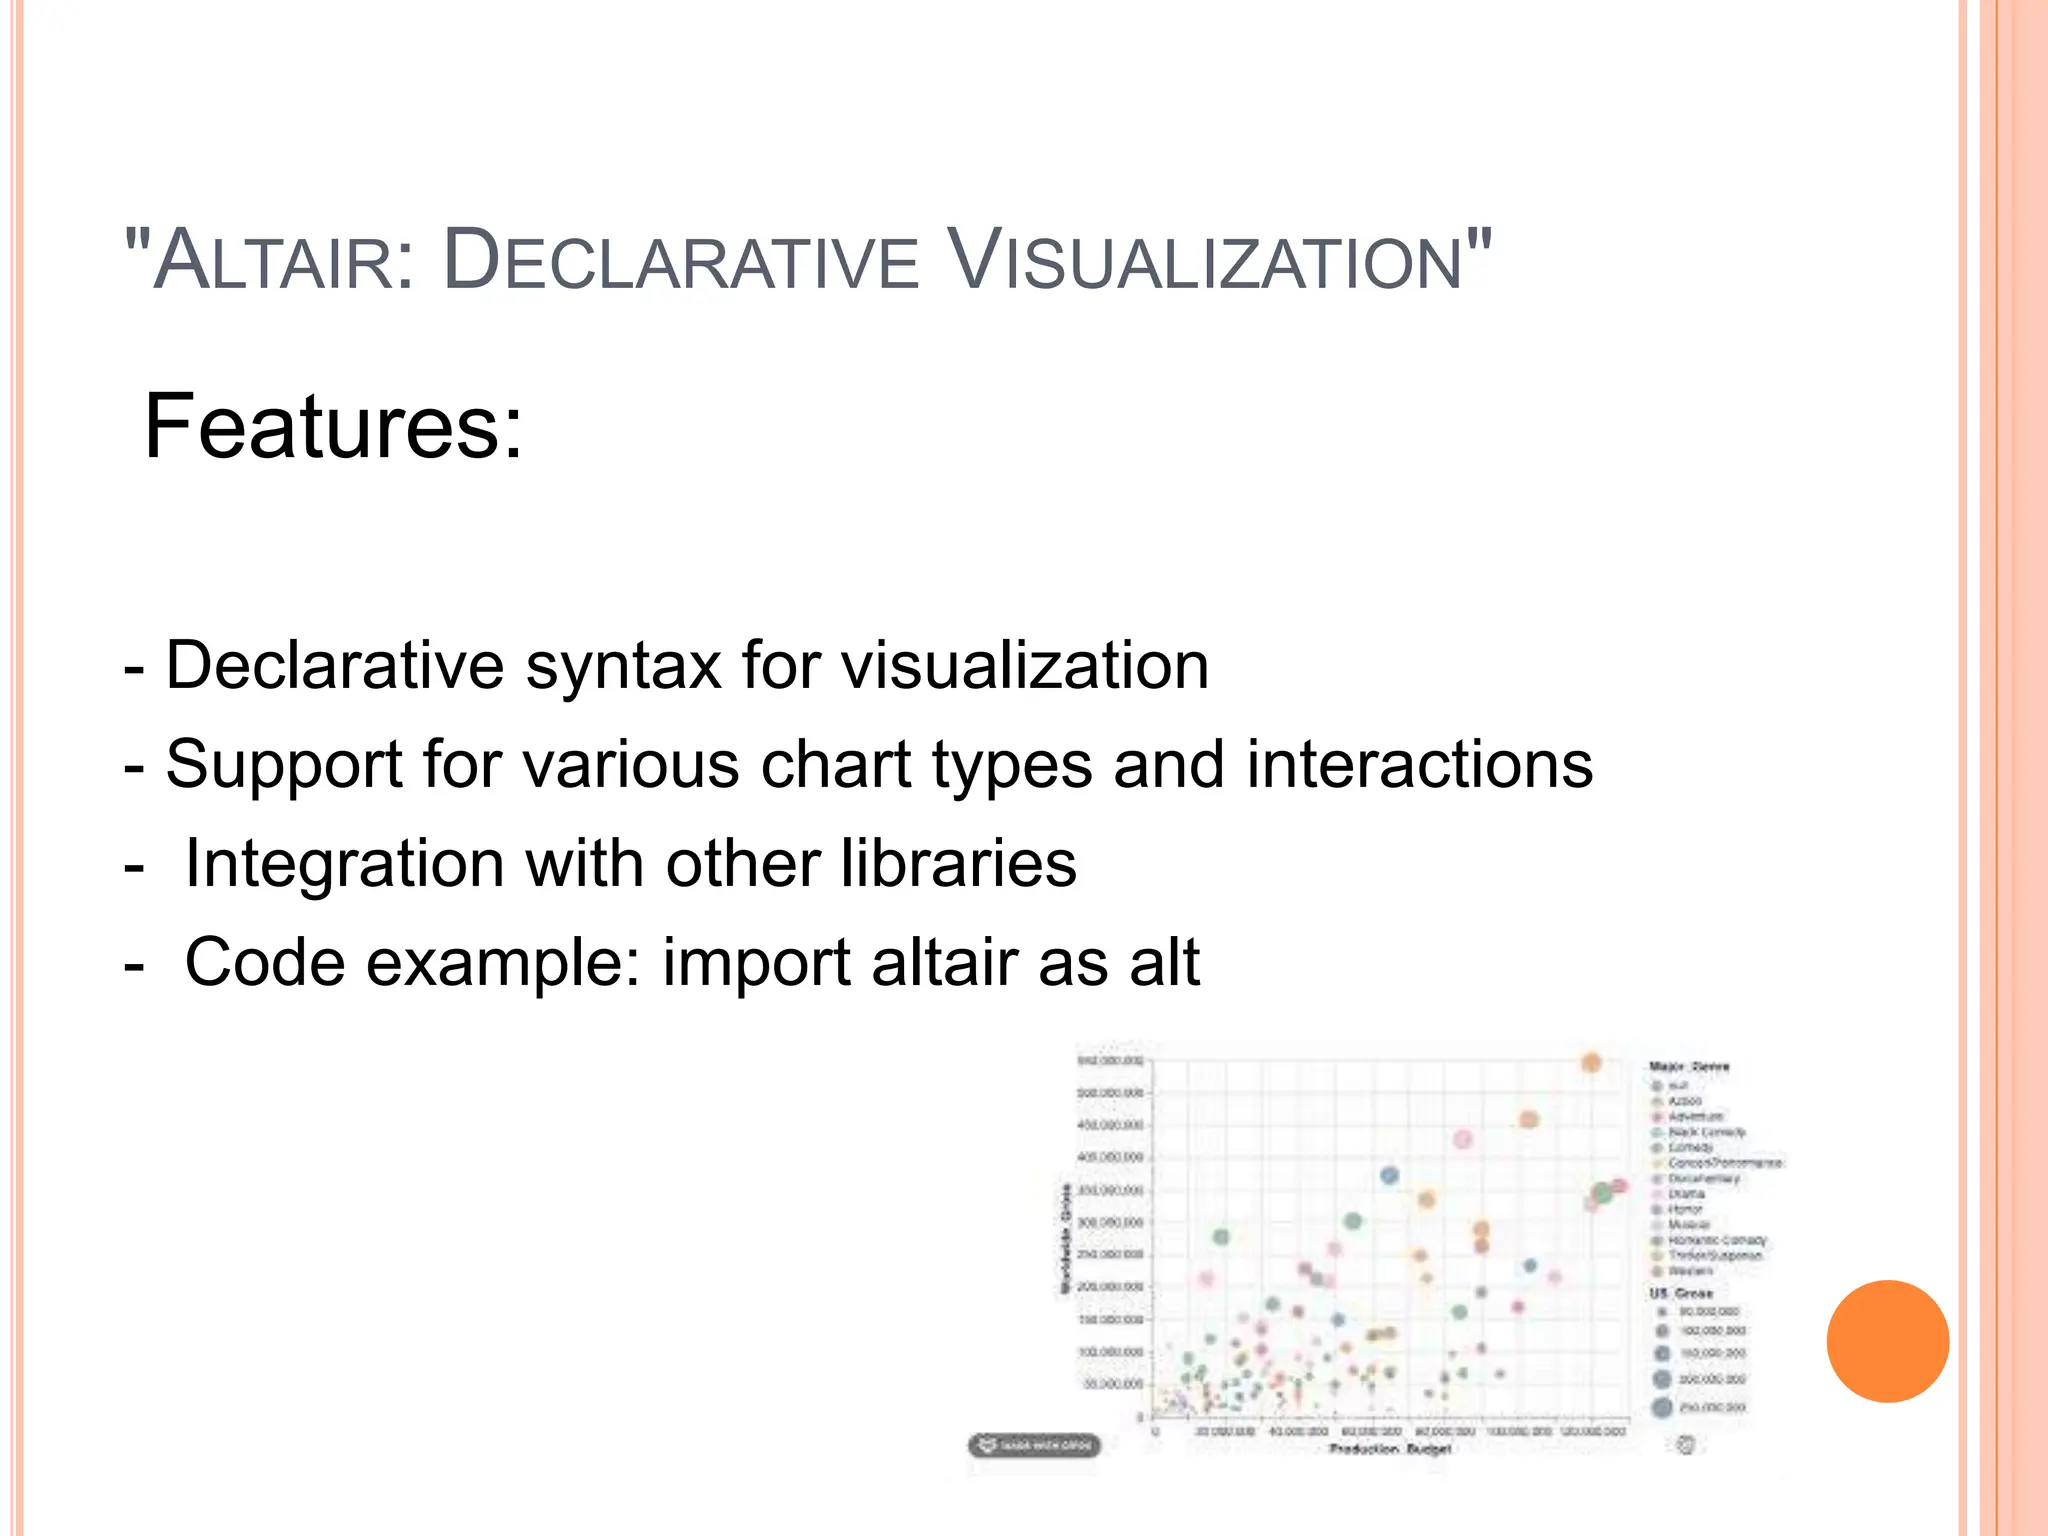
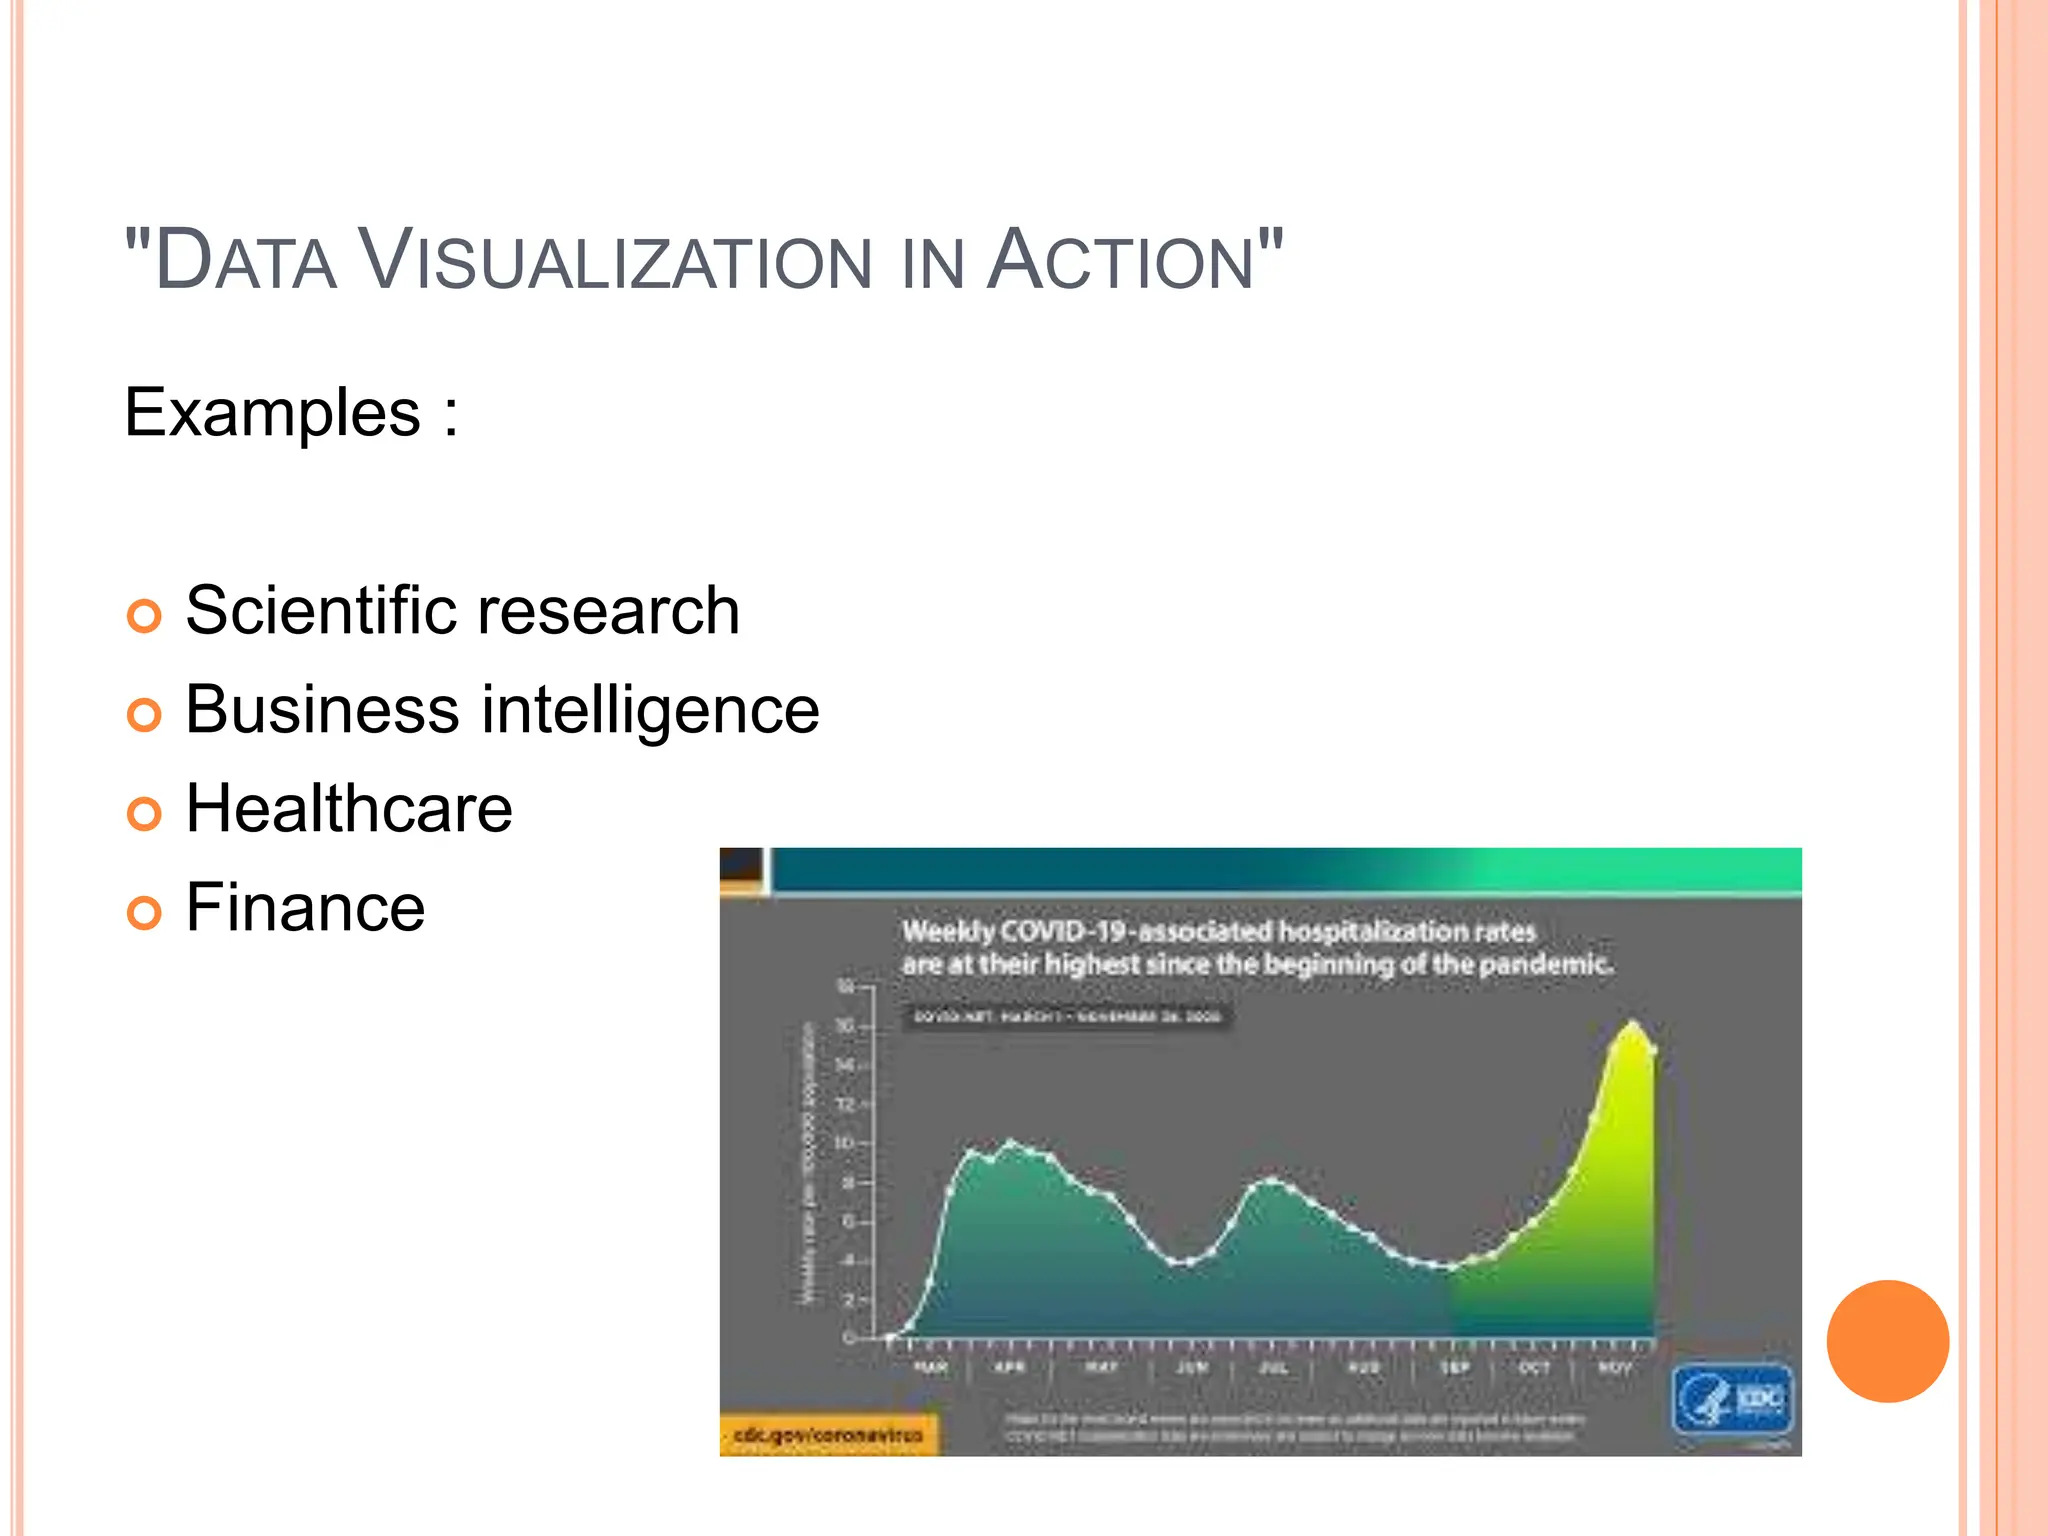
DATA VISUALIZATION IN
PYTHON
Unlocking Insights with Visual Storytelling
POTHUGANTI SIDDAIAH
235U1A0497
ECE-B
IMPORTANCE OF DATA VISUALIZATION
"Why Visualize Data?”
 Understand complex data
 Identify patterns and trends
 Communicate insights effectively
 Drive business decisions
PYTHON LIBRARIES FOR DATA VISUALIZATION
 "Popular Libraries“
 Logos and names of libraries:
- Matplotlib
- Seaborn
- Plotly
- Bokeh
- Altair
"MATPLOTLIB: THE FOUNDATION"
Features:
- 2D and 3D plotting
- Various chart types (line, scatter, bar, etc.)
- Customization options
- Code example: import matplotlib.pyplot as plt
"SEABORN: VISUALIZATION WITH STYLE"
Features:
- Built on top of Matplotlib
- High-level interface for attractive visuals
- Integrated themes and color palettes
- Code example: import seaborn as sns
"PLOTLY: INTERACTIVE VISUALIZATIONS"
Features:
- Interactive plots and dashboards
- Support for various chart types and 3D plots
- Web-based and offline capabilities
- Code example: import plotly.graph_objects as go
"BOKEH: INTERACTIVE VISUALIZATIONS WITH
EASE"
Features:
- Interactive plots and dashboards
- Support for various chart types and streaming data
- Web-based and offline capabilities
- Code example: from bokeh.plotting import figure
"ALTAIR: DECLARATIVE VISUALIZATION"
Features:
- Declarative syntax for visualization
- Support for various chart types and interactions
- Integration with other libraries
- Code example: import altair as alt
"EFFECTIVE DATA VISUALIZATION"
- - Know your audience and purpose
- - Choose appropriate chart types
- - Keep it simple and clear
- - Use color effectively
- - Label and annotate your visualizations
"DATA VISUALIZATION IN ACTION"
Examples :
 Scientific research
 Business intelligence
 Healthcare
 Finance
CONCLUSION
 Summary: Python offers a range of libraries for
data visualization
 Call to action: Start exploring and creating your own
visualizations!

Data Visualization in Python of b.tech student.pptx

  • 1.
    DATA VISUALIZATION IN PYTHON UnlockingInsights with Visual Storytelling POTHUGANTI SIDDAIAH 235U1A0497 ECE-B
  • 2.
    IMPORTANCE OF DATAVISUALIZATION "Why Visualize Data?”  Understand complex data  Identify patterns and trends  Communicate insights effectively  Drive business decisions
  • 3.
    PYTHON LIBRARIES FORDATA VISUALIZATION  "Popular Libraries“  Logos and names of libraries: - Matplotlib - Seaborn - Plotly - Bokeh - Altair
  • 4.
    "MATPLOTLIB: THE FOUNDATION" Features: -2D and 3D plotting - Various chart types (line, scatter, bar, etc.) - Customization options - Code example: import matplotlib.pyplot as plt
  • 5.
    "SEABORN: VISUALIZATION WITHSTYLE" Features: - Built on top of Matplotlib - High-level interface for attractive visuals - Integrated themes and color palettes - Code example: import seaborn as sns
  • 6.
    "PLOTLY: INTERACTIVE VISUALIZATIONS" Features: -Interactive plots and dashboards - Support for various chart types and 3D plots - Web-based and offline capabilities - Code example: import plotly.graph_objects as go
  • 7.
    "BOKEH: INTERACTIVE VISUALIZATIONSWITH EASE" Features: - Interactive plots and dashboards - Support for various chart types and streaming data - Web-based and offline capabilities - Code example: from bokeh.plotting import figure
  • 8.
    "ALTAIR: DECLARATIVE VISUALIZATION" Features: -Declarative syntax for visualization - Support for various chart types and interactions - Integration with other libraries - Code example: import altair as alt
  • 9.
    "EFFECTIVE DATA VISUALIZATION" -- Know your audience and purpose - - Choose appropriate chart types - - Keep it simple and clear - - Use color effectively - - Label and annotate your visualizations
  • 10.
    "DATA VISUALIZATION INACTION" Examples :  Scientific research  Business intelligence  Healthcare  Finance
  • 11.
    CONCLUSION  Summary: Pythonoffers a range of libraries for data visualization  Call to action: Start exploring and creating your own visualizations!