Download to read offline
![International Research Journal of Engineering and Technology (IRJET) e-ISSN: 2395-0056
Volume: 09 Issue: 06 | Jun 2022 www.irjet.net p-ISSN: 2395-0072
© 2022, IRJET | Impact Factor value: 7.529 | ISO 9001:2008 Certified Journal | Page 2655
Data-driven Modelling of Prognostics of Lithium-ion Batteries Using
LSTM
Shreya Shinde1, Lennard Dsouza1, Snehal Maria1, Shivam Anvekar1, Abhishek Shiwalkar2
1Student, Department of Electrical Engineering, Fr. C. Rodrigues Institute of Technology, Vashi, Navi Mumbai,
Maharashtra, India
2Professor, Department of Electrical Engineering, Fr. C. Rodrigues Institute of Technology, Vashi, Navi Mumbai,
Maharashtra, India
---------------------------------------------------------------------***---------------------------------------------------------------------
Abstract - The rechargeable lithium-ion battery has been
extensively used in mobile communication and portable
instruments due to its many advantages, such as high
volumetric and gravimetric energy density and low self-
discharge rate. Early detection of inadequate performance
facilitates the timely maintenance of battery systems. This
reduces operational costs and prevents accidents and
malfunctions. Prognostic and health management (PHM) can
ensure that a lithium-ion battery is working safely and
reliably. The main approach of the PHM evaluation of the
battery is to determine the state of health (SoH) and state of
charge (SOC) of the battery. This paper presents the
preliminary development of the data-driven prognostic, using
an LSTM (RNN) approach to predict the SoH and SoC of the
lithium-ion battery. The effectiveness of the proposed
approach was assessed in a case study using a battery dataset
from NASA's Ames Prognostics Center of Excellence (PCoE)
database. The proposed LSTM algorithm was compared
against other machine learning based on the RMSE value. The
experimental results reveal that the performance of the LSTM
algorithm could either match or outweigh other machine
learning algorithms.
Key Words: lithium-ion battery, battery management
system, Prognostic and health management, State of
Health, State of Charge, LSTM
1. INTRODUCTION
Li-ion batteries are playing a crucial role in the fields of
renewable energy systems and electric vehicles. Batteries
hold the potential to transform the transportation sector,
which now emits considerable volumes of CO2. They also
provide a solution to the intermittent energy powered by
solar and wind generators, assisting in the viability of these
green solutions. However, batteries may not be the clean
energy solution they seem at face value. Obtaining resources
for batteries, such as lithium, has become an environmental
issue[1]. The reliability of these systems depends on a
battery management system (BMS)whichmonitorsthestate
of charge (SoC) and state of health (SoH) effectively[2].
Knowing the SoH of a battery in advance enhances the
system's reliability. The proposed SoH estimation methodis
simulated in Python using the LSTM algorithm by
considering the ageing factors such as temperature,
charge/discharge rates, and depth of discharge[3].
2. SOC AND SOH ESTIMATION
Due to the restricted manufacturing process, the actual full
capacity of a new battery may differ from the nominal
battery capacity claimed by the manufacturer. As a result, a
new battery's original maximumcapacity,Qf,iscalculatedby
averaging the full capacities of multiple
charging/discharging cycles. When a battery begins a cyclic
charging/discharging operation, the inevitable aging will
lead to performance deterioration, with a decrease in the
maximum chargeable or releasable capacity, QM, which is
acquired by cumulating the battery charges either from an
empty-to-full or full-to-empty operation[5]. The "state of
health" of a battery describes the difference between an
examined battery and a new battery, taking into accountcell
ageing. It's the ratio of a battery's maximum charge to its
rated capacity[6].
For an aged battery, the capacity fading causes not only a
decrease in the maximum releasable capacity but also a
mistake in SOC estimation. The state of charge of a battery
describes the difference between a fully chargedbattery and
the same battery in use. It is associated with the remaining
quantity of electricity available in the cell[6]. It is calculated
by dividing the battery's remaining charge by the maximum
charge the battery can produce.
3. DATA SET
The lithium-ion battery data employed in the prognostics
analysis of this work was retrieved from the NASA Ames
Prognostics Center of Excellence (PCoE) data repository[4].
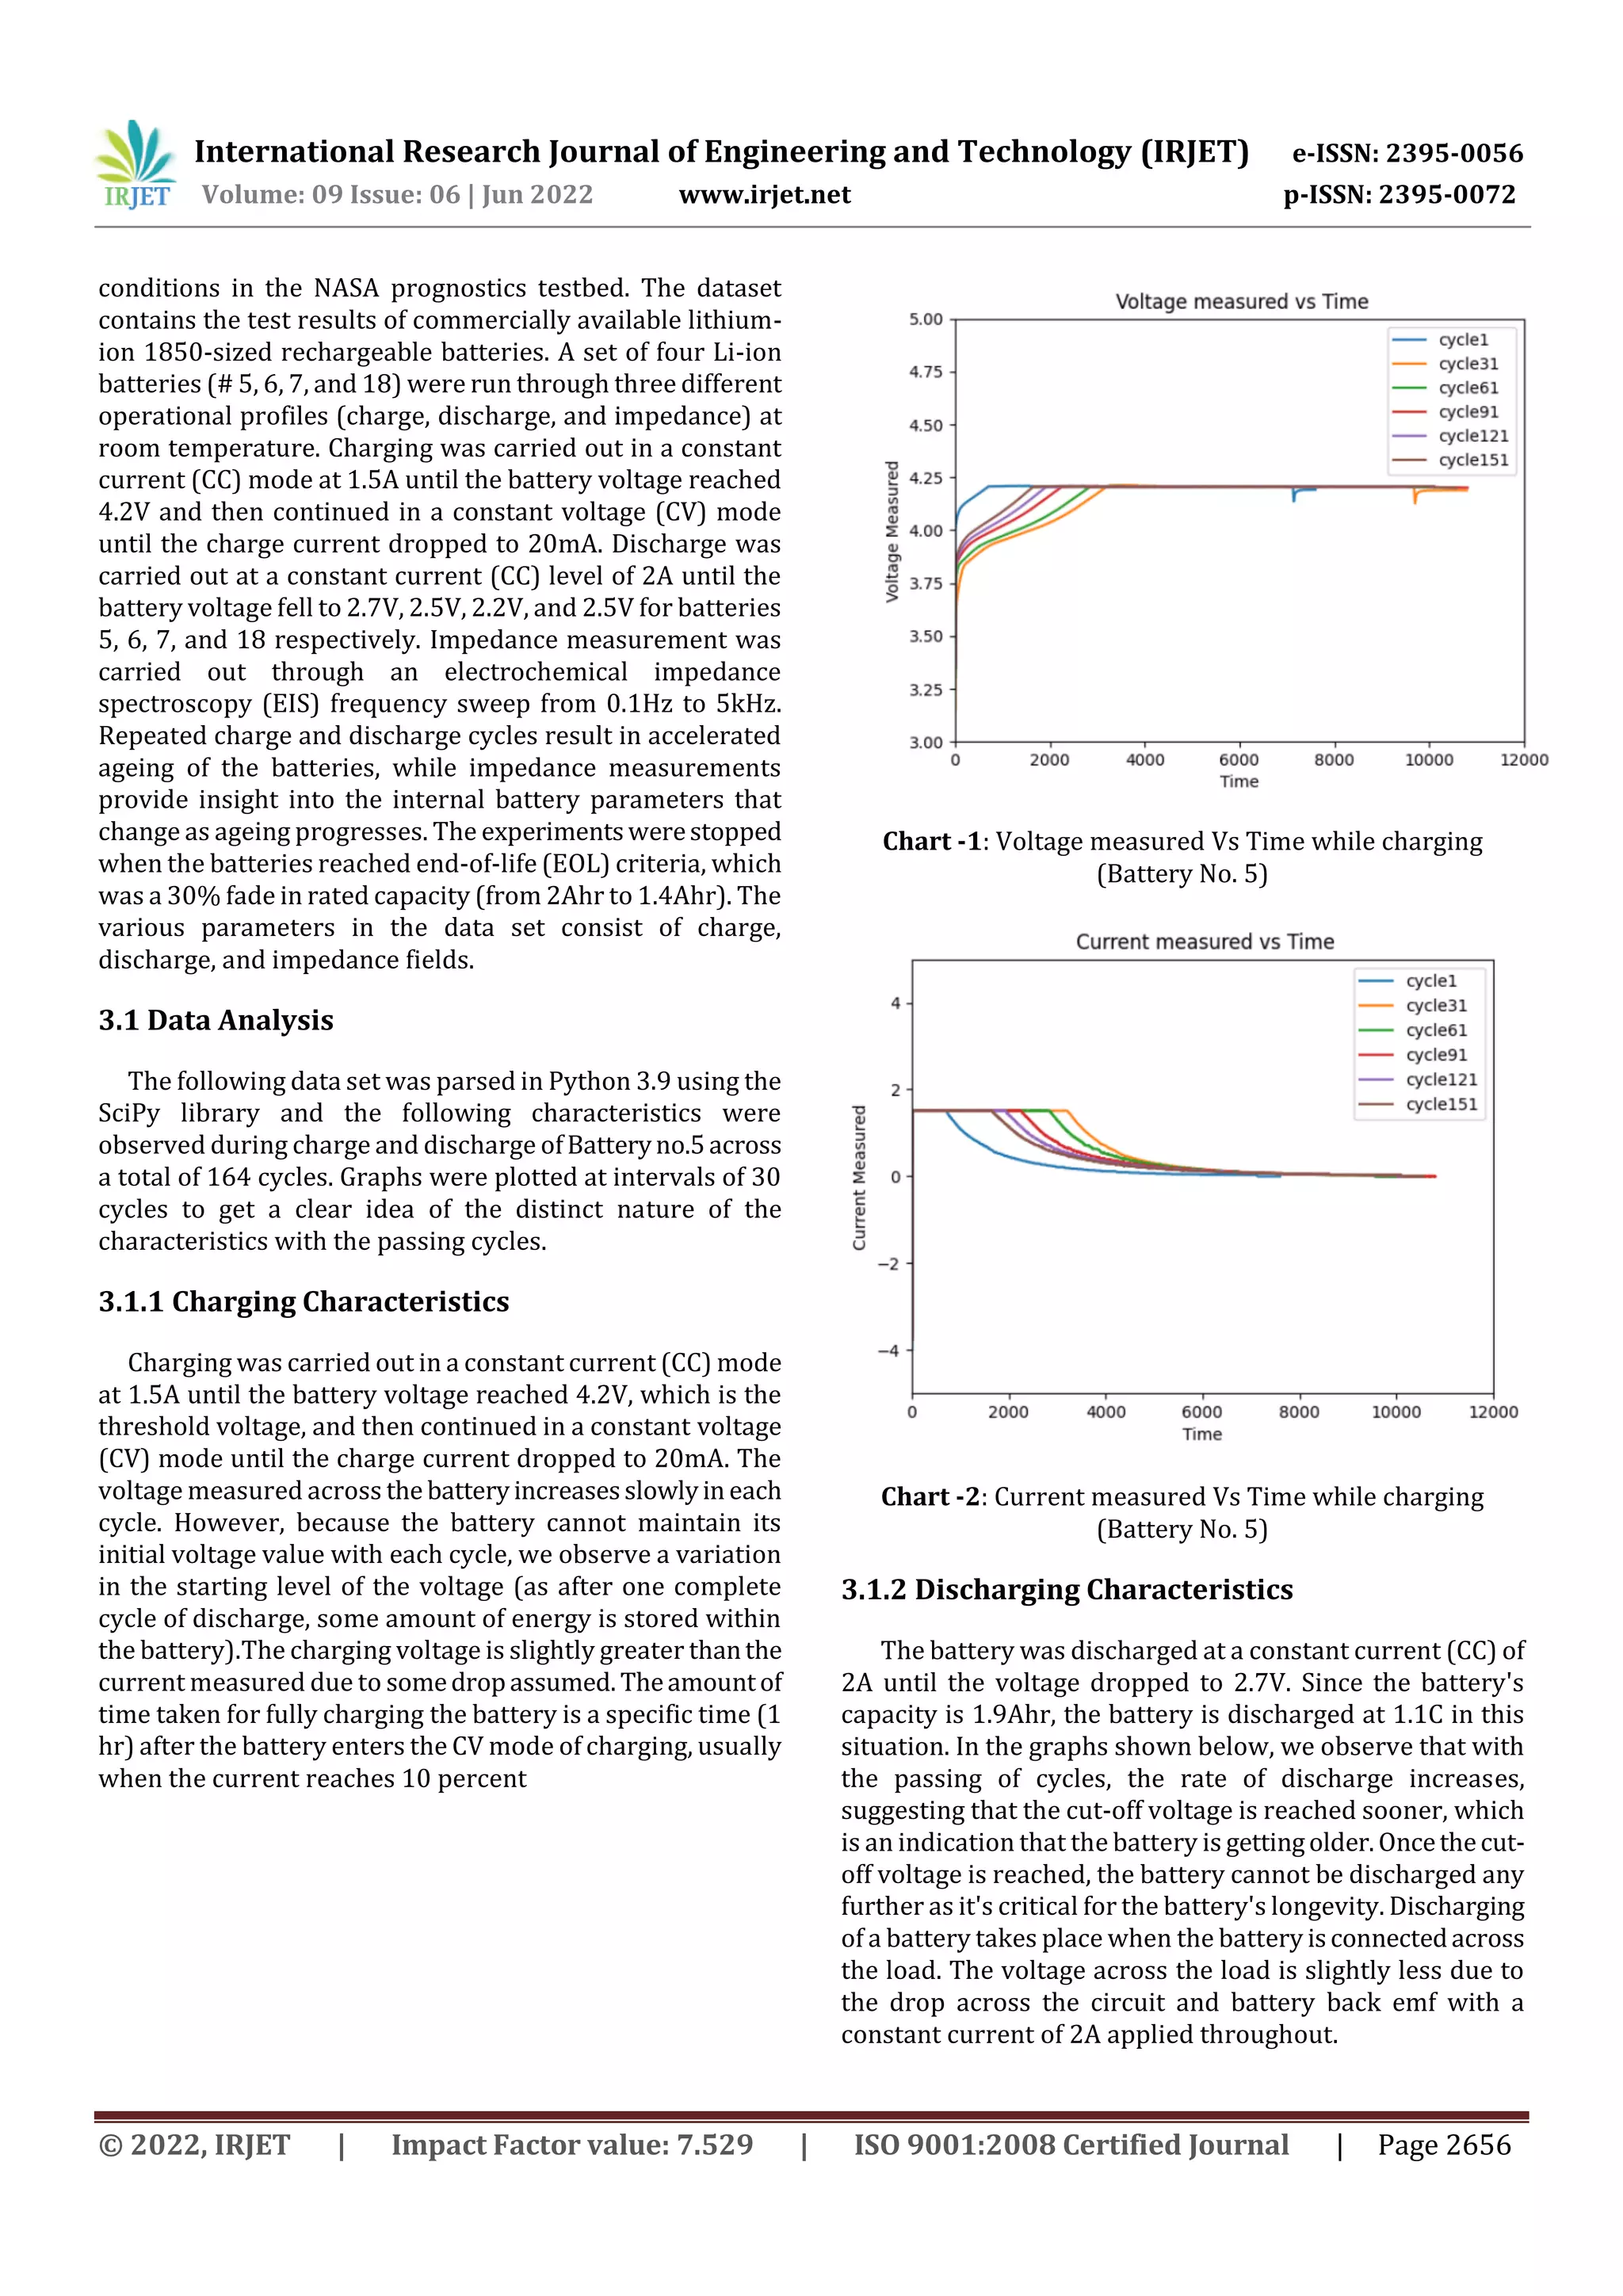
This dataset contains the test results of commercially
available lithium-ion 1850-sized rechargeablebatteries,and
the experiments have been performed under controlled](https://image.slidesharecdn.com/irjet-v9i6538-221018064046-1682c71a/75/Data-driven-Modelling-of-Prognostics-of-Lithium-ion-Batteries-Using-LSTM-1-2048.jpg)
![International Research Journal of Engineering and Technology (IRJET) e-ISSN: 2395-0056
Volume: 09 Issue: 06 | Jun 2022 www.irjet.net p-ISSN: 2395-0072
© 2022, IRJET | Impact Factor value: 7.529 | ISO 9001:2008 Certified Journal | Page 2657
Chart -3: Measured measured Vs Time while discharging
(Battery No. 5)
Chart -4: Current measured Vs Time while discharging
(Battery No. 5)
4. HARDWARE IMPLEMENTATION
Assembly of hardware equipment was initially problematic
because to the COVID-19 outbreak, but once the college
reopened, hardware was installed to validate the data
obtained from our study paper, which we referred to for
benchmark results. This was achieved by charging and
discharging 18650 Li-ion batteries with identical
specifications (nominal voltage 3.7V, peak voltage 4.2V,
ampere-hour capacity 2000mAh) using LabVIEW software
and NI-Modules.
4.1 Working
Charging was carried out in a constant current(CC)mode
at 1.3A until the battery voltage reached 4V and then
continued in a constant voltage (CV) mode until the charge
current dropped to 19mA. Discharge was carried out at a
constant current (CC) level of 1A until thebatteryvoltage fell
to 2.7V, 2.5V, 2.2V, and 2.5V for the battery[8]. The current
sensor is always in series with the battery. Therefore,a close
resemblance was observed between the practically
performed data and the theoretically observed data in the
datasheet mentioned in our chosen researchpaper.Thedata
was acquired by connecting the chassis to the LabVIEW
using the laptop interface. An electronic load was used to
carry out the discharging of the battery, and probes from NI
modules across the battery were connected to measure the
voltage. A current sensor was connected in series to the
battery to measure the current and was calibrated using the
Arduino Uno. A K-Type Thermocouple was placed over the
battery with the help of insulation tape for accurate
measurement of the battery temperature[9]. For charging, a
calibrated chargerwasdismantledandthephaseandneutral
terminals were directly inserted into the supply charging
slots. Data for charging or discharging cycles was
continuously monitored in the LabVIEW at a frequency of 1
Hz until the end of the cycle. The challenges faced while
executing the hardware were that the LabVIEW could only
acquire data from one NI-Module at a time, which led to us
performing different cycles for the measurement of voltage
and temperature for their respective NI-Modules to get the
readings for a single cycle[10]. The data was acquired and
proved to be authentic as it followed the ideal (theoretical)
charging and discharging traits.
Fig -1: Hardware setup for generating real-time data
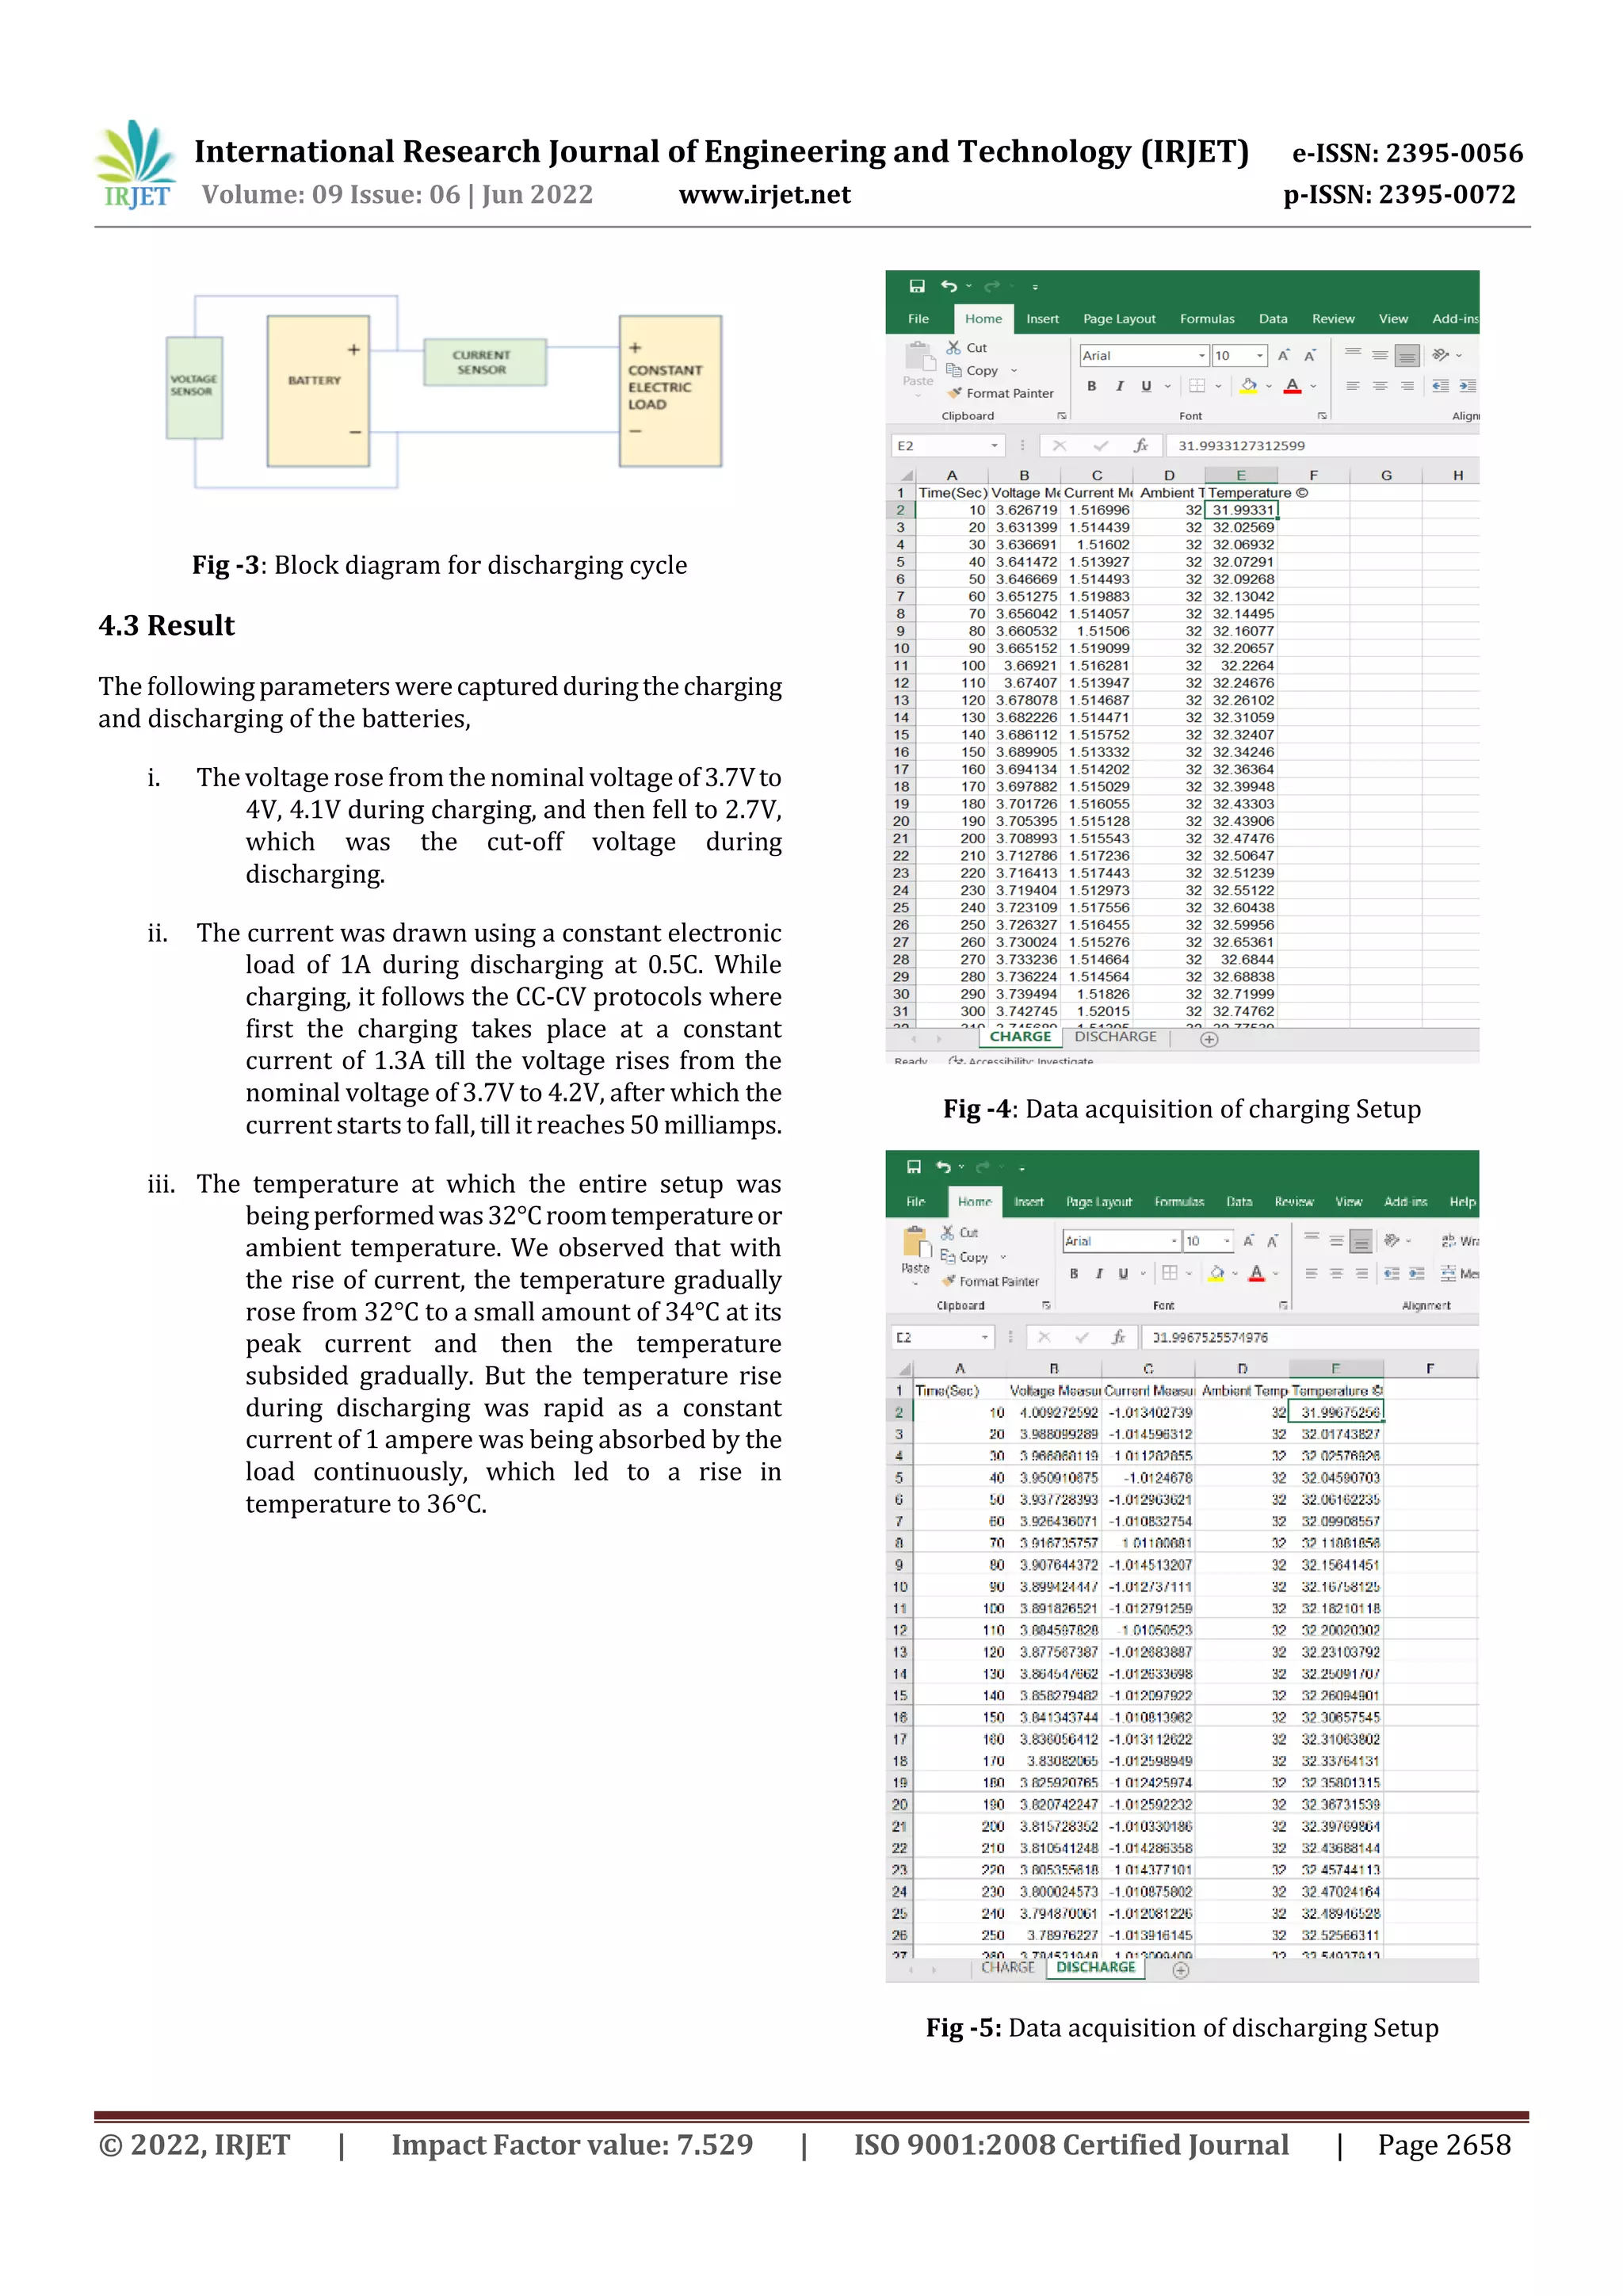
4.2 Block Diagram
Fig -2: block diagram for charging cycle](https://image.slidesharecdn.com/irjet-v9i6538-221018064046-1682c71a/75/Data-driven-Modelling-of-Prognostics-of-Lithium-ion-Batteries-Using-LSTM-3-2048.jpg)
![International Research Journal of Engineering and Technology (IRJET) e-ISSN: 2395-0056
Volume: 09 Issue: 06 | Jun 2022 www.irjet.net p-ISSN: 2395-0072
© 2022, IRJET | Impact Factor value: 7.529 | ISO 9001:2008 Certified Journal | Page 2659
5. MACHINE LEARNING ALGORITHMS
Machine learning algorithms are good at handling data that
is multidimensional and multivariate, and theycandothisin
dynamic or uncertain environments. As ML algorithms gain
experience, they keep improving in accuracy and efficiency.
This lets them make better decisions.Sayyouneedtomakea
weather forecast model. As the amount of data, you have
keeps growing, your algorithmslearntomakemoreaccurate
predictions faster [7]. There is a lot of scopeinML tobecome
the top technology in the future[4]. The reasonisthatithasa
lot of research areas in it. This helps us improve both
hardware and software.
5.1 Proposed ML algorithm LSTM
Long Short-Term Memory networks – usually just called
“LSTMs” – are a special kind of Recurrent Neural Network,
Capable of learning long-term dependencies. They were
introduced by Hochreiter Schmidhuber (1997) and were
refined and popularized by many people. They work
tremendously well on a large variety of problems and are
now widely used[11].
Fig -6: LSTM block diagram
Recurrent networks can, in principle, use their feedback
connections to store representations of recent input events
in the form of activations (weights). This is potentially
significant for many applications, including speech
processing, non-Markovian control, and music composition.
Although theoretically fascinating, existing methods do not
provide clear practical advantages over backdrops in
feedforward nets with limited time. With conventional
“Back-Propagation Through Time" or “Real-Time Recurrent
Learning", error signals flowing backwards in time tend to
either (1) blow up or (2) vanish the temporary
backpropagated error. This may affect the model and bring
about the following consequences: Case (1) may lead to
oscillating weights. Case (2): Learning to bridge long time
lags takes a prohibitive amount of time or does not work at
all. In conjunction with an appropriate gradient-based
learning algorithm, this paper presents "Long Short-Term
Memory" (LSTM), a novel recurrent network architecture in
conjunction with an appropriate gradient-based learning
algorithm. LSTM is designed to overcome these error back-
flow problems. It can learn to bridge time intervals over
1000 steps, even in the case of noisy, incompressible input
sequences, without loss of short time lag capabilities. This is
achieved by an efficient, gradient-based algorithm. LSTM
outperforms and also learns to solve complex,artificial tasks
no other recurrent algorithm has solved before. The other
advantages of using LSTM are as follows: - For long time lag
problems, LSTM can handle noisy distributed
representations and continuous values. In contrast to finite-
state automata or hidden Markov models, LSTM does not
require an a priori choice of a finite number of states. In
principle, it can deal with unlimited state numbers. There
appears to be no need for parameter fine-tuning. LSTM
works well over a broad range of parameters such as
learning rate, input gate bias, and output gate bias. Positions
of widely separated, relevant inputsintheinputsequence do
not matter. The LSTM algorithm updates complexity per
weight and time step [12]. LSTM is local in both space and
time.
5.2 Reason for not Implementing SoC Estimation
Precise measurements of SOC are necessary to ensure safe
operation while maximizing the use of battery capacity. In
early applications, people found that the battery SOC had a
strong linear relationship with the open-circuit voltage
(OCV). To measure the accurate OCV, the battery needs
hours to rest. While in most conditions, accurate OCV is
unlikely to be obtained and is mainly not a method
considered in the case of finding a soc for lithium-ion
batteries. Due to the various internal and external
conditions, fixed mathematical transformations cannot be
accurate. The coulomb counting method (CCM) is another
straightforward method that has the advantage of simple
computation and easy implementation. CCM is widely
recommended for battery health management. However,
CCM is calculated by charge and discharge current time
integral, which is unable to eliminatecumulativeerrorandis
very sensitive to the initial value. If the initial SOC value is
inaccurate, it will affect all estimates and the error will
accumulate during the whole estimation process. The initial
SoC value is usually predicted and is not verified to be 100%
accurate. The large amount of data makes it even more
difficult for the model to give an accurate SOC value[14].
6. SOH MODELLING USING LSTM
In this section, an analysis of battery No. 06, No. 07, and No.
18 degradation datasets taken from the NASA Ames
Prognostics Center of Excellence (PCoE) database was
conducted to evaluate the effectiveness of the developed
LSTM technique. The dataset ofbatteryNo.05wasemployed](https://image.slidesharecdn.com/irjet-v9i6538-221018064046-1682c71a/75/Data-driven-Modelling-of-Prognostics-of-Lithium-ion-Batteries-Using-LSTM-5-2048.jpg)
![International Research Journal of Engineering and Technology (IRJET) e-ISSN: 2395-0056
Volume: 09 Issue: 06 | Jun 2022 www.irjet.net p-ISSN: 2395-0072
© 2022, IRJET | Impact Factor value: 7.529 | ISO 9001:2008 Certified Journal | Page 2660
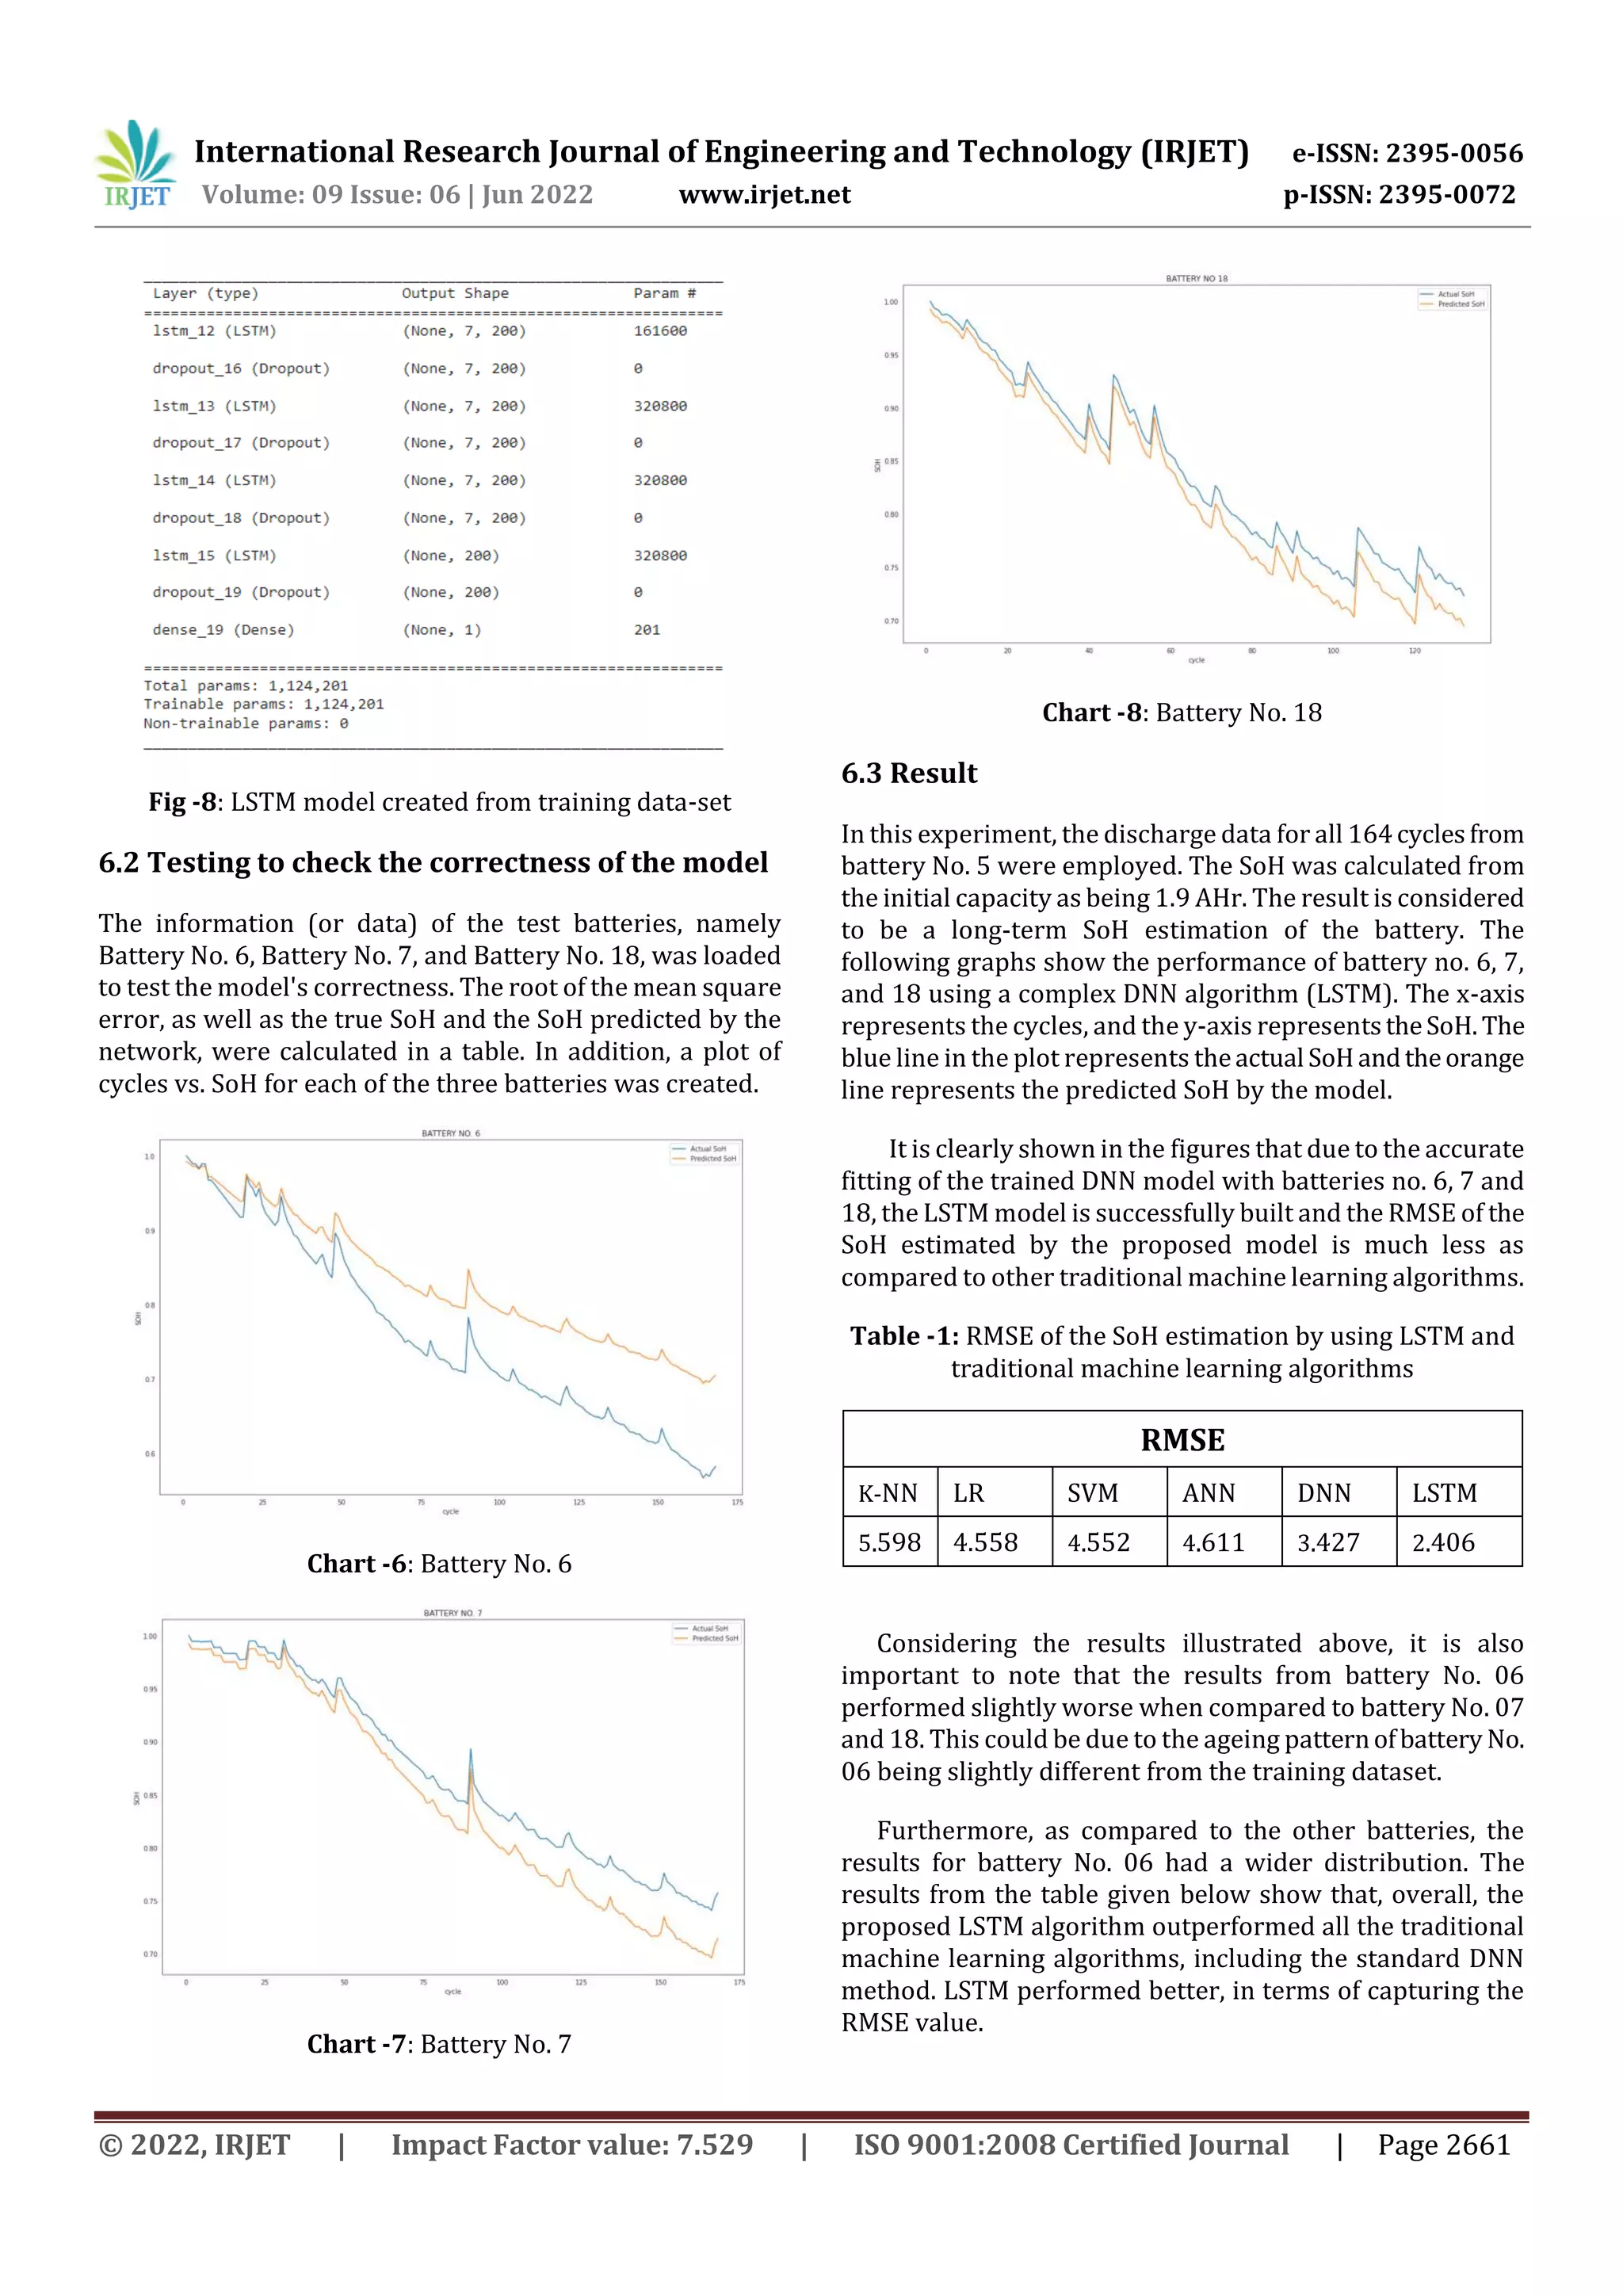
as a training dataset. A detailed description of the
experimental data has been provided. TheSoHexperimental
results from the conventional DNN and developed LSTM
model will be presented. An LSTM-RNN network is trained
to model the complex battery dynamics under varying
ambient temperatures. A step-by-step searching method is
presented to determine the optimal network hyper-
parameters for SOH modelling[13]. The network well learns
the battery dynamics, presents good robustness against
unknown initial states and provides satisfying SOH
estimations under varying temperatures. There are natural
recursive linkages between current SOC and past inputs, as
illustrated by the Coulomb counting approach. An LSTM-
RNN network is thereforeconstructedtomodel thetemporal
dependencies of the input layer, battery current, terminal
voltage, and ambient temperature to form the input vector.
Since it is necessary to calculate the SoH of the battery, as
this is the data that will be predicted using the LSTM model,
a theoretical calculation of SOH was performed in Python
based on the formula given below:
- where,
represents the maximum practical capacity
as measured from the operating battery at the current time.
represents the rated capacity from battery
manufacturers. Theoretical value of SoH of all the batteries
was calculated and plotted in the graph showing the aging
process of the battery[15].
According to the README file of the dataset, the data is
stored in several ".mat" files. Each file corresponds to a
specific battery, and the data structure of each file contains
the parameters mentioned in the above section. For the
LSTM model proposed in Section V, it is only necessary to
collect the data related to the discharge of the battery. For
this, a function is created in Python that is in charge of
reading this data from the ".mat" file and storing it in
memory in two pandas Data Frames for later access. After
loading the dataset, a description of the data is made using
pandas functions to verify if the data loading was correct.
Fig -7: Dataset after formatting and parsing
Chart -5: Actual SoH vs cycles
6.1 Training phase for calculating SoH
The dataset is prepared in such a way that it can be used by
TensorFlow during the training phase; two structures are
constructed corresponding to the predicted input and
output. For the input data, the relevant characteristicsofthe
dataset are filtered, which are:
• Battery capacity
• Voltage
• Current
• Temperature
• Charging voltage
• Charging current
• Instant of time (from the start of the download)
For the output data, the SoH of the battery is calculated and,
in both input and output cases, the values are normalized to
a range of values between [0] and [1]. For the preparation of
the model, four dropout layers, one dense layer, and one of
the ADAM types are used as optimizers. About50epochsare
used for training the model.](https://image.slidesharecdn.com/irjet-v9i6538-221018064046-1682c71a/75/Data-driven-Modelling-of-Prognostics-of-Lithium-ion-Batteries-Using-LSTM-6-2048.jpg)
![International Research Journal of Engineering and Technology (IRJET) e-ISSN: 2395-0056
Volume: 09 Issue: 06 | Jun 2022 www.irjet.net p-ISSN: 2395-0072
© 2022, IRJET | Impact Factor value: 7.529 | ISO 9001:2008 Certified Journal | Page 2662
Absolute errors measuredthemeanabsolutevalueof the
difference between the elementwise inputs. The absolute
error formula used as the loss function can be expressed by
the following equation:
Where, yi and are, respectively, the predicted data and the
input data of each iteration or epoch i, and k is thenumber of
iterations or epochs. In this experiment, the total number of
epochs was set to 200.
7. CONCLUSIONS
This work aims to develop an LSTM model to predict the
state of health of lithium-ion batteries. This experiment has
achieved its goal of aiding, as a benchmark, the prognostic
data-driven model for battery data using machine learning
algorithms. Based on the results from the case studies, it
shows that the LSTM algorithm provides a promising
outcome for predicting and modelling prognostic data,
especially in the battery prognostic and health management
applications. Also, based on several advantages of data-
driven modelsoverthetraditional physics-basedmodelsand
the accuracy achieved, we believe that the traditional
physics-based model maybe replaced bydata-drivenmodels
soon, in various fields and applications. This future trend of
data-driven models is in line with the recent achievement of
deep learning algorithms and artificial intelligence. These
methodologies are believed to be themainapproachesinthe
further development of data-driven models. However, the
accuracy of prediction and the higher performance of using
deep learning algorithms also come with the drawback of
higher computational time. With rapid advancements in
technology, the computational time could be substantially
reduced. The future direction of this work will focus on
developing a hybrid-deep learning model that could be
universally applicable to multiple types of prognostic data.
Due to time constraints and inaccessibility of the lab
equipment, it was not feasible to create an entire dataset of
the battery as acquiring an entire dataset would take
approximately (170×4) 680 hours. Hence, there is
uncertainty in predicting the whole nature of the battery’s
operation based on a couple of charge-discharge cycles.
However, it was found that in the practically performed
cycles, all the charging/dischargingprotocolswereobserved
quite accurately.
ACKNOWLEDGEMENT
The success of a project like this, involving high technical
expertise, patience, and the massive support of guides, is
possible when team members work together. We take this
opportunity to express our gratitudetothose whohavebeen
instrumental in the successful completion ofthisproject. We
would like to show our appreciation to Mr Abhishek
Shiwalkar and Dr Sushil S. Thale for their guidance and
support, which was instrumental in the progress of this
project. We would also like to thank our project coordinator,
Mrs Seema Jadhav for providing us with regular input about
documentation and the project timeline. We would also like
to thank Mr Nikhil Sorade for his guidance and support in
data set interpretation. A big thanks to our HOD, Dr Bindu S.
for all the encouragement given to our team. We would also
like to thank our principal, Dr S. M. Khot for giving us the
opportunity and the environment to learn and grow.
REFERENCES
[1] H. C. Hesse, M. Schimpe, D. Kucevic, and A. Jossen,
“Lithium-ion battery storage for the grid—a review of
stationary battery storage system design tailored for
applications in modern power grids,” Energies, vol. 10,
no. 12, p. 2107, 2017.
[2] R. Xiong, Y. Zhang, J. Wang, H. He, S. Peng, and M. Pecht,
“Lithium-ion battery health prognosis based on a real
battery management system used in electric vehicles,”
IEEE Transactions on Vehicular Technology, vol. 68, no.
5, pp. 4110–4121, 2018.
[3] J. Duan, X. Tang, H. Dai, Y. Yang, W. Wu, X. Wei, and Y.
Huang, “Building safe lithium-ion batteries for electric
vehicles: a review,” Electrochemical Energy Reviews,
vol. 3, no. 1, pp. 1–42, 2020.
[4] P. Khumprom and N. Yodo, “A data-driven predictive
prognostic model for lithium-ion batteries based on a
deep learning algorithm,” Energies, vol. 12, no. 4, p. 660,
2019.
[5] J. Vetter, P. Nov´ak, M. R. Wagner, C. Veit, K.-C. M¨oller, J.
Besenhard, M. Winter, M. Wohlfahrt-Mehrens, C.Vogler,
and A. Hammouche, “Ageing mechanisms in lithium-ion
batteries,” Journal of powersources,vol.147,no.1-2,pp.
269–281, 2005.
[6] S.-C. Huang, K.-H. Tseng, J.-W. Liang, C.-L. Chang, and M.
G. Pecht, “An online soc and soh estimation model for
lithium-ion batteries,” Energies, vol. 10, no. 4, p. 512,
2017
[7] J. S. Goud, R. Kalpana, and B. Singh, “An online methodof
estimating state of health of a li-ion battery,” IEEE
Transactions on Energy Conversion, vol. 36, no. 1, pp.
111–119, 2020.
[8] P. Ferrand, “Gpscan. vi: A general-purpose labview
program for scanning imaging or any application
requiring synchronous analog voltage generation and
data acquisition,” Computer Physics Communications,
vol. 192, pp. 342– 347, 2015.](https://image.slidesharecdn.com/irjet-v9i6538-221018064046-1682c71a/75/Data-driven-Modelling-of-Prognostics-of-Lithium-ion-Batteries-Using-LSTM-8-2048.jpg)
![International Research Journal of Engineering and Technology (IRJET) e-ISSN: 2395-0056
Volume: 09 Issue: 06 | Jun 2022 www.irjet.net p-ISSN: 2395-0072
© 2022, IRJET | Impact Factor value: 7.529 | ISO 9001:2008 Certified Journal | Page 2663
[9] S. A. Hasib, S. Islam, R. K. Chakrabortty, M. J. Ryan, D.
Saha, M. H. Ahamed, S. Moyeen, S. K. Das, M. F. Ali, M. R.
Islam, et al., “A comprehensive review of available
battery datasets, rul prediction approaches, and
advanced battery management,” Ieee Access, 2021.
[10] L. Wang, Y. Y. Tan, and X. L. Cui, “The application of
labview in data acquisition system of solar absorption
refrigerator,” in Advanced Materials Research, vol. 532,
pp. 581–585, Trans Tech Publ, 2012.
[11] S. Hochreiter and J. Schmidhuber, “Long short-term
memory,” Neural computation, vol. 9, no. 8, pp. 1735–
1780, 1997.
[12] T.-H. Wu, J.-K. Wang, C.-S. Moo, and A. Kawamura,
“State-of-charge and state-of-health estimating method
for lithium-ion batteries,” in 2016 IEEE 17th Workshop
on Control and Modeling for Power Electronics
(COMPEL), pp. 1–6, IEEE, 2016
[13] F. Yang, S. Zhang, W. Li, and Q. Miao, “State-of-charge
estimation of lithiumion batteries using lstm and ukf,”
Energy, vol. 201, p. 117664, 2020.
[14] S. Santhanagopalan and R.E.White,“Onlineestimation
of the state of charge of a lithium ion cell,” Journal of
power sources, vol. 161, no. 2, pp. 1346–1355, 2006.
[15] B. Chinomona, C. Chung, L.-K. Chang, W.-C. Su, and M.-
C. Tsai, “Long short-term memory approach to estimate
battery remaining useful life using partial data,” IEEE
Access, vol. 8, pp. 165419–165431, 2020.](https://image.slidesharecdn.com/irjet-v9i6538-221018064046-1682c71a/75/Data-driven-Modelling-of-Prognostics-of-Lithium-ion-Batteries-Using-LSTM-9-2048.jpg)

This document presents a study on using LSTM neural networks for data-driven prognostics of lithium-ion batteries. The study uses battery data from NASA to train and test an LSTM model for predicting state of health (SoH) and state of charge (SoC). Charging and discharging characteristics are analyzed from the data set. Hardware is also implemented to generate real-time battery data for model validation. The LSTM model is found to either match or outperform other machine learning algorithms in terms of prediction error.


