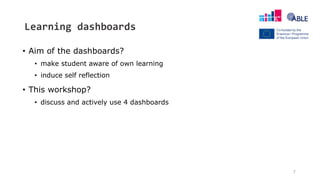
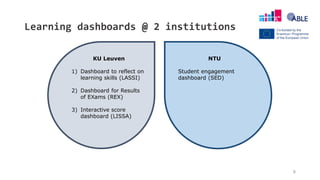
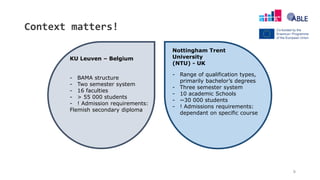
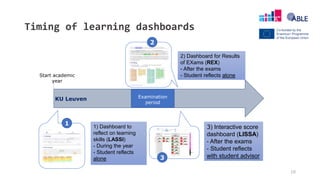
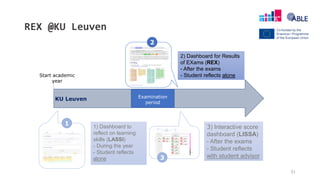
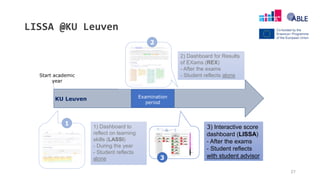
Data-based feedback
through learning
dashboards
Tinne De Laet, Rebecca Edwards
Katrien Heirwegh, Jasper Witters
Data-based feedback through
learning dashboards:
does it support the first-year experience?
2
Welcome!
3
1. General introduction
2. Learning dashboards during the year
a. LASSI
b. Student engagement dashboard
3. Learning dashboards after exam period
a. REX
b. LISSA
Content
General introduction
Learning Analytics?
“Learning analytics is
about collecting traces
that learners leave behind
and using those traces to
improve learning.”
Erik Duval
5
Learning Analytics and Educational Data Mining, Erik Duval’s Weblog, 30 January 2012, https://erikduval.wordpress.com/2012/01/30/learning-analytics-and-educational-data-mining/
Learning Dashboard?
“A dashboard is a visual
display of the most
important information
needed to achieve one or
more objectives;
consolidated and arranged
on a single screen so the
information can be
monitored at a glance.”
Stephen Few
6
Learning Analytics and Educational Data Mining, Erik Duval’s Weblog, 30 January 2012, https://erikduval.wordpress.com/2012/01/30/learning-analytics-and-educational-data-mining/
7
• Aim of the dashboards?
• make student aware of own learning
• induce self reflection
• This workshop?
• discuss and actively use 4 dashboards
Learning dashboards
8
Learning dashboards @ 2 institutions
KU Leuven
1) Dashboard to reflect on
learning skills (LASSI)
2) Dashboard for Results
of EXams (REX)
3) Interactive score
dashboard (LISSA)
NTU
Student engagement
dashboard (SED)
9
Context matters!
KU Leuven – Belgium
- BAMA structure
- Two semester system
- 16 faculties
- > 55 000 students
- ! Admission requirements:
Flemish secondary diploma
- Range of qualification types,
primarily bachelor’s degrees
- Three semester system
- 10 academic Schools
- ~30 000 students
- ! Admissions requirements:
dependant on specific course
Nottingham Trent
University
(NTU) - UK
10
Timing of learning dashboards
Start academic
year
Examination
period
1
2
3
1) Dashboard to
reflect on learning
skills (LASSI)
- During the year
- Student reflects
alone
2) Dashboard for Results
of EXams (REX)
- After the exams
- Student reflects alone
3) Interactive score
dashboard (LISSA)
- After the exams
- Student reflects
with student advisor
KU Leuven
Timing of learning dashboards
Start academic
year
Examination
period
Nottingham Trent
University
Full Name (Student ID) - Profile
Photo
Full Name (Student ID) - Assessments
1 1) Profile section of
Dashboard to help
build initial staff-tutor
relationship
- Student details
- Tutor details
2
2) Engagement,
Assessment and Notes
sections of Dashboard
- Reflect on behaviour,
assessment feedback and
staff-student interactions
Dashboard available 24/7, on and off
campus, for staff and student use.
Students see own Dashboard, staff are
mapped to relevant students’ Dashboards.
12
1. General introduction
2. Learning dashboards during the year
a. LASSI
b. Student engagement dashboard
3. Learning dashboards after exam period
a. REX
b. LISSA
Content
Learning dashboards during the year
@KU Leuven
@NTU
14
LASSI @KU Leuven
Start academic
year
Examination
period
1
2
3
1) Dashboard to
reflect on learning
skills (LASSI)
- During the year
- Student reflects
alone
2) Dashboard for Results
of EXams (REX)
- After the exams
- Student reflects alone
3) Interactive score
dashboard (LISSA)
- After the exams
- Student reflects
with student advisor
KU Leuven
LASSI – goal
let students reflect on their learning skills
• concentration
• motivation
• performance anxiety
• testing strategies
• time management
15
LASSI – how
• in the first week of the semester students fill out a validated
questionnaire (LASSI)
• questionnaire answers generate score for five scales
• students get e-mail with link to personal dashboard
16
17
3. How does this relate to others?
2. How am I doing?
1. What is this about?
@yourScore@
4. Why is this relevant?
5. What can I do about it?
18
19
5. What can I do about it?
20
SED @ NTU
Start academic
year
Examination
period
Nottingham Trent
University
Full Name (Student ID) - Profile
Photo
Full Name (Student ID) - Assessments
1
1) Profile section of
Dashboard to help
build initial staff-tutor
relationship
- Student details
- Tutor details
2
2) Engagement,
Assessment and Notes
sections of Dashboard
- Reflect on behaviour,
grades, feedback and
staff-student interactions
Dashboard available 24/7, on and off
campus, for staff and student use.
Students see own Dashboard, staff are
mapped to relevant students’ Dashboards.
21
• The dashboard contains two types of data: static data from student records,
and active engagement data
• Engagement with university calculated using six different data sources:
• Activity on the Virtual Learning Environment (VLE)
• Online coursework submissions
• Card swipes into buildings
• Attendance at monitored events
• Library loans
• E-resource usage
• Engagement is reported to students as one of 5 different engagement ratings:
High, Good, Partial, Low, Very Low
Student Engagement Dashboard
Alert sent to
tutor if student
has 14 days of
no interaction
with these
22
Engagement
23
Full Name (Student ID) - Profile
Photo
Other tables on page: Entry Qualifications, Course Change
Profile
24
Notes and Actions
25
Resources
26
Assessments
Full Name (Student ID) - Assessments
27
Attendance
Your assignment! – 20 minutes
Prepare one statement (ONE sentence) that reflects a finding/question/advice of your group.
Explore the dashboard: learningdashboards.eu
Guiding questions.
• Would this work at your institution?
• Do you think this is useful for students?
• What is the ideal timing for this dashboard?
• What are (dis)advantages of positioning with peers?
• Is the relation with study success important?
• How do you support students with this dashboard?
28
Wifi: Instituto Cervantes
password: Cerutr15
29
1. General introduction
2. Learning dashboards during the year
a. LASSI
b. Student engagement dashboard
3. Learning dashboards after exam period
a. REX
b. LISSA
Content
Learning dashboards after the exams
@KU Leuven
31
REX @KU Leuven
Start academic
year
Examination
period
1
2
3
1) Dashboard to
reflect on learning
skills (LASSI)
- During the year
- Student reflects
alone
2) Dashboard for Results
of EXams (REX)
- After the exams
- Student reflects alone
3) Interactive score
dashboard (LISSA)
- After the exams
- Student reflects
with student advisor
KU Leuven
REX – goal
• A voluntary tool for students
• Reflect on their performance
• Subjectively => satisfaction rate
• & Objectively => through a comparative format
• Tips, referral, and regulations support the (self) reflection
32
33
34
35
36
37
LISSA @KU Leuven
Start academic
year
Examination
period
1
2
3
1) Dashboard to
reflect on learning
skills (LASSI)
- During the year
- Student reflects
alone
2) Dashboard for Results
of EXams (REX)
- After the exams
- Student reflects alone
3) Interactive score
dashboard (LISSA)
- After the exams
- Student reflects
with student advisor
KU Leuven
38
LISSA - june
39
LISSA: interactive score dashboard
Guidelines for using comparative learning
dashboards in a counselling session
Relationally : acknowledge the student as a person first, let the student be the
owner of the counselling session and look for options together
40
I see you as a person
The learning
dashboard can
help you get more
insight in your
situation Ok
Guidelines for using comparative learning
dashboards in a counselling session
41
The dashboard triggers conversation and brings
depth and nuance to the counselling session
The dashboards shows
that in comparison with
other students your score
of Biophysics is low, any
idea why this is the case?
Yes, I’am
really
struggling
to apply the
theory …
What is my reality and what are my
(best) options?
LISSA – Benefits
FOR STUDY ADVISORS
• Creates overview
• Can visualize patterns
• Triggers/supports interaction
• Offers different tools after each
exam period
• Gut feeling is replaced by objective
data
FOR STUDENTS
• Helps to get an overview
• Gives an added value to the advising
session
• Is clear and correct
• Helps to get insight
42
Your assignment (bis)! – 20 minutes
Prepare one statement (ONE sentence) that reflects a finding/question/advice of your group.
Explore the dashboard: learningdashboards.eu
Guiding questions.
• Would this work at your institution?
• Do you think this is useful for students?
• What is the ideal timing for this dashboard?
• What are (dis)advantages of positioning with peers?
• Is the relation with study success important?
• How do you support students with this dashboard?
43
Wifi: Instituto Cervantes
password: Cerutr15
44
Thank you for your participation!!

Data-based feedback through learning dashboards: does it support the first-year experience?

  • 1.
    Data-based feedback through learning dashboards TinneDe Laet, Rebecca Edwards Katrien Heirwegh, Jasper Witters Data-based feedback through learning dashboards: does it support the first-year experience?
  • 2.
  • 3.
    3 1. General introduction 2.Learning dashboards during the year a. LASSI b. Student engagement dashboard 3. Learning dashboards after exam period a. REX b. LISSA Content
  • 4.
  • 5.
    Learning Analytics? “Learning analyticsis about collecting traces that learners leave behind and using those traces to improve learning.” Erik Duval 5 Learning Analytics and Educational Data Mining, Erik Duval’s Weblog, 30 January 2012, https://erikduval.wordpress.com/2012/01/30/learning-analytics-and-educational-data-mining/
  • 6.
    Learning Dashboard? “A dashboardis a visual display of the most important information needed to achieve one or more objectives; consolidated and arranged on a single screen so the information can be monitored at a glance.” Stephen Few 6 Learning Analytics and Educational Data Mining, Erik Duval’s Weblog, 30 January 2012, https://erikduval.wordpress.com/2012/01/30/learning-analytics-and-educational-data-mining/
  • 7.
    7 • Aim ofthe dashboards? • make student aware of own learning • induce self reflection • This workshop? • discuss and actively use 4 dashboards Learning dashboards
  • 8.
    8 Learning dashboards @2 institutions KU Leuven 1) Dashboard to reflect on learning skills (LASSI) 2) Dashboard for Results of EXams (REX) 3) Interactive score dashboard (LISSA) NTU Student engagement dashboard (SED)
  • 9.
    9 Context matters! KU Leuven– Belgium - BAMA structure - Two semester system - 16 faculties - > 55 000 students - ! Admission requirements: Flemish secondary diploma - Range of qualification types, primarily bachelor’s degrees - Three semester system - 10 academic Schools - ~30 000 students - ! Admissions requirements: dependant on specific course Nottingham Trent University (NTU) - UK
  • 10.
    10 Timing of learningdashboards Start academic year Examination period 1 2 3 1) Dashboard to reflect on learning skills (LASSI) - During the year - Student reflects alone 2) Dashboard for Results of EXams (REX) - After the exams - Student reflects alone 3) Interactive score dashboard (LISSA) - After the exams - Student reflects with student advisor KU Leuven
  • 11.
    Timing of learningdashboards Start academic year Examination period Nottingham Trent University Full Name (Student ID) - Profile Photo Full Name (Student ID) - Assessments 1 1) Profile section of Dashboard to help build initial staff-tutor relationship - Student details - Tutor details 2 2) Engagement, Assessment and Notes sections of Dashboard - Reflect on behaviour, assessment feedback and staff-student interactions Dashboard available 24/7, on and off campus, for staff and student use. Students see own Dashboard, staff are mapped to relevant students’ Dashboards.
  • 12.
    12 1. General introduction 2.Learning dashboards during the year a. LASSI b. Student engagement dashboard 3. Learning dashboards after exam period a. REX b. LISSA Content
  • 13.
    Learning dashboards duringthe year @KU Leuven @NTU
  • 14.
    14 LASSI @KU Leuven Startacademic year Examination period 1 2 3 1) Dashboard to reflect on learning skills (LASSI) - During the year - Student reflects alone 2) Dashboard for Results of EXams (REX) - After the exams - Student reflects alone 3) Interactive score dashboard (LISSA) - After the exams - Student reflects with student advisor KU Leuven
  • 15.
    LASSI – goal letstudents reflect on their learning skills • concentration • motivation • performance anxiety • testing strategies • time management 15
  • 16.
    LASSI – how •in the first week of the semester students fill out a validated questionnaire (LASSI) • questionnaire answers generate score for five scales • students get e-mail with link to personal dashboard 16
  • 17.
    17 3. How doesthis relate to others? 2. How am I doing? 1. What is this about? @yourScore@
  • 18.
    4. Why isthis relevant? 5. What can I do about it? 18
  • 19.
    19 5. What canI do about it?
  • 20.
    20 SED @ NTU Startacademic year Examination period Nottingham Trent University Full Name (Student ID) - Profile Photo Full Name (Student ID) - Assessments 1 1) Profile section of Dashboard to help build initial staff-tutor relationship - Student details - Tutor details 2 2) Engagement, Assessment and Notes sections of Dashboard - Reflect on behaviour, grades, feedback and staff-student interactions Dashboard available 24/7, on and off campus, for staff and student use. Students see own Dashboard, staff are mapped to relevant students’ Dashboards.
  • 21.
    21 • The dashboardcontains two types of data: static data from student records, and active engagement data • Engagement with university calculated using six different data sources: • Activity on the Virtual Learning Environment (VLE) • Online coursework submissions • Card swipes into buildings • Attendance at monitored events • Library loans • E-resource usage • Engagement is reported to students as one of 5 different engagement ratings: High, Good, Partial, Low, Very Low Student Engagement Dashboard Alert sent to tutor if student has 14 days of no interaction with these
  • 22.
  • 23.
    23 Full Name (StudentID) - Profile Photo Other tables on page: Entry Qualifications, Course Change Profile
  • 24.
  • 25.
  • 26.
  • 27.
  • 28.
    Your assignment! –20 minutes Prepare one statement (ONE sentence) that reflects a finding/question/advice of your group. Explore the dashboard: learningdashboards.eu Guiding questions. • Would this work at your institution? • Do you think this is useful for students? • What is the ideal timing for this dashboard? • What are (dis)advantages of positioning with peers? • Is the relation with study success important? • How do you support students with this dashboard? 28 Wifi: Instituto Cervantes password: Cerutr15
  • 29.
    29 1. General introduction 2.Learning dashboards during the year a. LASSI b. Student engagement dashboard 3. Learning dashboards after exam period a. REX b. LISSA Content
  • 30.
    Learning dashboards afterthe exams @KU Leuven
  • 31.
    31 REX @KU Leuven Startacademic year Examination period 1 2 3 1) Dashboard to reflect on learning skills (LASSI) - During the year - Student reflects alone 2) Dashboard for Results of EXams (REX) - After the exams - Student reflects alone 3) Interactive score dashboard (LISSA) - After the exams - Student reflects with student advisor KU Leuven
  • 32.
    REX – goal •A voluntary tool for students • Reflect on their performance • Subjectively => satisfaction rate • & Objectively => through a comparative format • Tips, referral, and regulations support the (self) reflection 32
  • 33.
  • 34.
  • 35.
  • 36.
  • 37.
    37 LISSA @KU Leuven Startacademic year Examination period 1 2 3 1) Dashboard to reflect on learning skills (LASSI) - During the year - Student reflects alone 2) Dashboard for Results of EXams (REX) - After the exams - Student reflects alone 3) Interactive score dashboard (LISSA) - After the exams - Student reflects with student advisor KU Leuven
  • 38.
  • 39.
  • 40.
    Guidelines for usingcomparative learning dashboards in a counselling session Relationally : acknowledge the student as a person first, let the student be the owner of the counselling session and look for options together 40 I see you as a person The learning dashboard can help you get more insight in your situation Ok
  • 41.
    Guidelines for usingcomparative learning dashboards in a counselling session 41 The dashboard triggers conversation and brings depth and nuance to the counselling session The dashboards shows that in comparison with other students your score of Biophysics is low, any idea why this is the case? Yes, I’am really struggling to apply the theory … What is my reality and what are my (best) options?
  • 42.
    LISSA – Benefits FORSTUDY ADVISORS • Creates overview • Can visualize patterns • Triggers/supports interaction • Offers different tools after each exam period • Gut feeling is replaced by objective data FOR STUDENTS • Helps to get an overview • Gives an added value to the advising session • Is clear and correct • Helps to get insight 42
  • 43.
    Your assignment (bis)!– 20 minutes Prepare one statement (ONE sentence) that reflects a finding/question/advice of your group. Explore the dashboard: learningdashboards.eu Guiding questions. • Would this work at your institution? • Do you think this is useful for students? • What is the ideal timing for this dashboard? • What are (dis)advantages of positioning with peers? • Is the relation with study success important? • How do you support students with this dashboard? 43 Wifi: Instituto Cervantes password: Cerutr15
  • 44.
    44 Thank you foryour participation!!

Editor's Notes

  • #3 Jasper
  • #9 Jasper
  • #10 Jasper
  • #39 New screen shot or English demo
  • #40 Link naar demo versie, demo van juni gebruiken als voorbeeld
  • #41 Ik zie je als persoon, niet als r-nummer https://www.klasse.be/archief/het-slecht-nieuwsgesprek/ Vijf fasen voor een efficiënt slecht-nieuwsgesprek 1. Bereid u goed voor Kies de geschikte tijd en plaats. Neem er ook uw tijd voor. Bereid uw argumentatie voor. 2. Houd het gesprek in de hand Houd de inleiding kort, formuleer het slecht nieuws op een directe manier en in klare taal. Probeer zonder te overdrijven een meelevende toon te hanteren. 3. Geef ruimte om het nieuws te verwerken Laat de ontvanger stoom afblazen, ook als dit even duurt. Eerbiedig zijn reactie en ga er niet onmiddellijk op in. 4. Formuleer argumenten en redenen Vroeg of laat komt de vraag «Waarom?». Geef dan kort en bondig antwoord, vermijd discussie en probeer de pil niet te verzachten, geef geen flauwe aanmoedigende opmerkingen. 5. Zoek samen naar oplossingen De vraag «Maar wat moet ik nu…?» wijst erop dat de ontvanger het nieuws min of meer heeft verwerkt en begint te denken aan de toekomst. U kunt zelf oplossingen bedenken of met gepaste vragen het vinden van eigen oplossingen stimuleren.
  • #43 Katrien
  • #46 Hernemen tijdslijn slide Jasper, context REX schetsen
  • #49 Screenshots toevoegen of link naar ENG versie REX?
  • #50 Feedback van studenten opnemen?