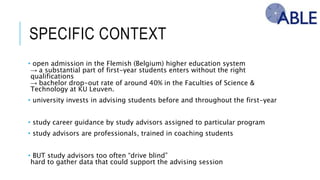
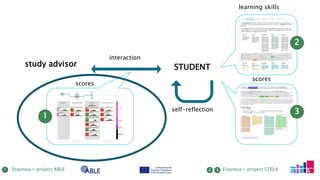
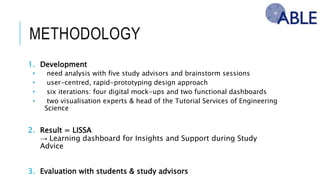
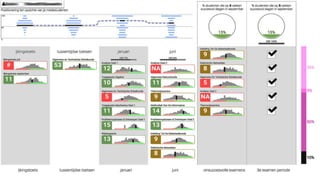
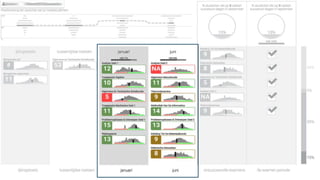
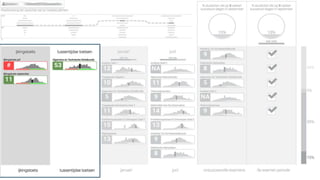
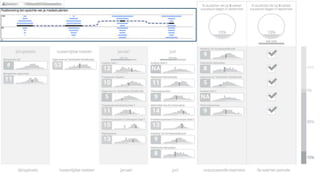
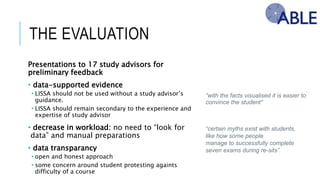
LEARNING ANALYTICS DASHBOARD TO
SUPPORT THE LIVE INTERACTION BETWEEN
STUDENT ADVISOR AND STUDENT
Tinne De Laet
KU Leuven, Belgium
OUTLINE
1. Who am I? Why I am here?
2. What is learning analytics?
3. Specific context & methodology
4. Results
5. Conclusion & reflections
WHO AM I? WHY I AM HERE?
woman
engineer
Head Tutorial Services
Engineering Science
KU Leuven, Belgium
.
Tinne De Laet
associate
professor
WHO AM I? WHY I AM HERE?
Head of Tutorial Services of Engineering
Science KU Leuven
• Daily experiences of challenges in transition from
secondary to higher education
• looking for opportunities for cross-fertilization
between “first-year experience” and “engineering”
•Strategic Partnership: 2015-1-UK01-KA203-013767
•Achieving Benefits from Learning Analytics
•Nottingham Trent University (UK), KU Leuven (Belgium),
Leiden University (Netherlands)
• http://www.ableproject.eu/
KU Leuven promotor of ABLE
Erasmus+ strategic partnership project
WHAT IS LEARNING ANALYTICS?
no universally agreed definition
7
“the measurement, collection, analysis and reporting of data about learners and their
contexts, for purposes of understanding and optimizing learning and the environments in
which it occurs” [1]
[1] Learning and Academic Analytics, Siemens, G., 5 August 2011, http://www.learninganalytics.net/?p=131
[2] What is Analytics? Definition and Essential Characteristics, Vol. 1, No. 5. CETIS Analytics Series, Cooper, A.,
http://publications.cetis.ac.uk/2012/521
“the process of developing actionable insights through problem definition and the
application of statistical models and analysis against existing and/or simulated future
data” [2]
WAT IS LEARNING ANALYTICS?
8
[3] Learning Analytics and Educational Data Mining, Erik Duval’s Weblog, 30 January 2012,
https://erikduval.wordpress.com/2012/01/30/learning-analytics-and-educational-data-mining/
“learning analytics is about collecting
traces that learners leave behind and
using those traces to improve learning”
[Erik Duval, 3]
† 12 March 2016
no universally agreed definition
IS IT ABOUT INSTITUTIONAL DATA?
•high-level figures:
provide an overview for internal and external reports;
used for organisational planning purposes.
•academic analytics:
figures on retention and success, used by the institution to assess performance.
•educational data mining:
searching for patterns in the data.
•learning analytics:
use of data, which may include ‘big data’,
to provide actionable intelligence for learners and teachers.
[4] Learning analytics FAQs, Rebecca Ferguson, Slideshare,
http://www.slideshare.net/R3beccaF/learning-analytics-fa-qs
SPECIFIC CONTEXT & METHODOLOGY
SPECIFIC CONTEXT
• open admission in the Flemish (Belgium) higher education system
→ a substantial part of first-year students enters without the right qualifications
→ bachelor drop-out rate of around 40% in the Faculties of Science & Technology at KU
Leuven.
• university invests in advising students before and throughout the first-year
• study career guidance by study advisors assigned to particular program
• study advisors are professionals, trained in coaching students
• BUT study advisors too often “drive blind”
hard to gather data that could support the advising session
interaction
self-reflection
1
2
3
scores
scores
learning skills
study advisor STUDENT
1 Erasmus+ project ABLE 2 Erasmus+ project STELA3
METHODOLOGY
1. Development
• need analysis with five study advisors and brainstorm sessions
• user-centred, rapid-prototyping design approach
• six iterations: four digital mock-ups and two functional dashboards
• two visualisation experts & head of the Tutorial Services of Engineering Science
2. Result = LISSA
→ Learning dashboard for Insights and Support during Study Advice
3. Evaluation with students & study advisors
RESULTS
THE EVALUATION
Presentations to 17 study advisors for preliminary
feedback
• data-supported evidence
• LISSA should not be used without a study advisor’s guidance.
• LISSA should remain secondary to the experience and expertise of
study advisor
• decrease in workload: no need to “look for data” and
manual preparations
• data transparancy
• open and honest approach
• some concern around student protesting againts difficulty of a course
“with the facts visualised it is easier to
convince the student”
“certain myths exist with students,
like how some people
manage to successfully complete
seven exams during re-sits”.
THE EVALUATION
97 sessions, interview of study advisors,
15 sessions observed
LISSA supporting a personal dialogue
• the level of usage depends on the experience of the
study advisors
• fact-based evidence at the side
• narrative thread
• key moments and student path help to reconstruct
personal track
“When I show them the number of students that
succeed seven or eight exams, they are
surprised, but now they believe me. Before, I
used my gut feeling, now I feel
more certain of what I say as well”.
“It’s like a main thread guiding the conversation”
“I can talk about what to do with the results,
instead of each time looking for the data, and
puzzling it together”
“Students don’t know where to look during the
conversation, and avoid eye contact. The
dashboard provides them a point of focus”.
“I have changed my study method in June and
now see it paid off.”
THE EVALUATION
the student evaluation
CONCLUSION AND REFLECTIONS
DISCUSSION AND LESSONS LEARNT
• Learning Analytics data
• only data that is available at any higher education institute is used
• now easily available to study advisors
• Visualisation
• minimal design without animations as LISSA is a mere supportive tool, allowing focus on the contextualisation and not on the
dashboard features itself
• visual encoding of information provide fast and easy overview (e.g. color coding of failed courses)
• Study advisor
• The role of the study advisor is key: critical and reflective interpretation, coaching
• LISSA leaves room for personal opinion and tacit experience
• Transparancy
• LISSA uses data transparently
• not always desired to use with student with really bad results (demotivation), but can also motivate students
• comparison to peers is not considered desired by all study advisors
• senstive nature of histograms of courses
CONCLUSION AND REFLECTIONS
• study advisors and student “like” LISSA
• LISSA is a mere supportive tool
• expertise of study advisors is key
Future
• repeat interventions and extend (KU Leuven and Leiden University)
• extend dashboard with other student data
looking how student background data can be integrated in an ethical manner
• qualitative analysis using focus groups and structured interviews with students
MORE READING?
http://ieeexplore.ieee.org/document/7959628/

ABLE project presentation EFYE 2017

  • 1.
    LEARNING ANALYTICS DASHBOARDTO SUPPORT THE LIVE INTERACTION BETWEEN STUDENT ADVISOR AND STUDENT Tinne De Laet KU Leuven, Belgium
  • 2.
    OUTLINE 1. Who amI? Why I am here? 2. What is learning analytics? 3. Specific context & methodology 4. Results 5. Conclusion & reflections
  • 3.
    WHO AM I?WHY I AM HERE?
  • 4.
    WHO AM I?WHY I AM HERE? woman engineer Head Tutorial Services Engineering Science KU Leuven, Belgium . Tinne De Laet associate professor
  • 5.
    WHO AM I?WHY I AM HERE? Head of Tutorial Services of Engineering Science KU Leuven • Daily experiences of challenges in transition from secondary to higher education • looking for opportunities for cross-fertilization between “first-year experience” and “engineering” •Strategic Partnership: 2015-1-UK01-KA203-013767 •Achieving Benefits from Learning Analytics •Nottingham Trent University (UK), KU Leuven (Belgium), Leiden University (Netherlands) • http://www.ableproject.eu/ KU Leuven promotor of ABLE Erasmus+ strategic partnership project
  • 6.
    WHAT IS LEARNINGANALYTICS?
  • 7.
    WHAT IS LEARNINGANALYTICS? no universally agreed definition 7 “the measurement, collection, analysis and reporting of data about learners and their contexts, for purposes of understanding and optimizing learning and the environments in which it occurs” [1] [1] Learning and Academic Analytics, Siemens, G., 5 August 2011, http://www.learninganalytics.net/?p=131 [2] What is Analytics? Definition and Essential Characteristics, Vol. 1, No. 5. CETIS Analytics Series, Cooper, A., http://publications.cetis.ac.uk/2012/521 “the process of developing actionable insights through problem definition and the application of statistical models and analysis against existing and/or simulated future data” [2]
  • 8.
    WAT IS LEARNINGANALYTICS? 8 [3] Learning Analytics and Educational Data Mining, Erik Duval’s Weblog, 30 January 2012, https://erikduval.wordpress.com/2012/01/30/learning-analytics-and-educational-data-mining/ “learning analytics is about collecting traces that learners leave behind and using those traces to improve learning” [Erik Duval, 3] † 12 March 2016 no universally agreed definition
  • 9.
    IS IT ABOUTINSTITUTIONAL DATA? •high-level figures: provide an overview for internal and external reports; used for organisational planning purposes. •academic analytics: figures on retention and success, used by the institution to assess performance. •educational data mining: searching for patterns in the data. •learning analytics: use of data, which may include ‘big data’, to provide actionable intelligence for learners and teachers. [4] Learning analytics FAQs, Rebecca Ferguson, Slideshare, http://www.slideshare.net/R3beccaF/learning-analytics-fa-qs
  • 10.
    SPECIFIC CONTEXT &METHODOLOGY
  • 11.
    SPECIFIC CONTEXT • openadmission in the Flemish (Belgium) higher education system → a substantial part of first-year students enters without the right qualifications → bachelor drop-out rate of around 40% in the Faculties of Science & Technology at KU Leuven. • university invests in advising students before and throughout the first-year • study career guidance by study advisors assigned to particular program • study advisors are professionals, trained in coaching students • BUT study advisors too often “drive blind” hard to gather data that could support the advising session
  • 12.
    interaction self-reflection 1 2 3 scores scores learning skills study advisorSTUDENT 1 Erasmus+ project ABLE 2 Erasmus+ project STELA3
  • 13.
    METHODOLOGY 1. Development • needanalysis with five study advisors and brainstorm sessions • user-centred, rapid-prototyping design approach • six iterations: four digital mock-ups and two functional dashboards • two visualisation experts & head of the Tutorial Services of Engineering Science 2. Result = LISSA → Learning dashboard for Insights and Support during Study Advice 3. Evaluation with students & study advisors
  • 21.
  • 22.
    THE EVALUATION Presentations to17 study advisors for preliminary feedback • data-supported evidence • LISSA should not be used without a study advisor’s guidance. • LISSA should remain secondary to the experience and expertise of study advisor • decrease in workload: no need to “look for data” and manual preparations • data transparancy • open and honest approach • some concern around student protesting againts difficulty of a course “with the facts visualised it is easier to convince the student” “certain myths exist with students, like how some people manage to successfully complete seven exams during re-sits”.
  • 23.
    THE EVALUATION 97 sessions,interview of study advisors, 15 sessions observed LISSA supporting a personal dialogue • the level of usage depends on the experience of the study advisors • fact-based evidence at the side • narrative thread • key moments and student path help to reconstruct personal track “When I show them the number of students that succeed seven or eight exams, they are surprised, but now they believe me. Before, I used my gut feeling, now I feel more certain of what I say as well”. “It’s like a main thread guiding the conversation” “I can talk about what to do with the results, instead of each time looking for the data, and puzzling it together” “Students don’t know where to look during the conversation, and avoid eye contact. The dashboard provides them a point of focus”. “I have changed my study method in June and now see it paid off.”
  • 24.
  • 25.
  • 26.
    DISCUSSION AND LESSONSLEARNT • Learning Analytics data • only data that is available at any higher education institute is used • now easily available to study advisors • Visualisation • minimal design without animations as LISSA is a mere supportive tool, allowing focus on the contextualisation and not on the dashboard features itself • visual encoding of information provide fast and easy overview (e.g. color coding of failed courses) • Study advisor • The role of the study advisor is key: critical and reflective interpretation, coaching • LISSA leaves room for personal opinion and tacit experience • Transparancy • LISSA uses data transparently • not always desired to use with student with really bad results (demotivation), but can also motivate students • comparison to peers is not considered desired by all study advisors • senstive nature of histograms of courses
  • 27.
    CONCLUSION AND REFLECTIONS •study advisors and student “like” LISSA • LISSA is a mere supportive tool • expertise of study advisors is key Future • repeat interventions and extend (KU Leuven and Leiden University) • extend dashboard with other student data looking how student background data can be integrated in an ethical manner • qualitative analysis using focus groups and structured interviews with students
  • 28.