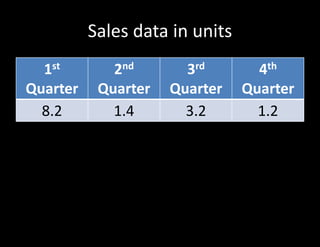
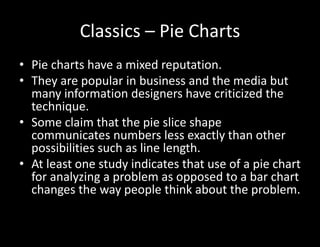
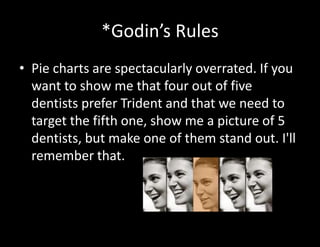
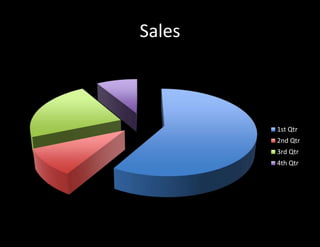
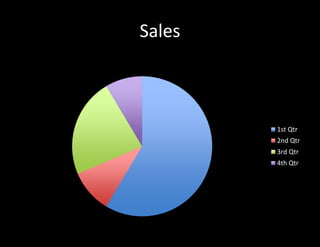
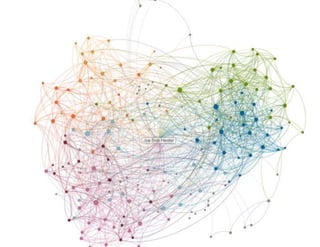
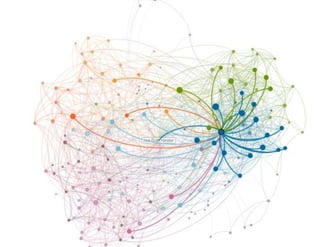
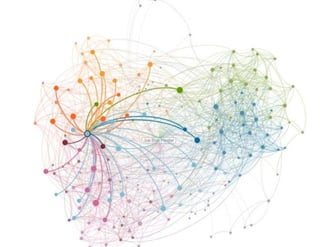
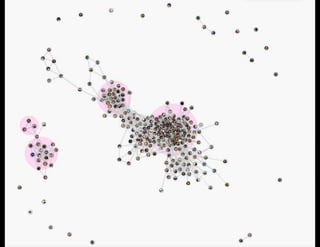
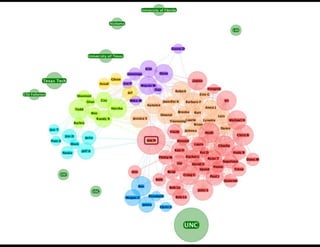
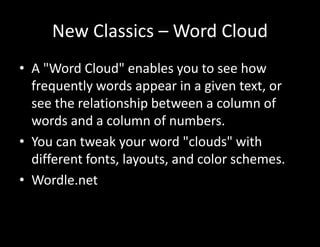
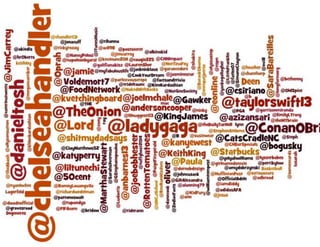
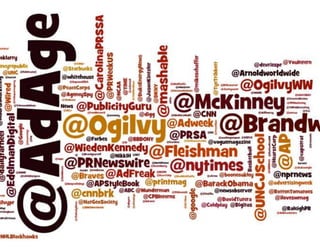
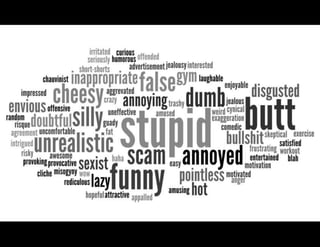
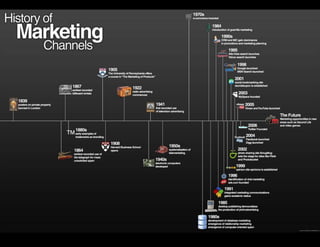
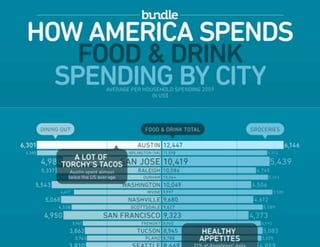
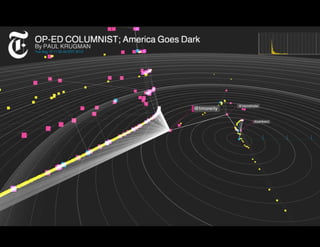
This document discusses various methods for data visualization including the classics of tables, pie charts, line graphs and bar charts. It provides advice on effective visualization from Seth Godin including telling a story, following simple rules like having time go from left to right, and breaking rules. Newer techniques like network diagrams, word clouds and infographics are presented. The future of data visualization is said to involve precise analysis of data propagation online using tools like the NYT Cascade project.