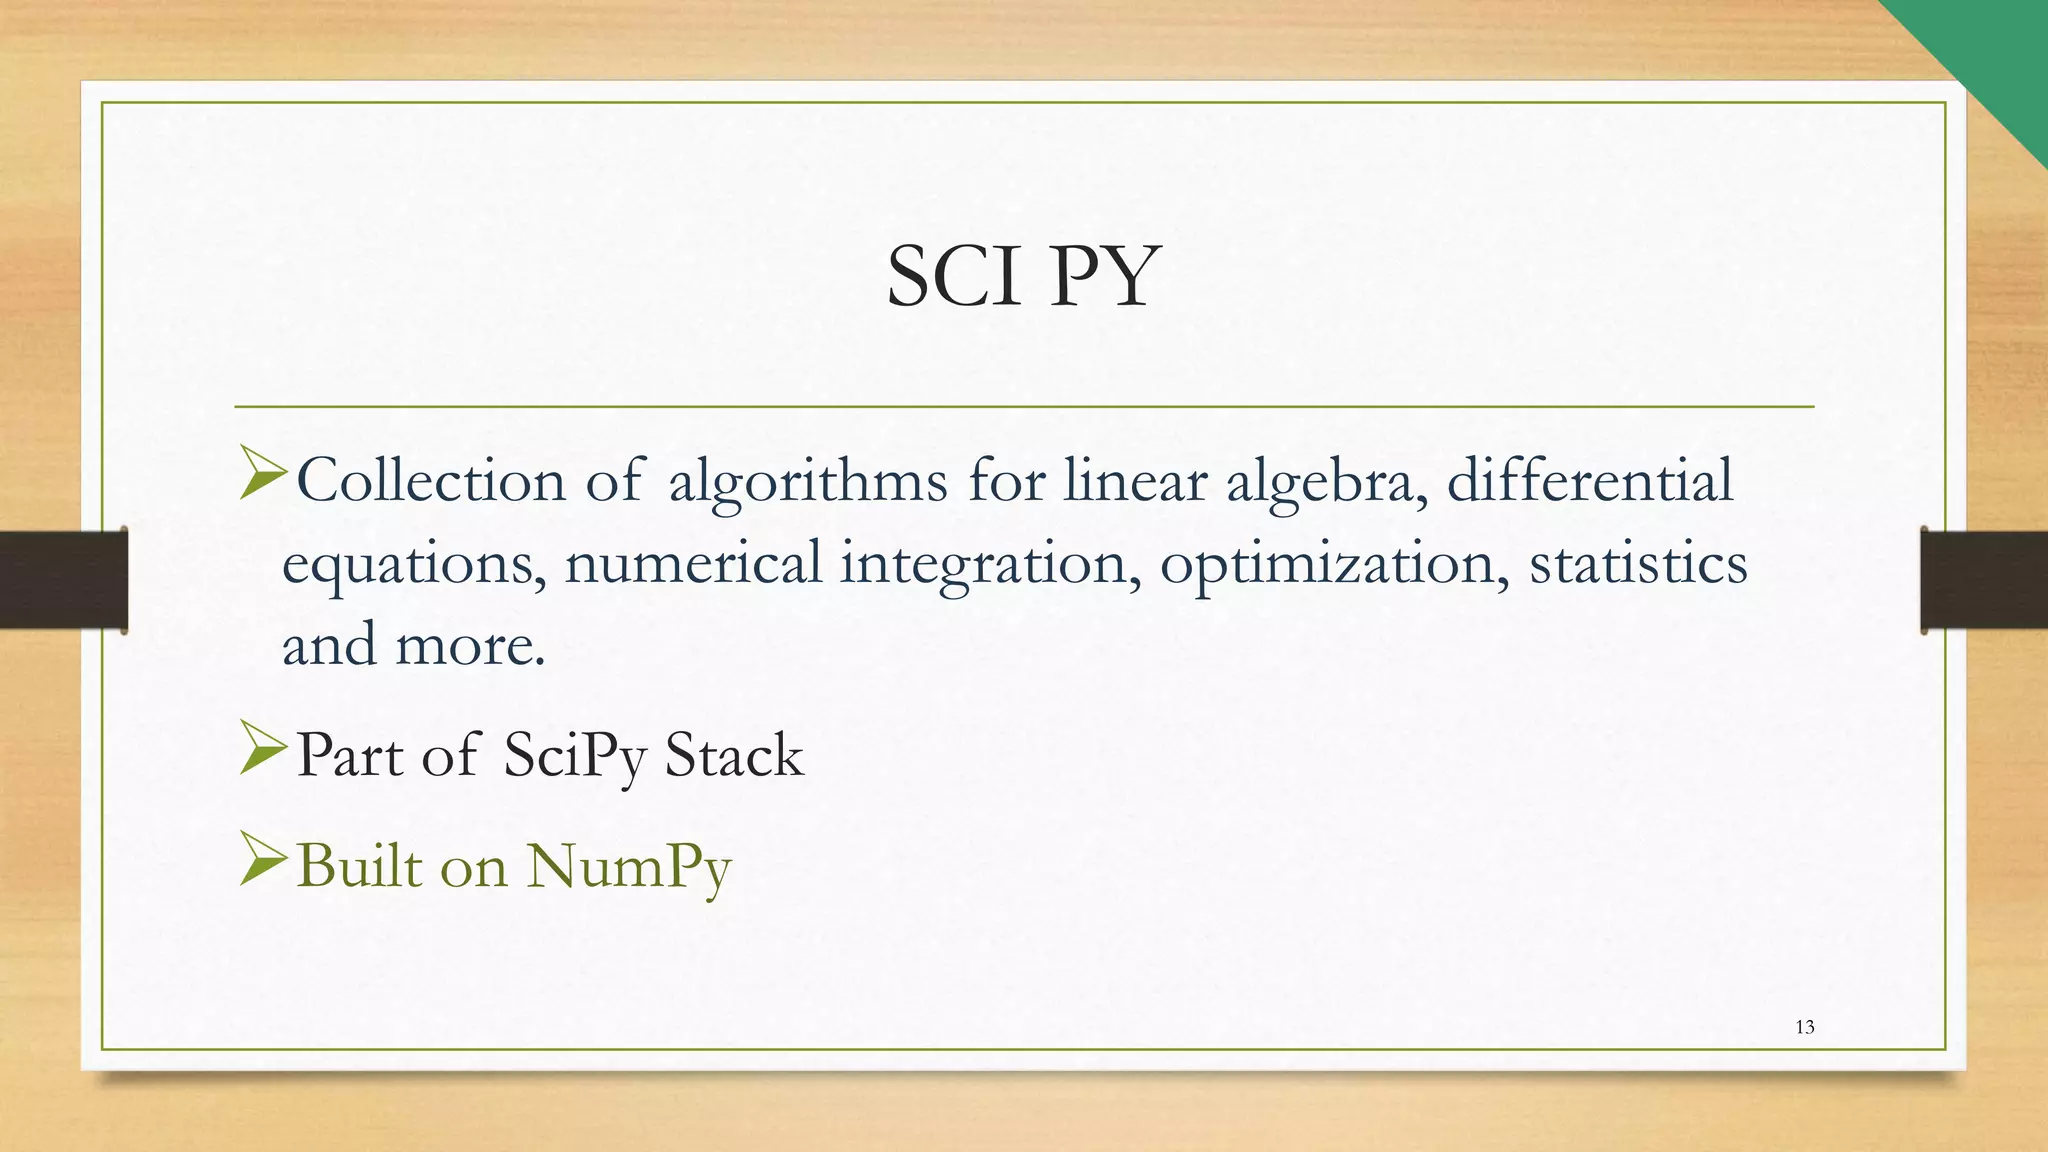
DATA SCIENCE
NIMIT JAIN
(252101141)
AGENDA
 INTRODUCTION
 PYTHON FOR DATA SCIENCE
 UNDERSTANDING THE STATSTICS FOR DATA
SCIENCE
 PREDICTIVE MODELING AND MACHINE LEARNING
2
DATA SCIENCE =
DATA+SCIENCE
The field of bringing out insights from data
using scientific techniques is called data
science.
3
TERMINOLOGOES USED IN
DATA SCIENCE
MIS/Reporting
Detective Analysis
Dashboarding
Predictive Modelling/Machine learning
Bigdata
Forecasting
Business Intelligence
4
FORECASTING - It is a process of predicting or
estimating the future based on past and present data.
Predictive Modelling – It is used to perform prediction
more granular like “who are the customer who are
likely to buy a product in next month?” and then act
accordingly.
Machine Learning – It is a method of teaching machine
to learn things and improve predictions based on data
on their own.
Detective Analysis – Analysing past data and no future
outcome or forecast.
5
6
20XX Pitch deck title 7
PYTHON FOR DATA
SCIENCE
 Operators
 Variables and variables naming conventions
 Data types in python
 Conditional statements
 Looping statements
 Functions
 Libraries in python
8
LIBRARIES USED
NumPy Sci Py Pandas
Matplotlib
9
PANDASPanel Data System
Pandas is an open source, BSD-licensed library.
High-performance, easy-to-use data structures.
Provides data analysis and data manipulation
tools (reshaping, merging, sorting, slicing,
aggregation etc.)
Allow handling missing data.
Reading different varieties of Data
10
NUMPY
11
Introduces objects for multidimensional arrays
and matrices, as well as functions that allow to
easily perform advanced mathematical and
statistical operations on those objects
Provides vectorization of mathematical
operations on arrays and matrices which
significantly improves the performance
Many other python libraries are built on NumPy.
MATPLOTLIB
Python 2D plotting library which produces
publication quality figures in a variety of
hardcopy formats
A set of functionalities similar to those of MATLAB
 Line plots, scatter plots, Bar Charts, histograms,
pie charts etc.
Relatively low-level; some effort needed to
create advanced visualization
12
SCI PY
Collection of algorithms for linear algebra, differential
equations, numerical integration, optimization, statistics
and more.
Part of SciPy Stack
Built on NumPy
13
STATISTICAL
USE
DESCRIPTIVE STASTICS
FREQUENCY DISTRIBUTION
It is a table that displays the frequency of various outcome in a sample.
MEASURE OF CENTRAL TENDENCY
 MEAN
 MEDIAN
 MODE
Descriptive statistics describe, show, and summarize
the basic features of a dataset found in a given study,
presented in a summary that describes the data sample
and its measurements. It helps analysts to understand
the data better.
15
MEASURES OF VARIABILITY
• RANGE
• STANDARD DEVIATION
• VARIANCE
UNIVARIATE DESCRIPTIVE STATSTICS
Statistics focused on only one variable at a time
BIVARIATE DECRIPTIVE STASTICS
o SCATTERPLOT
o CONTIGENCY TABLE
16
INFERENTIAL
STATISTICS
17
Statistical method that deduce
from small but representative
sample the characterstics of a
bigger population.
REGRESSION ANALYSIS
 LINEAR REGRESSION
 NOMINAL REGRESSION
 LOGISTIC REGRESSION
 ORDINAL REGRESSION
18
PREDECTIVE
MODELING
19
PREDICTIVE MODELLING
Making use of past data and other attributes
and predict the future using this data.
20
TYPES OF PREDICTIVE
MODELS
SUPERVISED
LEARNING
UNSUPERVISED
LEARNING
21
PRODUCT OVERVIEW
UNIQUE
Only product specifically dedicated to
this niche market
TESTED
Conducted testing with college students in
the area
FIRST TO MARKET
First beautifully designed product that's
both stylish and functional
AUTHENTIC
Designed with the help and input of
experts in the field
20XX Pitch deck title 22
 PROBLEM DEFINATION – This initial phase of data mining project focuses on
understanding the project objectives and requirements.
 HYPOTHESIS GENERATION – It helps in comprehending the business problem as we dive
deep inferring the various factor affecting our target variables and we get a much better idea of
what are the major factor that are responsible to solve the problem.
 DATA EXTRACTON – It is a process of obtaining data from a database or SaaS platform.
 DATA EXPLORATION – It is approach similar to initial data analysis whereby a data analyst
use visual exploration to understand what is in a dataset and characterstics of dataset.
 MODEL DEPLOYMENT- The concept of deployment in data science refers to the
application of a model for prediction using a new data.
23
THANK YOU

DATA SCIENCE PPT. (HARSH GAUTAM).pptx

  • 1.
  • 2.
    AGENDA  INTRODUCTION  PYTHONFOR DATA SCIENCE  UNDERSTANDING THE STATSTICS FOR DATA SCIENCE  PREDICTIVE MODELING AND MACHINE LEARNING 2
  • 3.
    DATA SCIENCE = DATA+SCIENCE Thefield of bringing out insights from data using scientific techniques is called data science. 3
  • 4.
    TERMINOLOGOES USED IN DATASCIENCE MIS/Reporting Detective Analysis Dashboarding Predictive Modelling/Machine learning Bigdata Forecasting Business Intelligence 4
  • 5.
    FORECASTING - Itis a process of predicting or estimating the future based on past and present data. Predictive Modelling – It is used to perform prediction more granular like “who are the customer who are likely to buy a product in next month?” and then act accordingly. Machine Learning – It is a method of teaching machine to learn things and improve predictions based on data on their own. Detective Analysis – Analysing past data and no future outcome or forecast. 5
  • 6.
  • 7.
  • 8.
    PYTHON FOR DATA SCIENCE Operators  Variables and variables naming conventions  Data types in python  Conditional statements  Looping statements  Functions  Libraries in python 8
  • 9.
    LIBRARIES USED NumPy SciPy Pandas Matplotlib 9
  • 10.
    PANDASPanel Data System Pandasis an open source, BSD-licensed library. High-performance, easy-to-use data structures. Provides data analysis and data manipulation tools (reshaping, merging, sorting, slicing, aggregation etc.) Allow handling missing data. Reading different varieties of Data 10
  • 11.
    NUMPY 11 Introduces objects formultidimensional arrays and matrices, as well as functions that allow to easily perform advanced mathematical and statistical operations on those objects Provides vectorization of mathematical operations on arrays and matrices which significantly improves the performance Many other python libraries are built on NumPy.
  • 12.
    MATPLOTLIB Python 2D plottinglibrary which produces publication quality figures in a variety of hardcopy formats A set of functionalities similar to those of MATLAB  Line plots, scatter plots, Bar Charts, histograms, pie charts etc. Relatively low-level; some effort needed to create advanced visualization 12
  • 13.
    SCI PY Collection ofalgorithms for linear algebra, differential equations, numerical integration, optimization, statistics and more. Part of SciPy Stack Built on NumPy 13
  • 14.
  • 15.
    DESCRIPTIVE STASTICS FREQUENCY DISTRIBUTION Itis a table that displays the frequency of various outcome in a sample. MEASURE OF CENTRAL TENDENCY  MEAN  MEDIAN  MODE Descriptive statistics describe, show, and summarize the basic features of a dataset found in a given study, presented in a summary that describes the data sample and its measurements. It helps analysts to understand the data better. 15
  • 16.
    MEASURES OF VARIABILITY •RANGE • STANDARD DEVIATION • VARIANCE UNIVARIATE DESCRIPTIVE STATSTICS Statistics focused on only one variable at a time BIVARIATE DECRIPTIVE STASTICS o SCATTERPLOT o CONTIGENCY TABLE 16
  • 17.
    INFERENTIAL STATISTICS 17 Statistical method thatdeduce from small but representative sample the characterstics of a bigger population.
  • 18.
    REGRESSION ANALYSIS  LINEARREGRESSION  NOMINAL REGRESSION  LOGISTIC REGRESSION  ORDINAL REGRESSION 18
  • 19.
  • 20.
    PREDICTIVE MODELLING Making useof past data and other attributes and predict the future using this data. 20
  • 21.
  • 22.
    PRODUCT OVERVIEW UNIQUE Only productspecifically dedicated to this niche market TESTED Conducted testing with college students in the area FIRST TO MARKET First beautifully designed product that's both stylish and functional AUTHENTIC Designed with the help and input of experts in the field 20XX Pitch deck title 22
  • 23.
     PROBLEM DEFINATION– This initial phase of data mining project focuses on understanding the project objectives and requirements.  HYPOTHESIS GENERATION – It helps in comprehending the business problem as we dive deep inferring the various factor affecting our target variables and we get a much better idea of what are the major factor that are responsible to solve the problem.  DATA EXTRACTON – It is a process of obtaining data from a database or SaaS platform.  DATA EXPLORATION – It is approach similar to initial data analysis whereby a data analyst use visual exploration to understand what is in a dataset and characterstics of dataset.  MODEL DEPLOYMENT- The concept of deployment in data science refers to the application of a model for prediction using a new data. 23
  • 24.