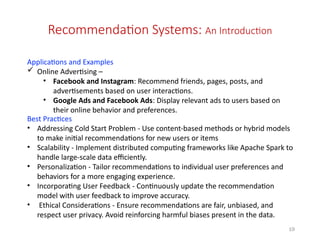
Feature Generation & Feature Selection
MODULE-3
Contents
1. Extracting meaning from data : An Introduction
2. Feature Generation : Brainstorming; Role of Domain Expertise; Place of Imagination
3. Feature Selection Algorithms
4. Filters
5. Wrappers
6. Decision Trees
7. Random Forests
8. Recommendation Systems
9. Building a User-Facing Data Product
2
Contents …contd
10. Algorithmic Ingredients of a Recommendation Engine
11. Dimensionality Reduction
12. Singular Value decomposition
13. Principal Component Analysis
14. Exercise: Build your own recommendation System
3
Extracting meaning from data involves turning raw data into actionable insights or valuable
knowledge. Here's a simplified breakdown of the process:
 Understanding the Context:
 What questions are you trying to answer?
 What problem are you trying to solve?
Understanding the context helps frame the analysis and guide the interpretation of results.
 Data Exploration: Explore the data to gain familiarity with its structure, content, and
quality
 Summary statistics
 visualizations (e.g., histograms, scatter plots)
 identifying any anomalies or patterns
4
Extracting Meaning from Data : An Introduction
 Data Cleaning and Preparation: Data is rarely perfect. It may contain missing values,
outliers, or errors that need to be addressed. Involves tasks such as:
 Imputing missing values
 Removing duplicates
 Handling outliers to ensure the data is suitable for analysis
 Feature Engineering: Involves creating new features or transforming
existing ones to improve the performance of machine learning models
or enhance insights. This may include tasks like:
 scaling numerical features
 encoding categorical variables
 creating interaction terms
5
Extracting Meaning from Data : An Introduction
 Statistical Analysis: Apply statistical techniques to uncover relationships, correlations, or trends
within the data. Involves tasks such as:
 Hypothesis testing
 Regression analysis
 Time series analysis, or other statistical methods.
Depends on the nature of the data and the questions being explored.
 Machine Learning and Predictive Modeling: machine learning models can be trained
on the data to make accurate predictions or classifications. This may include tasks like:
 Model selection
 Training
 Evaluation
 Fine-tuning
6
Extracting Meaning from Data : An Introduction
 Interpretation and Visualization: Once analysis is performed, interpret the results in the
context of the original questions or objectives. Visualizations include:
 Charts
 Graphs
 dashboards
Can help communicate key findings and insights in a clear and compelling manner.
 Validation and Iteration: Validate the findings and conclusions through robust
testing, validation, or peer review. This may include iterations on the analysis
based on:
 Feedback
 New data
 Changes in the problem domain.
7
Extracting Meaning from Data : An Introduction
 Actionable Insights: The ultimate goal of extracting meaning from data is to
generate actionable insights that drive decision-making or inform strategies. These
insights should be:
 Relevant
 Reliable
 Impactful
 Helping stakeholders make informed decisions or take meaningful actions
 Continuous Learning and Improvement : Data analysis is an ongoing
process. Continuously seek to improve your skills, methodologies, and
approaches to extracting meaning from data. Embrace feedback, stay
updated on emerging techniques and technologies, and never stop learning.
8
Extracting Meaning from Data : An Introduction
 Actionable Insights: Once analysis is performed, interpret the results in the context of the
original questions or objectives. Visualizations include:
 Charts
 Graphs
 dashboards
Can help communicate key findings and insights in a clear and compelling manner.
 Validation and Iteration: Validate the findings and conclusions through
robust testing, validation, or peer review. This may include iterations on the
analysis based on:
 Feedback
 New data
 Changes in the problem domain.
9
Extracting Meaning from Data : An Introduction
• Feature generation, also known as feature engineering, is the
process of creating new features from existing data to
improve the performance of machine learning models or
enhance insights derived from the data.
Here are some common techniques for feature generation
• Polynomial Features: This can capture nonlinear
relationships between variables.
• Interaction Terms: Create interaction terms by combining
two or more features through multiplication or other
mathematical operations.
• Binning or Discretization: Group numerical features into bins
or discrete categories. This can help simplify complex
relationships and reduce noise in the data.
• Encoding Categorical Variables: Convert categorical variables
into numerical representations using techniques like
 one-hot encoding
 Label encoding, or target encoding
This allows categorical variables to be used as features in
machine learning models.
10
Feature Generation: An Introduction
Figure 1b : One hot encoding
Figure 1(a)
• Feature Scaling : Scale numerical features to a similar
range, such as normalization (scaling features to have a
mean of 0 and a standard deviation of 1) or min-max
scaling (scaling features to a range between 0 and 1).
This can Improve the performance of various
algorithms.
• Datetime Features : his can capture seasonal or time-
dependent patterns in the data.
• Text Features: : Process and extract features from text
data, such as word counts, TF-IDF (Term Frequency-
Inverse Document Frequency) scores, or word
embeddings.
• Feature Aggregation : Aggregate multiple features to
create new summary statistics, such as means, medians,
standard deviations, or counts.
• Domain-specific Features: Create features that are
specific to the problem domain or subject matter
expertise.
11
Feature Generation: An Introduction… contd.
Figure 1b : One hot encoding
Figure 1(a)
• Domain-specific Features: Create features that are
specific to the problem domain or subject matter
expertise.
• Dimensionality Reduction: Techniques like Principal
component analysis (PCA) or feature selection to
reduce the dimensionality of the feature space while
preserving as much information as possible. This can
help reduce computational complexity and improve
model generalization.
• Feature Crosses: Combine features from different
sources or domains to create new composite features.
Complex relationships or interactions that may not be
apparent from individual features alone can be
captured like this.
• Derived Features: Create features derived from
business rules, logical conditions, or transformations
applied to existing features. This can encode specific
domain knowledge or hypotheses about the data.
12
Feature Generation: An Introduction… contd.
Figure 1b : One hot encoding
Figure 1(a)
Filter Methods
• Variance Thresholding:
 Features with low variance (little change across samples) are removed, assuming
they carry less information.
• Correlation Coefficient:
• Chi-Square Test:
 For categorical data, the chi-square test assesses the association between each
feature and the target variable
• Mutual Information:
 Measures the dependency between each feature and the target variable. Higher
mutual information indicates a higher relevance of the feature.
13
Feature Selection Methods:
Filter methods rely on the statistical properties of the data to select features. They
are usually fast and independent of the machine learning algorithm used.
Wrapper Methods
• Forward Selection: :
 Starts with an empty set of features and adds features one by one, selecting the one
that improves model performance the most at each step.
• Backward Elimination:
 Starts with all features and removes them one by one, eliminating the least
significant feature at each step
• Recursive Feature Elimination (RFE):
 Fits a model and removes the least significant features recursively until the desired
number of features is reached
14
Feature Selection Methods:
Wrapper methods evaluate feature subsets based on model performance. They are
generally more accurate than filter methods but can be computationally expensive.
Embedded Methods
• LASSO (Least Absolute Shrinkage and Selection Operator):
 Adds a penalty equal to the absolute value of the magnitude of coefficients,
effectively shrinking some coefficients to zero, thereby selecting a simpler model.
• Ridge Regression:
 Adds a penalty equal to the square of the magnitude of coefficients, which can help
with multicollinearity and feature selection
• Elastic Net: Combines LASSO and Ridge penalties to encourage a grouping effect
where correlated features are selected together.
• Tree-Based Methods: Decision trees, random forests, and gradient boosting
machines inherently perform feature selection by considering feature importance
through metrics like Gini impurity or information gain.
15
Feature Selection Methods:
Embedded methods perform feature selection during the model training process.
They are specific to the machine learning algorithm used.
16
Recommendation Systems: An Introduction
• Algorithms designed to suggest relevant items to users.
• Widely used in various industries, including e-commerce, streaming services, social
media, and more.
• There are several types of recommendation systems, each employing different
methods to make recommendations.
Types of Recommendation Systems:
 Collaborative Filtering –
 User-Based Collaborative Filtering: Finds users similar to the target
user and recommends items those users have liked.
 Item-Based Collaborative Filtering: Recommends items that are
similar to items the target user has liked.
 Content-Based Filtering - Recommends items similar to those the user
has liked in the past by analyzing the attributes of the items
 Hybrid Systems - Combines collaborative filtering and content-based
filtering to overcome the limitations of each approach.
 Knowledge-Based Systems - Uses domain knowledge about how certain
item features meet user needs and preferences.
17
Recommendation Systems: An Introduction
Types of Recommendation Systems… contd:
 Knowledge-Based Systems– Uses domain knowledge about how certain item
features meet user needs and preferences.
 Context-Aware Systems - Takes into account contextual information like time,
location, and the user's current activity to make recommendations.
 Deep Learning-Based Systems - Employs deep learning techniques to model
complex patterns and relationships in the data.
Key Techniques and Algorithms
 Matrix Factorization - Techniques like Singular Value Decomposition (SVD) and
Alternating Least Squares (ALS) to decompose the user-item interaction matrix
into latent factors.
 Nearest Neighbors - Algorithms such as k-Nearest Neighbors (k-NN) for finding
similar users or items.
 Classification and Regression Models - Machine learning models such as
decision trees, support vector machines, and logistic regression to predict user
preferences.
18
Recommendation Systems: An Introduction
Key Techniques and Algorithms
 Neural Networks - Models like autoencoders, Convolutional Neural Networks
(CNNs), and Recurrent Neural Networks (RNNs) for capturing complex user-
item interactions.
 Factorization Machines - A generalization of matrix factorization that can
handle sparse data and incorporate additional context variables.
Applications and Examples
 E-commerce –
• Amazon: Suggests products based on user browsing and purchase
history.
 Streaming Services –
• Netflix and Spotify: Recommend movies, TV shows, and music based on
user preferences and behavior.
 Social Media –
• Facebook and Instagram: Recommend friends, pages, posts, and
advertisements based on user interactions.
19
Recommendation Systems: An Introduction
Applications and Examples
 Online Advertising –
• Facebook and Instagram: Recommend friends, pages, posts, and
advertisements based on user interactions.
• Google Ads and Facebook Ads: Display relevant ads to users based on
their online behavior and preferences.
Best Practices
• Addressing Cold Start Problem - Use content-based methods or hybrid models
to make initial recommendations for new users or items
• Scalability - Implement distributed computing frameworks like Apache Spark to
handle large-scale data efficiently.
• Personalization - Tailor recommendations to individual user preferences and
behaviors for a more engaging experience.
• Incorporating User Feedback - Continuously update the recommendation
model with user feedback to improve accuracy.
• Ethical Considerations - Ensure recommendations are fair, unbiased, and
respect user privacy. Avoid reinforcing harmful biases present in the data.
20
Dimensionality Reduction… An Introduction
Dimensionality reduction is a key technique in machine learning and data analysis
used to reduce the number of random variables under consideration, by
obtaining a set of principal variables. It's especially useful in handling high-
dimensional data, improving model performance, and visualizing data. Here are
the main concepts and techniques involved in dimensionality reduction:
Concepts of Dimensionality Reduction
• Curse of Dimensionality:
 As the number of dimensions increases, the volume of the space
increases exponentially, making data sparse and distance metrics less
meaningful.
 High-dimensional data can lead to overfitting in machine learning models.
• Feature Selection vs. Feature Extraction:
 Feature Selection: Selecting a subset of the most relevant features from
the original dataset.
 Feature Extraction: Transforming the data into a lower-dimensional space
using mathematical transformations.
21
Dimensionality Reduction… An Introduction
Techniques for Dimensionality Reduction
• Principal Component Analysis (PCA)
 Purpose: Reduces dimensionality by projecting data onto a lower-
dimensional subspace using the directions (principal components) of
maximum variance.
 Process:
1. Standardize the data.
2. Compute the covariance matrix.
3. Calculate eigenvalues and eigenvectors of the covariance matrix.
4. Select the top k eigenvectors to form a new subspace.
5. Transform the original data into this new subspace.
• Linear Discriminant Analysis (LDA)
 Purpose: Maximizes the separation between multiple classes by
projecting data onto a lower-dimensional space.
 Process: Finds the linear combinations of features that best separate
different classes.
22
Dimensionality Reduction… An Introduction
23
References …cont.
[26] Yan, J., & Chen, F. (2016, April). An improved AES key expansion algorithm. In 2016
International Conference on Electrical, Mechanical and Industrial Engineering. Atlantis Press.
[27] Kim, J. M., Lee, H. S., Yi, J., & Park, M. (2016). Power adaptive data encryption for energy-
efficient and secure communication in solar-powered wireless sensor networks. Journal of
Sensors, 2016.
[28] Li, J. (2017). A symmetric cryptography algorithm in wireless sensor network
security. International Journal of Online and Biomedical Engineering, 13(11), 102-110.
[29] Saravanan, P., & Kalpana, P. (2018). Novel reversible design of advanced encryption standard
cryptographic algorithm for wireless sensor networks. Wireless Personal Communications, 100(4),
1427-1458.
[30] Farooq, S., Prashar, D., & Jyoti, K. (2018). Hybrid encryption algorithm in wireless body area
networks (WBAN). In Intelligent Communication, Control and Devices (pp. 401-410). Springer,
Singapore.
[31] Wang, J., Xu, H., & Yao, M. (2012). Improvement of the Round Key Generation of
AES. International Journal of Communications, Network and System Sciences, 5(12), 850-853.
[32] Liu, B., & Baas, B. M. (2011). Parallel AES encryption engines for many-core processor
arrays. IEEE transactions on computers, 62(3), 536-547.
[33] Mullai, A., & Mani, K. (2020). Enhancing the security in RSA and elliptic curve cryptography
based on addition chain using simplified Swarm Optimization and Particle Swarm Optimization for
mobile devices. International Journal of Information Technology, 1-14.
Thank You

data science module-3 power point presentation

  • 1.
    Feature Generation &Feature Selection MODULE-3
  • 2.
    Contents 1. Extracting meaningfrom data : An Introduction 2. Feature Generation : Brainstorming; Role of Domain Expertise; Place of Imagination 3. Feature Selection Algorithms 4. Filters 5. Wrappers 6. Decision Trees 7. Random Forests 8. Recommendation Systems 9. Building a User-Facing Data Product 2
  • 3.
    Contents …contd 10. AlgorithmicIngredients of a Recommendation Engine 11. Dimensionality Reduction 12. Singular Value decomposition 13. Principal Component Analysis 14. Exercise: Build your own recommendation System 3
  • 4.
    Extracting meaning fromdata involves turning raw data into actionable insights or valuable knowledge. Here's a simplified breakdown of the process:  Understanding the Context:  What questions are you trying to answer?  What problem are you trying to solve? Understanding the context helps frame the analysis and guide the interpretation of results.  Data Exploration: Explore the data to gain familiarity with its structure, content, and quality  Summary statistics  visualizations (e.g., histograms, scatter plots)  identifying any anomalies or patterns 4 Extracting Meaning from Data : An Introduction
  • 5.
     Data Cleaningand Preparation: Data is rarely perfect. It may contain missing values, outliers, or errors that need to be addressed. Involves tasks such as:  Imputing missing values  Removing duplicates  Handling outliers to ensure the data is suitable for analysis  Feature Engineering: Involves creating new features or transforming existing ones to improve the performance of machine learning models or enhance insights. This may include tasks like:  scaling numerical features  encoding categorical variables  creating interaction terms 5 Extracting Meaning from Data : An Introduction
  • 6.
     Statistical Analysis:Apply statistical techniques to uncover relationships, correlations, or trends within the data. Involves tasks such as:  Hypothesis testing  Regression analysis  Time series analysis, or other statistical methods. Depends on the nature of the data and the questions being explored.  Machine Learning and Predictive Modeling: machine learning models can be trained on the data to make accurate predictions or classifications. This may include tasks like:  Model selection  Training  Evaluation  Fine-tuning 6 Extracting Meaning from Data : An Introduction
  • 7.
     Interpretation andVisualization: Once analysis is performed, interpret the results in the context of the original questions or objectives. Visualizations include:  Charts  Graphs  dashboards Can help communicate key findings and insights in a clear and compelling manner.  Validation and Iteration: Validate the findings and conclusions through robust testing, validation, or peer review. This may include iterations on the analysis based on:  Feedback  New data  Changes in the problem domain. 7 Extracting Meaning from Data : An Introduction
  • 8.
     Actionable Insights:The ultimate goal of extracting meaning from data is to generate actionable insights that drive decision-making or inform strategies. These insights should be:  Relevant  Reliable  Impactful  Helping stakeholders make informed decisions or take meaningful actions  Continuous Learning and Improvement : Data analysis is an ongoing process. Continuously seek to improve your skills, methodologies, and approaches to extracting meaning from data. Embrace feedback, stay updated on emerging techniques and technologies, and never stop learning. 8 Extracting Meaning from Data : An Introduction
  • 9.
     Actionable Insights:Once analysis is performed, interpret the results in the context of the original questions or objectives. Visualizations include:  Charts  Graphs  dashboards Can help communicate key findings and insights in a clear and compelling manner.  Validation and Iteration: Validate the findings and conclusions through robust testing, validation, or peer review. This may include iterations on the analysis based on:  Feedback  New data  Changes in the problem domain. 9 Extracting Meaning from Data : An Introduction
  • 10.
    • Feature generation,also known as feature engineering, is the process of creating new features from existing data to improve the performance of machine learning models or enhance insights derived from the data. Here are some common techniques for feature generation • Polynomial Features: This can capture nonlinear relationships between variables. • Interaction Terms: Create interaction terms by combining two or more features through multiplication or other mathematical operations. • Binning or Discretization: Group numerical features into bins or discrete categories. This can help simplify complex relationships and reduce noise in the data. • Encoding Categorical Variables: Convert categorical variables into numerical representations using techniques like  one-hot encoding  Label encoding, or target encoding This allows categorical variables to be used as features in machine learning models. 10 Feature Generation: An Introduction Figure 1b : One hot encoding Figure 1(a)
  • 11.
    • Feature Scaling: Scale numerical features to a similar range, such as normalization (scaling features to have a mean of 0 and a standard deviation of 1) or min-max scaling (scaling features to a range between 0 and 1). This can Improve the performance of various algorithms. • Datetime Features : his can capture seasonal or time- dependent patterns in the data. • Text Features: : Process and extract features from text data, such as word counts, TF-IDF (Term Frequency- Inverse Document Frequency) scores, or word embeddings. • Feature Aggregation : Aggregate multiple features to create new summary statistics, such as means, medians, standard deviations, or counts. • Domain-specific Features: Create features that are specific to the problem domain or subject matter expertise. 11 Feature Generation: An Introduction… contd. Figure 1b : One hot encoding Figure 1(a)
  • 12.
    • Domain-specific Features:Create features that are specific to the problem domain or subject matter expertise. • Dimensionality Reduction: Techniques like Principal component analysis (PCA) or feature selection to reduce the dimensionality of the feature space while preserving as much information as possible. This can help reduce computational complexity and improve model generalization. • Feature Crosses: Combine features from different sources or domains to create new composite features. Complex relationships or interactions that may not be apparent from individual features alone can be captured like this. • Derived Features: Create features derived from business rules, logical conditions, or transformations applied to existing features. This can encode specific domain knowledge or hypotheses about the data. 12 Feature Generation: An Introduction… contd. Figure 1b : One hot encoding Figure 1(a)
  • 13.
    Filter Methods • VarianceThresholding:  Features with low variance (little change across samples) are removed, assuming they carry less information. • Correlation Coefficient: • Chi-Square Test:  For categorical data, the chi-square test assesses the association between each feature and the target variable • Mutual Information:  Measures the dependency between each feature and the target variable. Higher mutual information indicates a higher relevance of the feature. 13 Feature Selection Methods: Filter methods rely on the statistical properties of the data to select features. They are usually fast and independent of the machine learning algorithm used.
  • 14.
    Wrapper Methods • ForwardSelection: :  Starts with an empty set of features and adds features one by one, selecting the one that improves model performance the most at each step. • Backward Elimination:  Starts with all features and removes them one by one, eliminating the least significant feature at each step • Recursive Feature Elimination (RFE):  Fits a model and removes the least significant features recursively until the desired number of features is reached 14 Feature Selection Methods: Wrapper methods evaluate feature subsets based on model performance. They are generally more accurate than filter methods but can be computationally expensive.
  • 15.
    Embedded Methods • LASSO(Least Absolute Shrinkage and Selection Operator):  Adds a penalty equal to the absolute value of the magnitude of coefficients, effectively shrinking some coefficients to zero, thereby selecting a simpler model. • Ridge Regression:  Adds a penalty equal to the square of the magnitude of coefficients, which can help with multicollinearity and feature selection • Elastic Net: Combines LASSO and Ridge penalties to encourage a grouping effect where correlated features are selected together. • Tree-Based Methods: Decision trees, random forests, and gradient boosting machines inherently perform feature selection by considering feature importance through metrics like Gini impurity or information gain. 15 Feature Selection Methods: Embedded methods perform feature selection during the model training process. They are specific to the machine learning algorithm used.
  • 16.
    16 Recommendation Systems: AnIntroduction • Algorithms designed to suggest relevant items to users. • Widely used in various industries, including e-commerce, streaming services, social media, and more. • There are several types of recommendation systems, each employing different methods to make recommendations. Types of Recommendation Systems:  Collaborative Filtering –  User-Based Collaborative Filtering: Finds users similar to the target user and recommends items those users have liked.  Item-Based Collaborative Filtering: Recommends items that are similar to items the target user has liked.  Content-Based Filtering - Recommends items similar to those the user has liked in the past by analyzing the attributes of the items  Hybrid Systems - Combines collaborative filtering and content-based filtering to overcome the limitations of each approach.  Knowledge-Based Systems - Uses domain knowledge about how certain item features meet user needs and preferences.
  • 17.
    17 Recommendation Systems: AnIntroduction Types of Recommendation Systems… contd:  Knowledge-Based Systems– Uses domain knowledge about how certain item features meet user needs and preferences.  Context-Aware Systems - Takes into account contextual information like time, location, and the user's current activity to make recommendations.  Deep Learning-Based Systems - Employs deep learning techniques to model complex patterns and relationships in the data. Key Techniques and Algorithms  Matrix Factorization - Techniques like Singular Value Decomposition (SVD) and Alternating Least Squares (ALS) to decompose the user-item interaction matrix into latent factors.  Nearest Neighbors - Algorithms such as k-Nearest Neighbors (k-NN) for finding similar users or items.  Classification and Regression Models - Machine learning models such as decision trees, support vector machines, and logistic regression to predict user preferences.
  • 18.
    18 Recommendation Systems: AnIntroduction Key Techniques and Algorithms  Neural Networks - Models like autoencoders, Convolutional Neural Networks (CNNs), and Recurrent Neural Networks (RNNs) for capturing complex user- item interactions.  Factorization Machines - A generalization of matrix factorization that can handle sparse data and incorporate additional context variables. Applications and Examples  E-commerce – • Amazon: Suggests products based on user browsing and purchase history.  Streaming Services – • Netflix and Spotify: Recommend movies, TV shows, and music based on user preferences and behavior.  Social Media – • Facebook and Instagram: Recommend friends, pages, posts, and advertisements based on user interactions.
  • 19.
    19 Recommendation Systems: AnIntroduction Applications and Examples  Online Advertising – • Facebook and Instagram: Recommend friends, pages, posts, and advertisements based on user interactions. • Google Ads and Facebook Ads: Display relevant ads to users based on their online behavior and preferences. Best Practices • Addressing Cold Start Problem - Use content-based methods or hybrid models to make initial recommendations for new users or items • Scalability - Implement distributed computing frameworks like Apache Spark to handle large-scale data efficiently. • Personalization - Tailor recommendations to individual user preferences and behaviors for a more engaging experience. • Incorporating User Feedback - Continuously update the recommendation model with user feedback to improve accuracy. • Ethical Considerations - Ensure recommendations are fair, unbiased, and respect user privacy. Avoid reinforcing harmful biases present in the data.
  • 20.
    20 Dimensionality Reduction… AnIntroduction Dimensionality reduction is a key technique in machine learning and data analysis used to reduce the number of random variables under consideration, by obtaining a set of principal variables. It's especially useful in handling high- dimensional data, improving model performance, and visualizing data. Here are the main concepts and techniques involved in dimensionality reduction: Concepts of Dimensionality Reduction • Curse of Dimensionality:  As the number of dimensions increases, the volume of the space increases exponentially, making data sparse and distance metrics less meaningful.  High-dimensional data can lead to overfitting in machine learning models. • Feature Selection vs. Feature Extraction:  Feature Selection: Selecting a subset of the most relevant features from the original dataset.  Feature Extraction: Transforming the data into a lower-dimensional space using mathematical transformations.
  • 21.
    21 Dimensionality Reduction… AnIntroduction Techniques for Dimensionality Reduction • Principal Component Analysis (PCA)  Purpose: Reduces dimensionality by projecting data onto a lower- dimensional subspace using the directions (principal components) of maximum variance.  Process: 1. Standardize the data. 2. Compute the covariance matrix. 3. Calculate eigenvalues and eigenvectors of the covariance matrix. 4. Select the top k eigenvectors to form a new subspace. 5. Transform the original data into this new subspace. • Linear Discriminant Analysis (LDA)  Purpose: Maximizes the separation between multiple classes by projecting data onto a lower-dimensional space.  Process: Finds the linear combinations of features that best separate different classes.
  • 22.
  • 23.
    23 References …cont. [26] Yan,J., & Chen, F. (2016, April). An improved AES key expansion algorithm. In 2016 International Conference on Electrical, Mechanical and Industrial Engineering. Atlantis Press. [27] Kim, J. M., Lee, H. S., Yi, J., & Park, M. (2016). Power adaptive data encryption for energy- efficient and secure communication in solar-powered wireless sensor networks. Journal of Sensors, 2016. [28] Li, J. (2017). A symmetric cryptography algorithm in wireless sensor network security. International Journal of Online and Biomedical Engineering, 13(11), 102-110. [29] Saravanan, P., & Kalpana, P. (2018). Novel reversible design of advanced encryption standard cryptographic algorithm for wireless sensor networks. Wireless Personal Communications, 100(4), 1427-1458. [30] Farooq, S., Prashar, D., & Jyoti, K. (2018). Hybrid encryption algorithm in wireless body area networks (WBAN). In Intelligent Communication, Control and Devices (pp. 401-410). Springer, Singapore. [31] Wang, J., Xu, H., & Yao, M. (2012). Improvement of the Round Key Generation of AES. International Journal of Communications, Network and System Sciences, 5(12), 850-853. [32] Liu, B., & Baas, B. M. (2011). Parallel AES encryption engines for many-core processor arrays. IEEE transactions on computers, 62(3), 536-547. [33] Mullai, A., & Mani, K. (2020). Enhancing the security in RSA and elliptic curve cryptography based on addition chain using simplified Swarm Optimization and Particle Swarm Optimization for mobile devices. International Journal of Information Technology, 1-14.
  • 24.