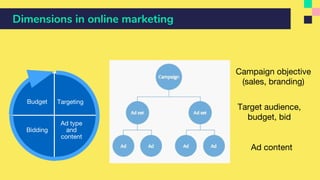
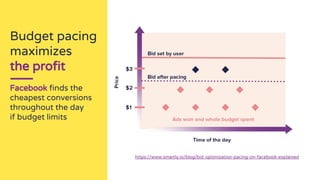
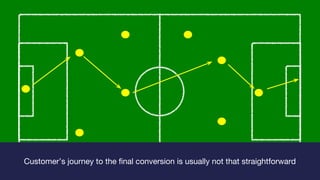
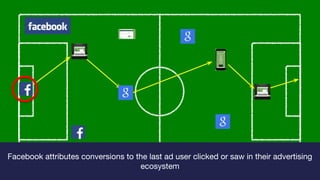
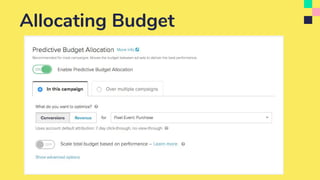
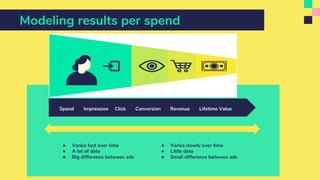
Data Science in
Online Marketing
Markus Ojala
PhD, Chief Data Scientist @ Smartly.io
Aalto University - 2017-11-30
Data Scientist (n.):
Person who is better at statistics than
any software engineer and better at
software engineering than any
statistician.
@josh_wills
My
story
2004-2008: Aalto, tech. physics
2008-2011: PhD in inf. & comp. science
2011-2015: Xtract & Comptel
2015- : Smartly.io
Randomization Algorithms for
Assessing the Significance of
Data Mining Results
1 billion spend
Managed yearly
Smartly.io
Facebook &
Instagram Partner
1. Online Marketing
2. Tracking & Attribution
3. Testing
4. Optimizing
5. Optimizing more
6. Summary
1. Online Marketing
Dimensions in online marketing
Campaign objective
(sales, branding)
Target audience,
budget, bid
Ad content
Targeting
Ad type
and
content
Bidding
Budget
Example: e-commerce with product feed
- XML, CSV, TSV, JSON
- No limits on the number of products
- Refresh up to once an hour
!
Retarget audience with dynamic creative
Look-a-like
Bid value for the
desired outcome
Estimated
action rate
Relevance &
quality
X +Bid =
Maximizes advertiser value Optimizes consumer
experience
Conversion
Optimized
Bidding
It’s simple.
You can bid directly
for your end goal.
Bid value for the
desired outcome
Estimated
action rate
Relevance &
quality
X +Bid =
Maximizes advertiser value Optimizes consumer
experience
Conversion
Optimized
Bidding
It’s simple.
You can bid directly
for your end goal.
$50 0.5%$0.25
Predicting estimated action rate per user:
● Target: 1 user converted, 0 user did not convert
● Predictors: age, gender, location, interests,
behaviour…
● Simple model: e.g., logistic regression
● Use historical data to train the model
Budget pacing
maximizes
the profit
Facebook finds the
cheapest conversions
throughout the day
if budget limits
https://www.smartly.io/blog/bid-optimization-pacing-on-facebook-explained
2. Tracking & Attribution
Customer’s journey to the final conversion is usually not that straightforward
It’s a combination of multiple touch points in many channels
Facebook attributes conversions to the last ad user clicked or saw in their advertising
ecosystem
While Google Analytics does the same within their ecosystem, using last click attribution
as default method
Attribution modelling
1) Basic attribution
• First click
• Last click
2) Advanced attribution
• U-model
• Linear
• Time decay
2) Statistical attribution
• Survival model
• Marketing mix model
3. Testing
Split audience
into two groups
Show each group
a different campaign
Measure performance
in each
138
conversions
172
conversions
Split test
$100 / day$100 / day
7 2
$100 / day$100 / day
7
14
20
31
40
53
63
71
75
80
2
15
24
30
43
56
67
77
86
97
6 108 12 14 16 18 20
B
A
$12.50 ≈ $1000 / 80$1000 / 97 ≈ $10.31
Cost per conversion
Statistical significance
Why you should care:
1. There is always random noise.
2. You do not want to make decisions
based on random noise.
Lift study
670 conversions 475 conversions
Split audience
in two
Show ads only
to one group
Measure performance
in each
Lift study
4. Optimizing
Allocating Budget
Modeling results per spend
Multi-Armed
Bandit
Bayesian Bandits / Thompson sampling
The number of pulls for a given lever should match
its actual probability of being the optimal lever
Sample from the posterior for the mean of each lever
Adset Conversions Impressions Conversion rate Budget proportion
1 848 1 417 764 0.060% 92.7%
2 723 1 349 349 0.054% 1.4%
3 60 121 784 0.049% 5.7%
4 107 270 757 0.040% 0.0%
5 22 65 200 0.034% 0.2%
6 45 154 330 0.029% 0.0%
5. Optimizing more
Moving from conversions to revenue
ROAS = revenue / cost
= revenue / conversions * conversions / cost
= revenue / conversions * 1 / CPA
ROAS = return on ad spend
CPA = cost per action
Existing model
● Lot of data
● Varies fast
● Big differences
New model
● Little data
● Varies slowly
● Small real differences
● Lot of random variation
Modeling the revenue per purchase
Revenue follows usually a long-tailed distribution, use log-normal
Multilevel
Model
Account
Campaign
Ad set
Multilevel model in Stan
Posterior predictive checks
Results 1
Common case:
ad sets don’t
really differ
Results 2
Campaigns
differ, ad sets
not
Results 3
Lot of data
Ad sets differ
6. Summary
1. Turn customer case into analytical problem
2. Data processing
3. Modelling
Data science in practice
All models are wrong,
but some are useful.
George Box
You do not really understand
something unless you can explain
it to your grandmother.
Einstein / Feynman / ...
https://www.smartly.io/blog/
● Experiences in Using R and Python in Production
● Insights to Predictive Budget Allocation
● Automated Statistical Significance Calculator for A/B Testing
● Tutorial: How We Productized Bayesian Revenue Estimation with Stan
Read more
WORK SMARTLY
We’re looking for new Humble Hungry Hunters
to build a world-class product company.
https://www.smartly.io/careers
Markus.Ojala@smartly.io

Data Science in Online Marketing