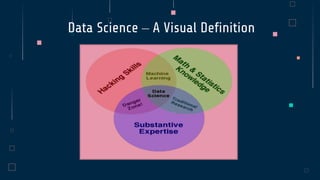
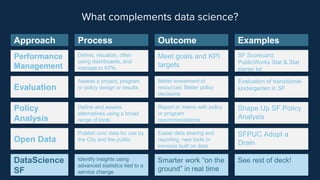
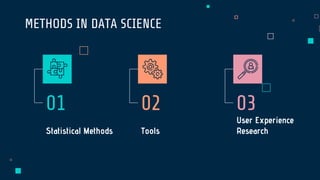
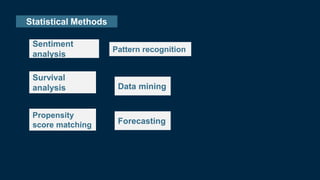
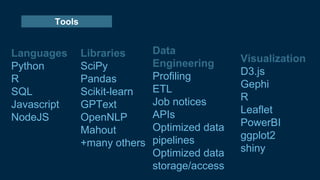
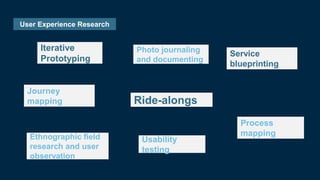
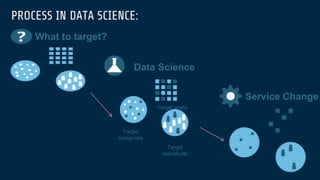
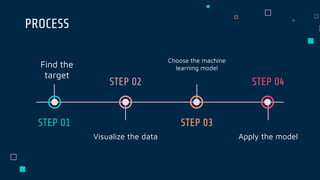
By
B.Deepak
DATA SCIENCE
Data Science is the science which uses
computer science, statistics and machine
learning, visualization and human-computer
interactions to collect, clean, integrate,
analyze, visualize, interact with data to create
data products.
Goal of Data Science: Turn data into data products.
What is Data Science?
Data Science – A Visual Definition
What complements data science?
Performance
Management
Define, visualize, often
using dashboards, and
manage to KPIs
Meet goals and KPI
targets
SF Scorecard,
PublicWorks Stat & Stat
starter kit
Process Outcome Examples
Approach
Evaluation
Assess a project, program
or policy design or results
Better investment of
resources; Better policy
decisions
Evaluation of transitional-
kindergarten in SF
Policy
Analysis
Define and assess
alternatives using a broad
range of tools
Report or memo with policy
or program
recommendations
Shape Up SF Policy
Analysis
Open Data
Publish civic data for use by
the City and the public
Easier data sharing and
reporting, new tools or
services built on data
SFPUC Adopt a
Drain
DataScience
SF
Identify insights using
advanced statistics tied to a
service change
Smarter work “on the
ground” in real time
See rest of deck!
User Experience
Research
Tools
Statistical Methods
01 02
METHODS IN DATA SCIENCE
03
Statistical Methods
Survival
analysis
Forecasting
Pattern recognition
Propensity
score matching
Data mining
Sentiment
analysis
Tools
Languages
Python
R
SQL
Javascript
NodeJS
Libraries
SciPy
Pandas
Scikit-learn
GPText
OpenNLP
Mahout
+many others
Data
Engineering
Profiling
ETL
Job notices
APIs
Optimized data
pipelines
Optimized data
storage/access
Visualization
D3.js
Gephi
R
Leaflet
PowerBI
ggplot2
shiny
User Experience Research
Iterative
Prototyping
Journey
mapping
Ethnographic field
research and user
observation
Ride-alongs
Photo journaling
and documenting
Usability
testing
Process
mapping
Service
blueprinting
PROCESS IN DATA SCIENCE:
What to target?
Data Science
Target
categories
Target
individuals
Target areas
Service Change
PROCESS
Find the
target
Apply the model
Visualize the data
Choose the machine
learning model
STEP 01
STEP 02
STEP 03
STEP 04
EXAMPLE
Find the male, female are
working as software
engineer in an area.
01
ANALYSIS
OUTREACH TOP RATED VALUES
MALE FEMALE MALE FEMALE
80% 50%
TARGET
75%
60%
Female
Male
20-39
40-60
80%
50%
500,000+
Employees
GENDER AGE
ADVANTAGES
MONEY
PEOPLE
EASY ANALYSIS
TIME
TAKES MINIMUM
TIME
COST EFFICENT
ONE PEOPLE WITH
SKILL CAN DO IT
ANALYSIS
THANK YOU

Data science