The document summarizes a thesis presentation on graph clustering and community detection algorithms. It discusses:
1. The main contributions of the thesis, which include improving existing clustering algorithms and applying the new algorithms to synthetic and real-world networks.
2. An outline of the presentation covering introduction, literature review, proposed algorithms, experimentation on graphs, and applications.
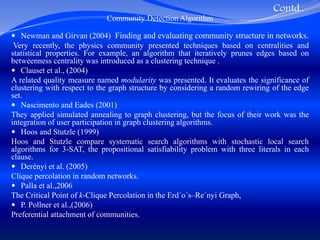
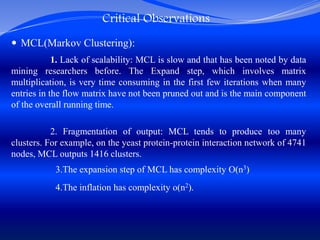
3. Critical observations on existing clustering algorithms related to scalability, accuracy, and memory requirements.
4. The objectives of investigating improved clustering techniques to address issues in existing methods and apply the new algorithms to complex networks.


![Move Types
Global Move: -The concept of the global move is to improve the clustering results and
reducing the cost of clustering. It acts like a random move with near-optimal cost of
clustering i.e. the maximum decrease in current clustering’s cost resulting from an
available move. The change on the cost of clustering results in a move lies in [1-|V|,
|V|-1] for cost functions (Naive, Scaled).
Diversification (Random) Move: - In order to avoid getting stuck into the higher local
minima; some random moves are made during clustering to get rid of it and hopefully;
it can resolve the issue and get a lower minimum.
One important direction on that move type is shuffling diversification that
provides some better conception of clustering. In that situation, during each move,
every random vertex is placed to random cluster where both the vertex and the
cluster are selected from a uniform distribution.
Intensification Move: - The concept of selecting few moves from a restricted
neighbourhood (a recommended subset of the current clustering's neighbourhood in
the search space) to reduce the search for a good move by only allowing moves within
a certain subset of those possible moves, is called intensification.](https://image.slidesharecdn.com/datamining-220727051801-17f2fa0f/85/Data-mining-pptx-31-320.jpg)