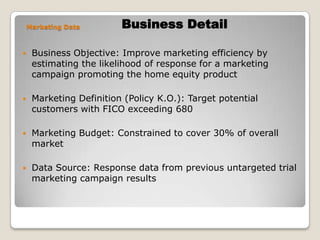
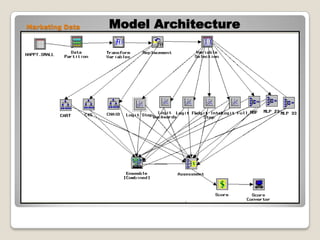
1) The document describes using data mining techniques to build predictive models to improve the marketing efficiency of a home equity product by estimating customer response likelihoods.
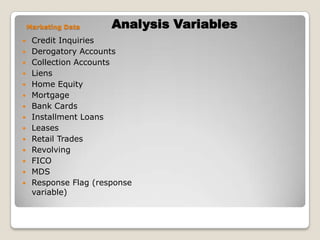
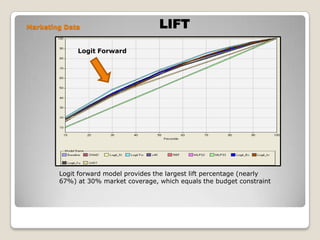
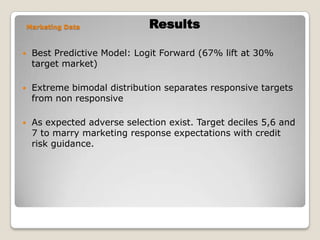
2) It analyzes previous marketing campaign response data and customer credit variables to build Logit, Decision Tree, and Neural Network models, with the Logit forward model achieving the highest 67% lift at the 30% budget level.
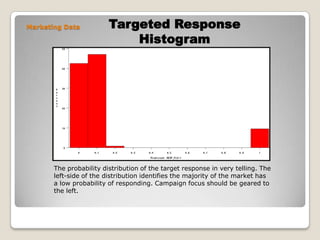
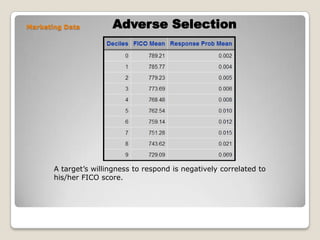
3) The results show an extreme bimodal distribution separating responsive from non-responsive customers, and adverse selection with less responsive customers having lower FICO scores. Targeting deciles 5-7 balances response and credit risk.


![5G Explained! A High Level Overview [Introduction]](https://cdn.slidesharecdn.com/ss_thumbnails/5gexplainedahighleveloverview-260119165306-cc137a3e-thumbnail.jpg?width=640&height=640&fit=bounds)


