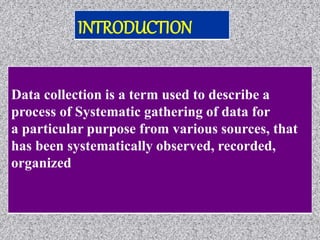
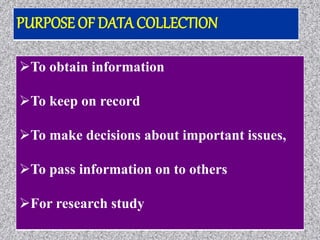
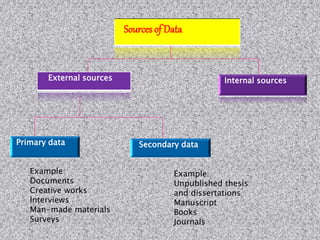
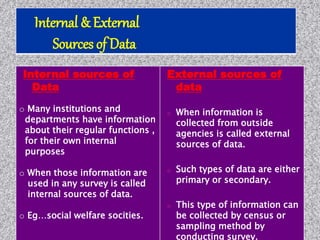
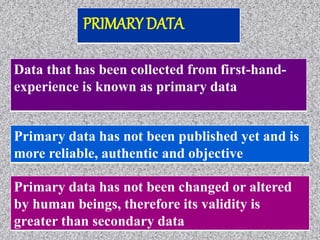
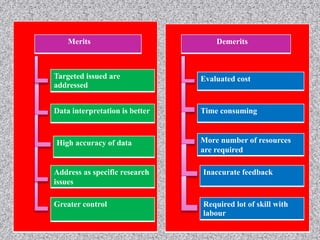
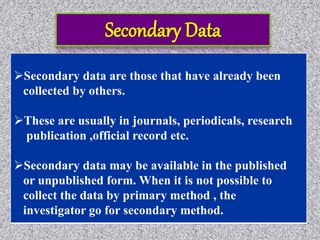
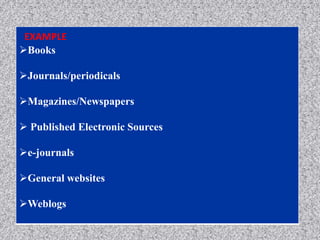
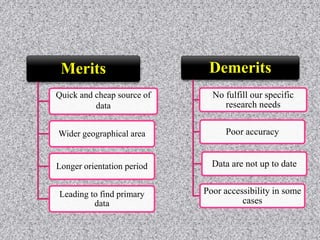
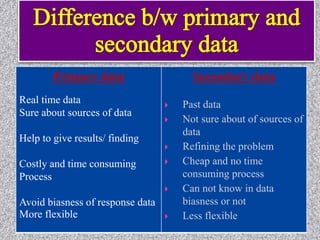
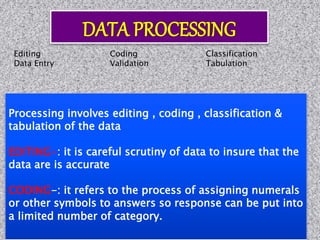
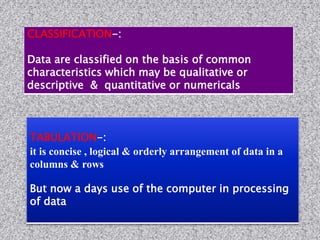
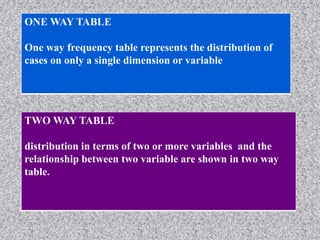
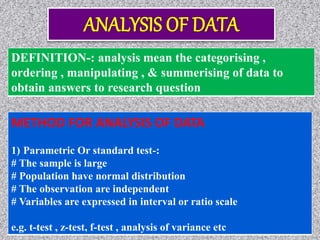
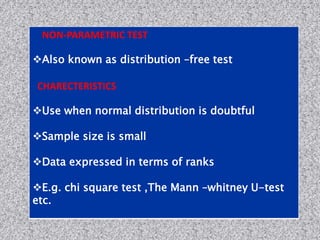
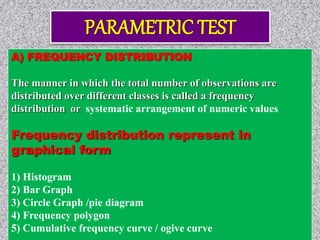
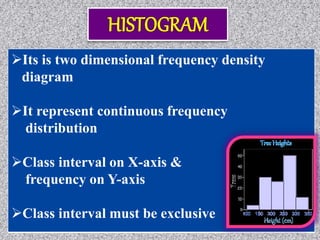
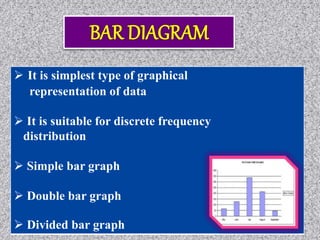
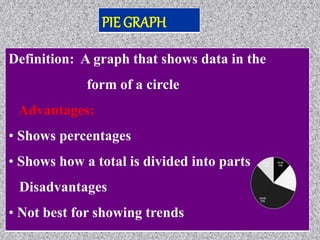
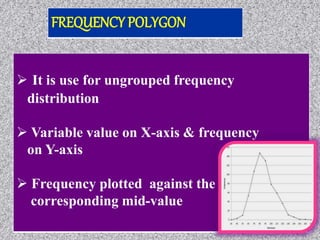
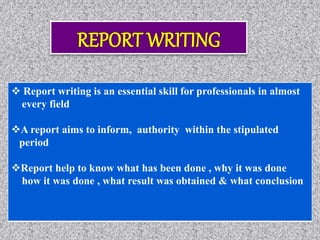
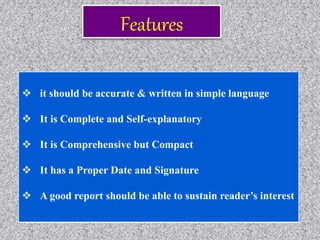
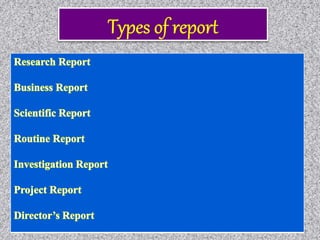
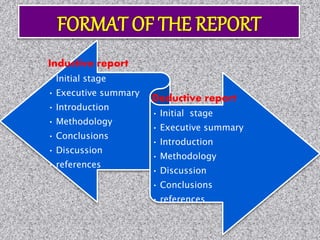
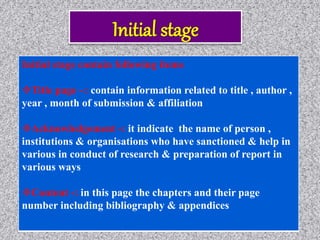
SlideShare a Scribd company logo
Dr. Md. Atiar Rahman
Associate Professor
Department of Biochemistry and Molecular
Biology
University of Chittagong
Chittagong 4331
Data collection is a term used to describe a
process of Systematic gathering of data for
a particular purpose from various sources, that
has been systematically observed, recorded,
organized
INTRODUCTION
To obtain information
To keep on record
To make decisions about important issues,
To pass information on to others
For research study
PURPOSE OF DATA COLLECTION
 Steps in Data Analysis
 Data Collection & Preparation
 Exploration of Data
 Data Analysis Method (s)/ Techniques
 Information
 Data
120557
Date
12/05/57
Time
12:05:57 Money
120,557
Data VS Information
Nature , scope & Objective of the enquiry
Sources of information
Availability of fund
Techniques of data collection
Availability of trained persons
Factors to be Considered
Before Collection of Data
Qualitative
Deals with descriptions.
Data can be observed
Data can not measured
e.g. –Colour of body coat,
feather colour in poultry
etc
Quantitative
Deals with numbers.
Data which can be
measured.
e.g. –height ,weight ,
length of the animals
TYPE OF DATA
Sources of Data
External sources Internal sources
Primary data Secondary data
Example:
Documents
Creative works
Interviews
Man-made materials
Surveys
Example:
Unpublished thesis
and dissertations
Manuscript
Books
Journals
Internal sources of
Data
o Many institutions and
departments have information
about their regular functions ,
for their own internal
purposes
o When those information are
used in any survey is called
internal sources of data.
o Eg…social welfare socities.
External sources of
data
o When information is
collected from outside
agencies is called external
sources of data.
o Such types of data are either
primary or secondary.
o This type of information can
be collected by census or
sampling method by
conducting survey.
Internal & External
Sources of Data
Data that has been collected from first-hand-
experience is known as primary data
Primary data has not been changed or altered
by human beings, therefore its validity is
greater than secondary data
Primary data has not been published yet and is
more reliable, authentic and objective
PRIMARY DATA
Demerits
Evaluated cost
Time consuming
More number of resources
are required
Inaccurate feedback
Required lot of skill with
labour
Targeted issued are
addressed
Data interpretation is better
Merits
High accuracy of data
Greater control
Address as specific research
issues
Factor effect method of
Data collection
2.Type of research subject
3)Purpose of research study
4)Size of study sample
5)Distribution of target population
6)Time frame of the study
7)Literacy level of subjects
Observation-: is a methodical way of recognising
& noting a fact of occurrence
TYPE OF OBSERVATION
 STRUCTURED
 UNSTRUCTURED
 PARTICIPATIVE
 NON –PARTICIPATIVE
 CONTROLLED
 UNCONTROLLED
Merits
Subject bias eliminated
Information related to
current state of affairs
Independent to
respondent
Demerits
Time consuming
Expensive
Limited amount of
information available
Extraneous factors
may interfere
Presenting stimuli to the respondents in the form of question
& note down their oral –verbal response
TYPE OF INTERVIEW
 Standardized interviews
a. Structured
b. Unstructured
 Non-standardized interviews
a. One to one
1.Face to face,
2.telephonic,
3.internet mediated interviews
b. One to many(focus group)
Merits
More accurate responses
Get response from all persons
Overcome resistance of
respondents
Response to difficult question
may obtained
Demerits
Not suitable for More
respondents
Wider geographical area
More time & cost
Selection , training &
supervision of field staff
Questionnaire method
 Questionnaire- A questionnaire is a research
instrument consisting of a series of question and other prompts
for the purpose of gathering information from respondent.
 Self administered questionnaire
 Interviewer -administered
questionnaire
 Telephone questionnaire
 Delivery and questionnaire
 Postal or mail questionnaire
 Techniques of data collection in which each person
is asked to respond to the same set of questions in
a predetermined order.
 Questionnaire is sent to persons with request to
answer the question and return the questionnaire.
 Questionnaire can be sent through-
1. postal, 2. over internet (e-mail, forum), 3. manual delivery
and collection
Types of questionnaire
Figure 11.1 Types of questionnaire
Stages that must occur if a question is to be
valid and reliable
Figure 11.2 Stages that must occur if a question is to be valid and reliable
Main considerations
 Order and flow of questions
 Questionnaire layout
Key factors
• Precisely defined questions
• Representative and accurate sampling
• Relationships between variables – dependent, independent and
extraneous
• Types of variable
 A schedule is a structure of set of questions on a
given topic which are asked by the interviewer or
investigator personally.
 Like questionnaire but filled by enumerators who
are especially appointed for filling questionnaire.
 Enumerator explain the aims and objectives to
respondents and fill up the answer in provided
space.
 It contains direct questions as well as questions
in tabular form.
Following are the different types of schedules
used by social scientists and
anthropologists.
 Village or community schedule: It is used by
census researchers who collect general
information on populations, occupations, etc.
 Family or Household schedule: It gives full
demographic details of households, the status
of individuals, data on education, age, family
relations etc.
 Opinion or attitude schedule: To schedule the
views of population regarding an issue.
 Schedule is generally
filled by enumerator or
research worker
 Costly, requires field
workers
 Non response is low
 In schedule Identity of
person is known.
 Information is collected
well in time.
 Direct personal contact
 Questionnaires generally
sent through mail and no
further assistance from
sender.
 Questionnaire is cheaper
method.
 Non response is high.
 In questionnaire Identity of
respondent is unknown.
 Very slow method.
 No personal contact.
 Information can be
collected from illiterate
also.
 Sample area should not
be wider.
 Relatively more complete
and correct information.
 Depends on honesty and
competency of
enumerator.
 No necessary in schedule
method.
 Q can be used only when
respondent is educated
and cooperative.
 Wider distribution of
sample is possible.
 Incomplete and wrong
information is more.
 Depends on quality of
questionnaire.
 Physical appearance of
questionnaire should be
attractive.
Merits
Suitable for large
population
Suitable for large geographical
area
Less time & cost
Appropriate for sensitive &
personal type enquiry
Demerits
Difficulty in replying to
the question
Some question may remain
unanswered
Low rate of return of
questionnaire
Replies may be given by any
one other
 SURVEY- A detailed study of geographical area to
gather data attitudes, impressions, opinions, satisfaction
level etc., by polling a section of the population
 TYPE
1.CENSUS SURVEY
2.CONTINOUS OR REGULAR
SURVEY
3.AD-HOC SURVEY
Merits
Covered large population
Less expensive
Information is accurate
Demerits
On small scale survey
avoided
Time consuming
Information does not penetrate
deeply
Researcher must have good
knowledge
 It is the method of comprehensive study of social unit
which may be a person , a family , an institution , an
organisation or a community .
Merits
Direct behavioral study
Real & personal
experience record
Make possible the study of
social change
Increase analysis ability &
skills
Demerits
One case almost different
from another case
Personal bias
Use only in limit sphere
More time & money
consuming
Secondary data are those that have already been
collected by others.
These are usually in journals, periodicals, research
publication ,official record etc.
Secondary data may be available in the published
or unpublished form. When it is not possible to
collect the data by primary method , the
investigator go for secondary method.
EXAMPLE
Books
Journals/periodicals
Magazines/Newspapers
 Published Electronic Sources
e-journals
General websites
Weblogs
Merits
Quick and cheap source of
data
Wider geographical area
Longer orientation period
Leading to find primary
data
Demerits
No fulfill our specific
research needs
Poor accuracy
Data are not up to date
Poor accessibility in some
cases
Primary data
Real time data
Sure about sources of data
Help to give results/ finding
Costly and time consuming
Process
Avoid biasness of response data
More flexible
Secondary data
 Past data
 Not sure about of sources of
data
 Refining the problem
 Cheap and no time
consuming process
 Can not know in data
biasness or not
 Less flexible
Processing involves editing , coding , classification &
tabulation of the data
EDITING-: it is careful scrutiny of data to insure that the
data are is accurate
CODING-: it refers to the process of assigning numerals
or other symbols to answers so response can be put into
a limited number of category.
Editing Coding Classification
Data Entry Validation Tabulation
TABULATION-:
it is concise , logical & orderly arrangement of data in a
columns & rows
But now a days use of the computer in processing
of data
CLASSIFICATION-:
Data are classified on the basis of common
characteristics which may be qualitative or
descriptive & quantitative or numericals
ONE WAY TABLE
One way frequency table represents the distribution of
cases on only a single dimension or variable
TWO WAY TABLE
distribution in terms of two or more variables and the
relationship between two variable are shown in two way
table.
DEFINITION-: analysis mean the categorising ,
ordering , manipulating , & summerising of data to
obtain answers to research question
METHOD FOR ANALYSIS OF DATA
1) Parametric Or standard test-:
# The sample is large
# Population have normal distribution
# The observation are independent
# Variables are expressed in interval or ratio scale
e.g. t-test , z-test, f-test , analysis of variance etc
NON-PARAMETRIC TEST
Also known as distribution –free test
CHARECTERISTICS
Use when normal distribution is doubtful
Sample size is small
Data expressed in terms of ranks
E.g. chi square test ,The Mann –whitney U-test
etc.
A) FREQUENCY DISTRIBUTION
The manner in which the total number of observations are
distributed over different classes is called a frequency
distribution or systematic arrangement of numeric values
Frequency distribution represent in
graphical form
1) Histogram
2) Bar Graph
3) Circle Graph /pie diagram
4) Frequency polygon
5) Cumulative frequency curve / ogive curve
Its is two dimensional frequency density
diagram
It represent continuous frequency
distribution
Class interval on X-axis &
frequency on Y-axis
Class interval must be exclusive
 It is simplest type of graphical
representation of data
 It is suitable for discrete frequency
distribution
 Simple bar graph
 Double bar graph
 Divided bar graph
PIE GRAPH
Definition: A graph that shows data in the
form of a circle
Advantages:
• Shows percentages
• Shows how a total is divided into parts
Disadvantages
• Not best for showing trends
FREQUENCY POLYGON
 It is use for ungrouped frequency
distribution
 Variable value on X-axis & frequency
on Y-axis
 Frequency plotted against the
corresponding mid-value
CUMULATIVE FREQUENCY CURVE
 Cumulative frequency curve is also
called ogive
 It use when class interval are very small
 Y-value are obtained by adding
successive frequency
(cumulative frequency )
B) MEASURE OF CENTRAL
VALUE/TENDENCY/LOCATION
Five basic measures of central tendency
Arithmetic mean
Median
Mode
Geometrical mean
Harmonic mean
Mean
The sum of the value of individual in the data
divided by the number of individual in the
data.
FORMULA
Here,
∑, represents the summation
X, represents scores
N, represents number of scores
Median:
Is the value which is located in the middle of a series
when the observation are arranged in order of
magnitude
If the total number of numbers(n) is an odd
number, then the formula is
If the total number of the numbers(n) is an even
number, then the formula is
Mode
Mode:
The number that occurs most frequently in a
set of numbers
C) MEASURE OF DISPERSON
 It indicate the extend of scattering or
variability of item about a central value
RANGE
MEAN DEVIATION
STANDARD DEVIATION
QUARTILE DEVIATION
COEFFICIENT OF VARIATION
Range is difference between the smallest & largest of
observation
Range = largest value – smallest value
 it is defined as the square root of the arithmetic mean of the
squares of deviations of the observation from the arithmetic
mean
 Most commonly used measure of dispersion
Mean of absolute deviation of all value of data from average (
mean , mode , median )
μ is the mean
x is each value
N is the number of values
Mean Deviation =
Σ|x - μ|
N
Quartile Deviation:
 It is based on the lower quartile Q1 and the upper quartile Q3.
 The difference Q3−Q1 is called the inter quartile range.
The difference Q3−Q1 divided by 2 is called semi-inter-quartile
range or the quartile deviation.
Thus
Q.D=Q3−Q1
2
Q1=Value of (n/4 )
The coefficient of variation (CV) is defined as the ratio
of the standard deviation to the mean
Cv = Standard Deviation / Mean
Cv = σ /μ
t-Test
t-Test is used for comparing the means of two
independent group
Paired t-test
If there is any kind of correspondence between the
individual values in the two samples
The should be paired & differences taken and analysed
directly as
 Report writing is an essential skill for professionals in almost
every field
A report aims to inform, authority within the stipulated
period
Report help to know what has been done , why it was done
how it was done , what result was obtained & what conclusion
 it should be accurate & written in simple language
 It is Complete and Self-explanatory
 It is Comprehensive but Compact
 It has a Proper Date and Signature
 A good report should be able to sustain reader’s interest
Features
Types of report
Inductive report
• Initial stage
• Executive summary
• Introduction
• Methodology
• Conclusions
• Discussion
• references
Deductive report
• Initial stage
• Executive summary
• Introduction
• Methodology
• Discussion
• Conclusions
• references
Initial stage contain following items
Title page –: contain information related to title , author ,
year , month of submission & affiliation
Acknowledgement -: it indicate the name of person ,
institutions & organisations who have sanctioned & help in
various in conduct of research & preparation of report in
various ways
Content -: in this page the chapters and their page
number including bibliography & appendices
It contains all essential information in nutshell
Introduce the topic to readers in a comprehensive way
a) A clear & definite statement of problem
b) A brief review of literature
c) The concept of important term are explained
 Selection of study area , sample and sample procedure
method of data collection & their measurement
statistical tools
 Summary what you did and why
 Use the past tense
Findings or results
 describes what you discovered, observed, etc, in your
observations and experiments
 Use the past tense.
Discussion
 Discusses and explains your findings and relates them
to previous research
 Use the present tense to make generalisations
 Reports in written form are useful for future reference
 Reports provide adequate and correct information as well
as statistical data to management and helps in decision
making
 A report provides information of unknown facts
i.e. new ideas new vision new solution to problem new
research about a particular matter.
 Research method in social science & extension
education – G.L. RAY & SAGAR MANDAL
 Foundation of Behavioural research
KERLINGER , F.N.
 Class note of biostatistics
 Practical manual on biostatistics
 INTERNET
Data collection.pptx

More Related Content

Similar to Data collection.pptx

Data Collection Techniques.ppt
Data Collection Techniques.pptData Collection Techniques.ppt
Data Collection Techniques.ppt
PapuKumarNaik1
 
Collection of Data ...pdf
Collection of Data ...pdfCollection of Data ...pdf
Collection of Data ...pdf
Aradhyamundra
 
TOOLS AND METHODS OF DATA COLLECTION (Nursing Research & Statistics)
TOOLS AND METHODS OF DATA COLLECTION(Nursing Research & Statistics)TOOLS AND METHODS OF DATA COLLECTION(Nursing Research & Statistics)
TOOLS AND METHODS OF DATA COLLECTION (Nursing Research & Statistics)
virengeeta
 
TOOLS AND METHODS OF DATA COLLECTION (Nursing Research & Statistics)
TOOLS AND METHODS OF DATA COLLECTION(Nursing Research & Statistics)TOOLS AND METHODS OF DATA COLLECTION(Nursing Research & Statistics)
TOOLS AND METHODS OF DATA COLLECTION (Nursing Research & Statistics)
virengeeta
 

Similar to Data collection.pptx (20)

Review of Evaluation Methods
Review of Evaluation MethodsReview of Evaluation Methods
Review of Evaluation Methods
 
Data Collection Techniques.ppt
Data Collection Techniques.pptData Collection Techniques.ppt
Data Collection Techniques.ppt
 
Data collection
Data collectionData collection
Data collection
 
data collection methods
data collection methodsdata collection methods
data collection methods
 
ppt mgt.pptx
ppt mgt.pptxppt mgt.pptx
ppt mgt.pptx
 
BUSINESS RESEARCH METHODS-DATA COLLECTION METHODS
BUSINESS RESEARCH METHODS-DATA COLLECTION METHODSBUSINESS RESEARCH METHODS-DATA COLLECTION METHODS
BUSINESS RESEARCH METHODS-DATA COLLECTION METHODS
 
Collection of Data ...pdf
Collection of Data ...pdfCollection of Data ...pdf
Collection of Data ...pdf
 
Data Collection Process
Data Collection ProcessData Collection Process
Data Collection Process
 
1.2 data collection
1.2 data collection1.2 data collection
1.2 data collection
 
Data Collection tools: Questionnaire vs Schedule
Data Collection tools: Questionnaire vs ScheduleData Collection tools: Questionnaire vs Schedule
Data Collection tools: Questionnaire vs Schedule
 
DATA COLLECTION METHODS PRESENTATION ( EMMANUEL SIAW OKAI).pdf
DATA COLLECTION METHODS  PRESENTATION ( EMMANUEL SIAW OKAI).pdfDATA COLLECTION METHODS  PRESENTATION ( EMMANUEL SIAW OKAI).pdf
DATA COLLECTION METHODS PRESENTATION ( EMMANUEL SIAW OKAI).pdf
 
Data collection
Data collectionData collection
Data collection
 
Survey Resaerch
Survey ResaerchSurvey Resaerch
Survey Resaerch
 
Data collection methods
Data collection methodsData collection methods
Data collection methods
 
Different Methods of Collection of Data
Different Methods of Collection of DataDifferent Methods of Collection of Data
Different Methods of Collection of Data
 
data collection
data collection data collection
data collection
 
Collection of Data
Collection of DataCollection of Data
Collection of Data
 
TOOLS AND METHODS OF DATA COLLECTION (Nursing Research & Statistics)
TOOLS AND METHODS OF DATA COLLECTION(Nursing Research & Statistics)TOOLS AND METHODS OF DATA COLLECTION(Nursing Research & Statistics)
TOOLS AND METHODS OF DATA COLLECTION (Nursing Research & Statistics)
 
TOOLS AND METHODS OF DATA COLLECTION (Nursing Research & Statistics)
TOOLS AND METHODS OF DATA COLLECTION(Nursing Research & Statistics)TOOLS AND METHODS OF DATA COLLECTION(Nursing Research & Statistics)
TOOLS AND METHODS OF DATA COLLECTION (Nursing Research & Statistics)
 
Methods of Data Collection.pptx
Methods of Data Collection.pptxMethods of Data Collection.pptx
Methods of Data Collection.pptx
 

Recently uploaded

(May 29th, 2024) Advancements in Intravital Microscopy- Insights for Preclini...
(May 29th, 2024) Advancements in Intravital Microscopy- Insights for Preclini...(May 29th, 2024) Advancements in Intravital Microscopy- Insights for Preclini...
(May 29th, 2024) Advancements in Intravital Microscopy- Insights for Preclini...
Scintica Instrumentation
 
extra-chromosomal-inheritance[1].pptx.pdfpdf
extra-chromosomal-inheritance[1].pptx.pdfpdfextra-chromosomal-inheritance[1].pptx.pdfpdf
extra-chromosomal-inheritance[1].pptx.pdfpdf
DiyaBiswas10
 
Circulatory system_ Laplace law. Ohms law.reynaults law,baro-chemo-receptors-...
Circulatory system_ Laplace law. Ohms law.reynaults law,baro-chemo-receptors-...Circulatory system_ Laplace law. Ohms law.reynaults law,baro-chemo-receptors-...
Circulatory system_ Laplace law. Ohms law.reynaults law,baro-chemo-receptors-...
muralinath2
 
THYROID-PARATHYROID medical surgical nursing
THYROID-PARATHYROID medical surgical nursingTHYROID-PARATHYROID medical surgical nursing
THYROID-PARATHYROID medical surgical nursing
Jocelyn Atis
 
Anemia_ different types_causes_ conditions
Anemia_ different types_causes_ conditionsAnemia_ different types_causes_ conditions
Anemia_ different types_causes_ conditions
muralinath2
 
FAIR & AI Ready KGs for Explainable Predictions
FAIR & AI Ready KGs for Explainable PredictionsFAIR & AI Ready KGs for Explainable Predictions
FAIR & AI Ready KGs for Explainable Predictions
Michel Dumontier
 
Earliest Galaxies in the JADES Origins Field: Luminosity Function and Cosmic ...
Earliest Galaxies in the JADES Origins Field: Luminosity Function and Cosmic ...Earliest Galaxies in the JADES Origins Field: Luminosity Function and Cosmic ...
Earliest Galaxies in the JADES Origins Field: Luminosity Function and Cosmic ...
Sérgio Sacani
 

Recently uploaded (20)

Richard's aventures in two entangled wonderlands
Richard's aventures in two entangled wonderlandsRichard's aventures in two entangled wonderlands
Richard's aventures in two entangled wonderlands
 
(May 29th, 2024) Advancements in Intravital Microscopy- Insights for Preclini...
(May 29th, 2024) Advancements in Intravital Microscopy- Insights for Preclini...(May 29th, 2024) Advancements in Intravital Microscopy- Insights for Preclini...
(May 29th, 2024) Advancements in Intravital Microscopy- Insights for Preclini...
 
extra-chromosomal-inheritance[1].pptx.pdfpdf
extra-chromosomal-inheritance[1].pptx.pdfpdfextra-chromosomal-inheritance[1].pptx.pdfpdf
extra-chromosomal-inheritance[1].pptx.pdfpdf
 
FAIRSpectra - Towards a common data file format for SIMS images
FAIRSpectra - Towards a common data file format for SIMS imagesFAIRSpectra - Towards a common data file format for SIMS images
FAIRSpectra - Towards a common data file format for SIMS images
 
insect taxonomy importance systematics and classification
insect taxonomy importance systematics and classificationinsect taxonomy importance systematics and classification
insect taxonomy importance systematics and classification
 
SAMPLING.pptx for analystical chemistry sample techniques
SAMPLING.pptx for analystical chemistry sample techniquesSAMPLING.pptx for analystical chemistry sample techniques
SAMPLING.pptx for analystical chemistry sample techniques
 
Citrus Greening Disease and its Management
Citrus Greening Disease and its ManagementCitrus Greening Disease and its Management
Citrus Greening Disease and its Management
 
GLOBAL AND LOCAL SCENARIO OF FOOD AND NUTRITION.pptx
GLOBAL AND LOCAL SCENARIO OF FOOD AND NUTRITION.pptxGLOBAL AND LOCAL SCENARIO OF FOOD AND NUTRITION.pptx
GLOBAL AND LOCAL SCENARIO OF FOOD AND NUTRITION.pptx
 
Circulatory system_ Laplace law. Ohms law.reynaults law,baro-chemo-receptors-...
Circulatory system_ Laplace law. Ohms law.reynaults law,baro-chemo-receptors-...Circulatory system_ Laplace law. Ohms law.reynaults law,baro-chemo-receptors-...
Circulatory system_ Laplace law. Ohms law.reynaults law,baro-chemo-receptors-...
 
THE IMPORTANCE OF MARTIAN ATMOSPHERE SAMPLE RETURN.
THE IMPORTANCE OF MARTIAN ATMOSPHERE SAMPLE RETURN.THE IMPORTANCE OF MARTIAN ATMOSPHERE SAMPLE RETURN.
THE IMPORTANCE OF MARTIAN ATMOSPHERE SAMPLE RETURN.
 
THYROID-PARATHYROID medical surgical nursing
THYROID-PARATHYROID medical surgical nursingTHYROID-PARATHYROID medical surgical nursing
THYROID-PARATHYROID medical surgical nursing
 
Lab report on liquid viscosity of glycerin
Lab report on liquid viscosity of glycerinLab report on liquid viscosity of glycerin
Lab report on liquid viscosity of glycerin
 
Anemia_ different types_causes_ conditions
Anemia_ different types_causes_ conditionsAnemia_ different types_causes_ conditions
Anemia_ different types_causes_ conditions
 
FAIR & AI Ready KGs for Explainable Predictions
FAIR & AI Ready KGs for Explainable PredictionsFAIR & AI Ready KGs for Explainable Predictions
FAIR & AI Ready KGs for Explainable Predictions
 
Richard's entangled aventures in wonderland
Richard's entangled aventures in wonderlandRichard's entangled aventures in wonderland
Richard's entangled aventures in wonderland
 
INSIGHT Partner Profile: Tampere University
INSIGHT Partner Profile: Tampere UniversityINSIGHT Partner Profile: Tampere University
INSIGHT Partner Profile: Tampere University
 
Earliest Galaxies in the JADES Origins Field: Luminosity Function and Cosmic ...
Earliest Galaxies in the JADES Origins Field: Luminosity Function and Cosmic ...Earliest Galaxies in the JADES Origins Field: Luminosity Function and Cosmic ...
Earliest Galaxies in the JADES Origins Field: Luminosity Function and Cosmic ...
 
Predicting property prices with machine learning algorithms.pdf
Predicting property prices with machine learning algorithms.pdfPredicting property prices with machine learning algorithms.pdf
Predicting property prices with machine learning algorithms.pdf
 
Astronomy Update- Curiosity’s exploration of Mars _ Local Briefs _ leadertele...
Astronomy Update- Curiosity’s exploration of Mars _ Local Briefs _ leadertele...Astronomy Update- Curiosity’s exploration of Mars _ Local Briefs _ leadertele...
Astronomy Update- Curiosity’s exploration of Mars _ Local Briefs _ leadertele...
 
Hemoglobin metabolism_pathophysiology.pptx
Hemoglobin metabolism_pathophysiology.pptxHemoglobin metabolism_pathophysiology.pptx
Hemoglobin metabolism_pathophysiology.pptx
 

Data collection.pptx

  • 1. Dr. Md. Atiar Rahman Associate Professor Department of Biochemistry and Molecular Biology University of Chittagong Chittagong 4331
  • 2. Data collection is a term used to describe a process of Systematic gathering of data for a particular purpose from various sources, that has been systematically observed, recorded, organized INTRODUCTION
  • 3. To obtain information To keep on record To make decisions about important issues, To pass information on to others For research study PURPOSE OF DATA COLLECTION
  • 4.  Steps in Data Analysis  Data Collection & Preparation  Exploration of Data  Data Analysis Method (s)/ Techniques
  • 6. Nature , scope & Objective of the enquiry Sources of information Availability of fund Techniques of data collection Availability of trained persons Factors to be Considered Before Collection of Data
  • 7. Qualitative Deals with descriptions. Data can be observed Data can not measured e.g. –Colour of body coat, feather colour in poultry etc Quantitative Deals with numbers. Data which can be measured. e.g. –height ,weight , length of the animals TYPE OF DATA
  • 8. Sources of Data External sources Internal sources Primary data Secondary data Example: Documents Creative works Interviews Man-made materials Surveys Example: Unpublished thesis and dissertations Manuscript Books Journals
  • 9. Internal sources of Data o Many institutions and departments have information about their regular functions , for their own internal purposes o When those information are used in any survey is called internal sources of data. o Eg…social welfare socities. External sources of data o When information is collected from outside agencies is called external sources of data. o Such types of data are either primary or secondary. o This type of information can be collected by census or sampling method by conducting survey. Internal & External Sources of Data
  • 10. Data that has been collected from first-hand- experience is known as primary data Primary data has not been changed or altered by human beings, therefore its validity is greater than secondary data Primary data has not been published yet and is more reliable, authentic and objective PRIMARY DATA
  • 11. Demerits Evaluated cost Time consuming More number of resources are required Inaccurate feedback Required lot of skill with labour Targeted issued are addressed Data interpretation is better Merits High accuracy of data Greater control Address as specific research issues
  • 12. Factor effect method of Data collection 2.Type of research subject 3)Purpose of research study 4)Size of study sample 5)Distribution of target population 6)Time frame of the study 7)Literacy level of subjects
  • 13.
  • 14. Observation-: is a methodical way of recognising & noting a fact of occurrence TYPE OF OBSERVATION  STRUCTURED  UNSTRUCTURED  PARTICIPATIVE  NON –PARTICIPATIVE  CONTROLLED  UNCONTROLLED
  • 15. Merits Subject bias eliminated Information related to current state of affairs Independent to respondent Demerits Time consuming Expensive Limited amount of information available Extraneous factors may interfere
  • 16. Presenting stimuli to the respondents in the form of question & note down their oral –verbal response TYPE OF INTERVIEW  Standardized interviews a. Structured b. Unstructured  Non-standardized interviews a. One to one 1.Face to face, 2.telephonic, 3.internet mediated interviews b. One to many(focus group)
  • 17. Merits More accurate responses Get response from all persons Overcome resistance of respondents Response to difficult question may obtained Demerits Not suitable for More respondents Wider geographical area More time & cost Selection , training & supervision of field staff
  • 18. Questionnaire method  Questionnaire- A questionnaire is a research instrument consisting of a series of question and other prompts for the purpose of gathering information from respondent.  Self administered questionnaire  Interviewer -administered questionnaire  Telephone questionnaire  Delivery and questionnaire  Postal or mail questionnaire
  • 19.  Techniques of data collection in which each person is asked to respond to the same set of questions in a predetermined order.  Questionnaire is sent to persons with request to answer the question and return the questionnaire.  Questionnaire can be sent through- 1. postal, 2. over internet (e-mail, forum), 3. manual delivery and collection
  • 20. Types of questionnaire Figure 11.1 Types of questionnaire
  • 21. Stages that must occur if a question is to be valid and reliable Figure 11.2 Stages that must occur if a question is to be valid and reliable
  • 22. Main considerations  Order and flow of questions  Questionnaire layout Key factors • Precisely defined questions • Representative and accurate sampling • Relationships between variables – dependent, independent and extraneous • Types of variable
  • 23.  A schedule is a structure of set of questions on a given topic which are asked by the interviewer or investigator personally.  Like questionnaire but filled by enumerators who are especially appointed for filling questionnaire.  Enumerator explain the aims and objectives to respondents and fill up the answer in provided space.  It contains direct questions as well as questions in tabular form.
  • 24. Following are the different types of schedules used by social scientists and anthropologists.  Village or community schedule: It is used by census researchers who collect general information on populations, occupations, etc.  Family or Household schedule: It gives full demographic details of households, the status of individuals, data on education, age, family relations etc.  Opinion or attitude schedule: To schedule the views of population regarding an issue.
  • 25.  Schedule is generally filled by enumerator or research worker  Costly, requires field workers  Non response is low  In schedule Identity of person is known.  Information is collected well in time.  Direct personal contact  Questionnaires generally sent through mail and no further assistance from sender.  Questionnaire is cheaper method.  Non response is high.  In questionnaire Identity of respondent is unknown.  Very slow method.  No personal contact.
  • 26.  Information can be collected from illiterate also.  Sample area should not be wider.  Relatively more complete and correct information.  Depends on honesty and competency of enumerator.  No necessary in schedule method.  Q can be used only when respondent is educated and cooperative.  Wider distribution of sample is possible.  Incomplete and wrong information is more.  Depends on quality of questionnaire.  Physical appearance of questionnaire should be attractive.
  • 27. Merits Suitable for large population Suitable for large geographical area Less time & cost Appropriate for sensitive & personal type enquiry Demerits Difficulty in replying to the question Some question may remain unanswered Low rate of return of questionnaire Replies may be given by any one other
  • 28.  SURVEY- A detailed study of geographical area to gather data attitudes, impressions, opinions, satisfaction level etc., by polling a section of the population  TYPE 1.CENSUS SURVEY 2.CONTINOUS OR REGULAR SURVEY 3.AD-HOC SURVEY
  • 29. Merits Covered large population Less expensive Information is accurate Demerits On small scale survey avoided Time consuming Information does not penetrate deeply Researcher must have good knowledge
  • 30.  It is the method of comprehensive study of social unit which may be a person , a family , an institution , an organisation or a community . Merits Direct behavioral study Real & personal experience record Make possible the study of social change Increase analysis ability & skills Demerits One case almost different from another case Personal bias Use only in limit sphere More time & money consuming
  • 31. Secondary data are those that have already been collected by others. These are usually in journals, periodicals, research publication ,official record etc. Secondary data may be available in the published or unpublished form. When it is not possible to collect the data by primary method , the investigator go for secondary method.
  • 33. Merits Quick and cheap source of data Wider geographical area Longer orientation period Leading to find primary data Demerits No fulfill our specific research needs Poor accuracy Data are not up to date Poor accessibility in some cases
  • 34. Primary data Real time data Sure about sources of data Help to give results/ finding Costly and time consuming Process Avoid biasness of response data More flexible Secondary data  Past data  Not sure about of sources of data  Refining the problem  Cheap and no time consuming process  Can not know in data biasness or not  Less flexible
  • 35. Processing involves editing , coding , classification & tabulation of the data EDITING-: it is careful scrutiny of data to insure that the data are is accurate CODING-: it refers to the process of assigning numerals or other symbols to answers so response can be put into a limited number of category. Editing Coding Classification Data Entry Validation Tabulation
  • 36. TABULATION-: it is concise , logical & orderly arrangement of data in a columns & rows But now a days use of the computer in processing of data CLASSIFICATION-: Data are classified on the basis of common characteristics which may be qualitative or descriptive & quantitative or numericals
  • 37. ONE WAY TABLE One way frequency table represents the distribution of cases on only a single dimension or variable TWO WAY TABLE distribution in terms of two or more variables and the relationship between two variable are shown in two way table.
  • 38. DEFINITION-: analysis mean the categorising , ordering , manipulating , & summerising of data to obtain answers to research question METHOD FOR ANALYSIS OF DATA 1) Parametric Or standard test-: # The sample is large # Population have normal distribution # The observation are independent # Variables are expressed in interval or ratio scale e.g. t-test , z-test, f-test , analysis of variance etc
  • 39. NON-PARAMETRIC TEST Also known as distribution –free test CHARECTERISTICS Use when normal distribution is doubtful Sample size is small Data expressed in terms of ranks E.g. chi square test ,The Mann –whitney U-test etc.
  • 40. A) FREQUENCY DISTRIBUTION The manner in which the total number of observations are distributed over different classes is called a frequency distribution or systematic arrangement of numeric values Frequency distribution represent in graphical form 1) Histogram 2) Bar Graph 3) Circle Graph /pie diagram 4) Frequency polygon 5) Cumulative frequency curve / ogive curve
  • 41. Its is two dimensional frequency density diagram It represent continuous frequency distribution Class interval on X-axis & frequency on Y-axis Class interval must be exclusive
  • 42.  It is simplest type of graphical representation of data  It is suitable for discrete frequency distribution  Simple bar graph  Double bar graph  Divided bar graph
  • 43. PIE GRAPH Definition: A graph that shows data in the form of a circle Advantages: • Shows percentages • Shows how a total is divided into parts Disadvantages • Not best for showing trends
  • 44. FREQUENCY POLYGON  It is use for ungrouped frequency distribution  Variable value on X-axis & frequency on Y-axis  Frequency plotted against the corresponding mid-value
  • 45. CUMULATIVE FREQUENCY CURVE  Cumulative frequency curve is also called ogive  It use when class interval are very small  Y-value are obtained by adding successive frequency (cumulative frequency )
  • 46. B) MEASURE OF CENTRAL VALUE/TENDENCY/LOCATION Five basic measures of central tendency Arithmetic mean Median Mode Geometrical mean Harmonic mean
  • 47. Mean The sum of the value of individual in the data divided by the number of individual in the data. FORMULA Here, ∑, represents the summation X, represents scores N, represents number of scores
  • 48. Median: Is the value which is located in the middle of a series when the observation are arranged in order of magnitude If the total number of numbers(n) is an odd number, then the formula is If the total number of the numbers(n) is an even number, then the formula is
  • 49. Mode Mode: The number that occurs most frequently in a set of numbers
  • 50. C) MEASURE OF DISPERSON  It indicate the extend of scattering or variability of item about a central value RANGE MEAN DEVIATION STANDARD DEVIATION QUARTILE DEVIATION COEFFICIENT OF VARIATION
  • 51. Range is difference between the smallest & largest of observation Range = largest value – smallest value  it is defined as the square root of the arithmetic mean of the squares of deviations of the observation from the arithmetic mean  Most commonly used measure of dispersion
  • 52. Mean of absolute deviation of all value of data from average ( mean , mode , median ) μ is the mean x is each value N is the number of values Mean Deviation = Σ|x - μ| N
  • 53. Quartile Deviation:  It is based on the lower quartile Q1 and the upper quartile Q3.  The difference Q3−Q1 is called the inter quartile range. The difference Q3−Q1 divided by 2 is called semi-inter-quartile range or the quartile deviation. Thus Q.D=Q3−Q1 2 Q1=Value of (n/4 )
  • 54. The coefficient of variation (CV) is defined as the ratio of the standard deviation to the mean Cv = Standard Deviation / Mean Cv = σ /μ
  • 55. t-Test t-Test is used for comparing the means of two independent group Paired t-test If there is any kind of correspondence between the individual values in the two samples The should be paired & differences taken and analysed directly as
  • 56.  Report writing is an essential skill for professionals in almost every field A report aims to inform, authority within the stipulated period Report help to know what has been done , why it was done how it was done , what result was obtained & what conclusion
  • 57.  it should be accurate & written in simple language  It is Complete and Self-explanatory  It is Comprehensive but Compact  It has a Proper Date and Signature  A good report should be able to sustain reader’s interest Features
  • 59. Inductive report • Initial stage • Executive summary • Introduction • Methodology • Conclusions • Discussion • references Deductive report • Initial stage • Executive summary • Introduction • Methodology • Discussion • Conclusions • references
  • 60. Initial stage contain following items Title page –: contain information related to title , author , year , month of submission & affiliation Acknowledgement -: it indicate the name of person , institutions & organisations who have sanctioned & help in various in conduct of research & preparation of report in various ways Content -: in this page the chapters and their page number including bibliography & appendices
  • 61. It contains all essential information in nutshell Introduce the topic to readers in a comprehensive way a) A clear & definite statement of problem b) A brief review of literature c) The concept of important term are explained
  • 62.  Selection of study area , sample and sample procedure method of data collection & their measurement statistical tools  Summary what you did and why  Use the past tense
  • 63. Findings or results  describes what you discovered, observed, etc, in your observations and experiments  Use the past tense. Discussion  Discusses and explains your findings and relates them to previous research  Use the present tense to make generalisations
  • 64.  Reports in written form are useful for future reference  Reports provide adequate and correct information as well as statistical data to management and helps in decision making  A report provides information of unknown facts i.e. new ideas new vision new solution to problem new research about a particular matter.
  • 65.  Research method in social science & extension education – G.L. RAY & SAGAR MANDAL  Foundation of Behavioural research KERLINGER , F.N.  Class note of biostatistics  Practical manual on biostatistics  INTERNET