This document provides an overview and table of contents for a book titled "Data Analysis from Scratch with Python". The book aims to provide a complete guide to using Python for data analysis and becoming an effective data analyst. It contains chapters on topics like data visualization, supervised and unsupervised learning, regression, classification, clustering, and natural language processing. The author believes Python is a good starting point for learning data analysis due to its simplicity and clarity compared to other languages like R. The book takes a hands-on approach using practical examples and case studies.


![You have a message.
You have a message.
You have a message.
You have a message.
You have a message.
You have a message.
You have a message.
You have a message.
Loop doesn’t exit until you typed ‘Casanova’
name = ''
while name != 'Casanova':
print('Please type your name.')
name = input()
print('Congratulations!')
For loop for i in range(10):
print(i ** 2)
Here’s the output: 0
1
4
9
16
25
36
49
64
81
#Adding numbers from 0 to 100
total = 0
for num in range(101):
total = total + num
print(total)
When you run this, the sum will be 5050.
#Another example. Positive and negative reviews.
all_reviews = [5, 5, 4, 4, 5, 3, 2, 5, 3, 2, 5, 4, 3, 1, 1, 2, 3, 5, 5]
positive_reviews = []
for i in all_reviews:
if i > 3:
print('Pass')](https://image.slidesharecdn.com/dataanalysisfromscratchwithpythonbeginnerguide-200112040731/85/Data-analysis-from-scratch-with-python-beginner-guide-21-320.jpg)
![positive_reviews.append(i)
else:
print('Fail')
print(positive_reviews)
print(len(positive_reviews))
ratio_positive = len(positive_reviews) / len(all_reviews)
print('Percentage of positive reviews: ')
print(ratio_positive * 100)
When you run this, you should see: Pass
Pass
Pass
Pass
Pass
Fail
Fail
Pass
Fail
Fail
Pass
Pass
Fail
Fail
Fail
Fail
Fail
Pass
Pass
[5, 5, 4, 4, 5, 5, 5, 4, 5, 5]
10
Percentage of positive reviews:
52.63157894736842
Functions def hello():
print('Hello world!')
hello()
Define the function, tell what it should do, and then use or call it later.
def add_numbers(a,b):](https://image.slidesharecdn.com/dataanalysisfromscratchwithpythonbeginnerguide-200112040731/85/Data-analysis-from-scratch-with-python-beginner-guide-22-320.jpg)
![print(a + b)
add_numbers(5,10)
add_numbers(35,55)
#Check if a number is odd or even.
def even_check(num):
if num % 2 == 0:
print('Number is even.')
else:
print('Hmm, it is odd.')
even_check(50)
even_check(51)
Lists my_list = [‘eggs’, ‘ham’, ‘bacon’] #list with strings colours = [‘red’,
‘green’, ‘blue’]
cousin_ages = [33, 35, 42] #list with integers mixed_list = [3.14, ‘circle’, ‘eggs’, 500] #list with integers
and strings #Working with lists colours = [‘red’, ‘blue’, ‘green’]
colours[0] #indexing starts at 0, so it returns first item in the list which is ‘red’
colours[1] #returns second item, which is ‘green’
#Slicing the list my_list = [0, 1, 2, 3, 4, 5, 6, 7, 8, 9]
print(my_list[0:2]) #returns [0, 1]
print(my_list[1:]) #returns [1, 2, 3, 4, 5, 6, 7, 8, 9]
print(my_list[3:6]) #returns [3, 4, 5]
#Length of list my_list = [0,1,2,3,4,5,6,7,8,9]
print(len(my_list)) #returns 10
#Assigning new values to list items colours = ['red', 'green', 'blue']
colours[0] = 'yellow'
print(colours) #result should be ['yellow', 'green', 'blue']
#Concatenation and appending colours = ['red', 'green', 'blue']
colours.append('pink')
print(colours)
The result will be:
['red', 'green', 'blue', 'pink']
fave_series = ['GOT', 'TWD', 'WW']
fave_movies = ['HP', 'LOTR', 'SW']
fave_all = fave_series + fave_movies
print(fave_all)
This prints ['GOT', 'TWD', 'WW', 'HP', 'LOTR', 'SW']](https://image.slidesharecdn.com/dataanalysisfromscratchwithpythonbeginnerguide-200112040731/85/Data-analysis-from-scratch-with-python-beginner-guide-23-320.jpg)
![6. A Quick Example
Iris Dataset
Let’s quickly see how data analysis and machine learning work in real world
data sets. The goal here is to quickly illustrate the potential of Python and
machine learning on some interesting problems.
In this particular example, the goal is to predict the species of an Iris flower
based on the length and width of its sepals and petals. First, we have to create a
model based on a dataset with the flowers’ measurements and their
corresponding species. Based on our code, our computer will “learn from the
data” and extract patterns from it. It will then apply what it learned to a new
dataset. Let’s look at the code.
#importing the necessary libraries from sklearn.datasets import load_iris
from sklearn import tree
from sklearn.metrics import accuracy_score
import numpy as np
#loading the iris dataset
iris = load_iris()
x = iris.data #array of the data
y = iris.target #array of labels (i.e answers) of each data entry
#getting label names i.e the three flower species
y_names = iris.target_names
#taking random indices to split the dataset into train and test
test_ids = np.random.permutation(len(x))
#splitting data and labels into train and test
#keeping last 10 entries for testing, rest for training
x_train = x[test_ids[:-10]]
x_test = x[test_ids[-10:]]
y_train = y[test_ids[:-10]]
y_test = y[test_ids[-10:]]
#classifying using decision tree
clf = tree.DecisionTreeClassifier()
#training (fitting) the classifier with the training set
clf.fit(x_train, y_train)](https://image.slidesharecdn.com/dataanalysisfromscratchwithpythonbeginnerguide-200112040731/85/Data-analysis-from-scratch-with-python-beginner-guide-28-320.jpg)
![#predictions on the test dataset
pred = clf.predict(x_test)
print(pred) #predicted labels i.e flower species
print(y_test) #actual labels
print((accuracy_score(pred, y_test)))*100 #prediction accuracy #Reference: http://docs.python-
guide.org/en/latest/scenarios/ml/
If we run the code, we’ll get something like this: [0 1 1 1 0 2 0 2 2 2]
[0 1 1 1 0 2 0 2 2 2]
100.0
The first line contains the predictions (0 is Iris setosa, 1 is Iris versicolor, 2 is Iris
virginica). The second line contains the actual flower species as indicated in the
dataset. Notice the prediction accuracy is 100%, which means we correctly
predicted each flower’s species.
These might all seem confusing at first. What you need to understand is that the
goal here is to create a model that predicts a flower’s species. To do that, we split
the data into training and test sets. We run the algorithm on the training set and
use it against the test set to know the accuracy. The result is we’re able to predict
the flower’s species on the test set based on what the computer learned from the
training set.
Potential & Implications
It’s a quick and simple example. But its potential and implications can be
enormous. With just a few modifications, you can apply the workflow to a wide
variety of tasks and problems.
For instance, we might be able to apply the same methodology on other flower
species, plants, and animals. We can also apply this in other Classification
problems (more on this later) such as determining if a cancer is benign or
malignant, if a person is a very likely customer, or if there’s a human face in the
photo.
The challenge here is to get enough quality data so our computer can properly
get “good training.” It’s a common methodology to first learn from the training
set and then apply the learning into the test set and possibly new data in the
future (this is the essence of machine learning).
It’s obvious now why many people are hyped about the true potential of data
analysis and machine learning. With enough data, we can create automated](https://image.slidesharecdn.com/dataanalysisfromscratchwithpythonbeginnerguide-200112040731/85/Data-analysis-from-scratch-with-python-beginner-guide-29-320.jpg)
![plt.show()
import matplotlib.pyplot as plt
from numpy.random import rand
fig, ax = plt.subplots()
for color in ['red', 'green', 'blue']:
n = 750
x, y = rand(2, n)
scale = 200.0 * rand(n)
ax.scatter(x, y, c=color, s=scale, label=color,
alpha=0.3, edgecolors='none')
ax.legend()
ax.grid(True)](https://image.slidesharecdn.com/dataanalysisfromscratchwithpythonbeginnerguide-200112040731/85/Data-analysis-from-scratch-with-python-beginner-guide-41-320.jpg)

![# Code source: Jaques Grobler
# License: BSD 3 clause
import matplotlib.pyplot as plt
import numpy as np
from sklearn import datasets, linear_model
from sklearn.metrics import mean_squared_error, r2_score
# Load the diabetes dataset
diabetes = datasets.load_diabetes()
# Use only one feature
diabetes_X = diabetes.data[:, np.newaxis, 2]
# Split the data into training/testing sets
diabetes_X_train = diabetes_X[:-20]
diabetes_X_test = diabetes_X[-20:]
# Split the targets into training/testing sets
diabetes_y_train = diabetes.target[:-20]
diabetes_y_test = diabetes.target[-20:]
# Create linear regression object
regr = linear_model.LinearRegression()
# Train the model using the training sets
regr.fit(diabetes_X_train, diabetes_y_train)
# Make predictions using the testing set
diabetes_y_pred = regr.predict(diabetes_X_test)
# The coefficients
print('Coefficients: n', regr.coef_)
# The mean squared error
print("Mean squared error: %.2f"
% mean_squared_error(diabetes_y_test, diabetes_y_pred))
# Explained variance score: 1 is perfect prediction
print('Variance score: %.2f' % r2_score(diabetes_y_test, diabetes_y_pred))
# Plot outputs
plt.scatter(diabetes_X_test, diabetes_y_test, color='black')
plt.plot(diabetes_X_test, diabetes_y_pred, color='blue', linewidth=3)
plt.xticks(())
plt.yticks(())](https://image.slidesharecdn.com/dataanalysisfromscratchwithpythonbeginnerguide-200112040731/85/Data-analysis-from-scratch-with-python-beginner-guide-45-320.jpg)
![5.1,66029.00
5.3,83088.00
5.9,81363.00
6.0,93940.00
6.8,91738.00
7.1,98273.00
7.9,101302.00
8.2,113812.00
8.7,109431.00
9.0,105582.00
9.5,116969.00
9.6,112635.00
10.3,122391.00
10.5,121872.00
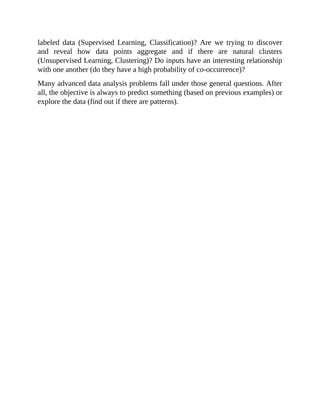
Here’s the Python code for fitting Simple Linear Regression to the Training Set:
# Importing the libraries
import matplotlib.pyplot as plt
import pandas as pd
# Importing the dataset
dataset = pd.read_csv('Salary_Data.csv')
X = dataset.iloc[:, :-1].values
y = dataset.iloc[:, 1].values
# Splitting the dataset into the Training set and Test set
from sklearn.model_selection import train_test_split
X_train, X_test, y_train, y_test = train_test_split(X, y, test_size = 1/3,
random_state = 0)
# Fitting Simple Linear Regression to the Training set
from sklearn.linear_model import LinearRegression
regressor = LinearRegression()
regressor.fit(X_train, y_train)
# Predicting the Test set results
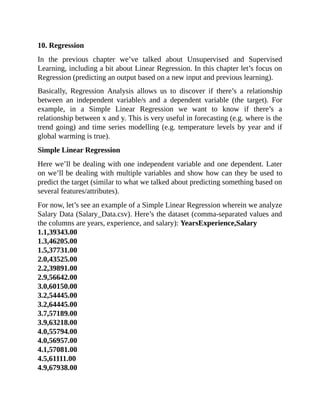
y_pred = regressor.predict(X_test)](https://image.slidesharecdn.com/dataanalysisfromscratchwithpythonbeginnerguide-200112040731/85/Data-analysis-from-scratch-with-python-beginner-guide-49-320.jpg)
![63408.86,129219.61,46085.25,California,97427.84
55493.95,103057.49,214634.81,Florida,96778.92
46426.07,157693.92,210797.67,California,96712.8
46014.02,85047.44,205517.64,New York,96479.51
28663.76,127056.21,201126.82,Florida,90708.19
44069.95,51283.14,197029.42,California,89949.14
20229.59,65947.93,185265.1,New York,81229.06
38558.51,82982.09,174999.3,California,81005.76
28754.33,118546.05,172795.67,California,78239.91
27892.92,84710.77,164470.71,Florida,77798.83
23640.93,96189.63,148001.11,California,71498.49
15505.73,127382.3,35534.17,New York,69758.98
22177.74,154806.14,28334.72,California,65200.33
1000.23,124153.04,1903.93,New York,64926.08
1315.46,115816.21,297114.46,Florida,49490.75
0,135426.92,0,California,42559.73
542.05,51743.15,0,New York,35673.41
0,116983.8,45173.06,California,14681.4
Notice that there are multiple features or independent variables (R&D Spend,
Administration, Marketing Spend, State). Again, the goal here is to reveal or
discover a relationship between the independent variables and the target (Profit).
Also notice that under the column ‘State’, the data is in text (not numbers).
You’ll see New York, California, and Florida instead of numbers. How do you
deal with this kind of data?
One convenient way to do that is by transforming categorical data (New York,
California, Florida) into numerical data. We can accomplish this if we use the
following lines of code: from sklearn.preprocessing import LabelEncoder,
OneHotEncoder
labelencoder = LabelEncoder()
X[:, 3] = labelencoder.fit_transform(X[:, 3]) #Note this
onehotencoder = OneHotEncoder(categorical_features = [3])
X = onehotencoder.fit_transform(X).toarray() Pay attention to X[:, 3] =
labelencoder.fit_transform(X[:, 3]) What we did there is to transform the data
in the fourth column (State). It’s number 3 because Python indexing starts at zero
(0). The goal was to transform categorical variables data into something we can](https://image.slidesharecdn.com/dataanalysisfromscratchwithpythonbeginnerguide-200112040731/85/Data-analysis-from-scratch-with-python-beginner-guide-53-320.jpg)
![work on. To do this, we’ll create “dummy variables” which take the values of 0
or 1. In other words, they indicate the presence or absence of something.
For example, we have the following data with categorical variables: 3.5, New
York 2.0, California 6.7, Florida If we use dummy variables, the above data
will be transformed into this: 3.5, 1, 0, 0
2.0, 0, 1, 0
6.7, 0, 0, 1
Notice that the column for State became equivalent to 3 columns:
New York California Florida
3.5 1 0 0
2.0 0 1 0
6.7 0 0 1
As mentioned earlier, dummy variables indicate the presence or absence of
something. They are commonly used as “substitute variables” so we can do a
quantitative analysis on qualitative data. From the new table above we can
quickly see that 3.5 is for New York (1 New York, 0 California, and 0 Florida).
It’s a convenient way of representing categories into numeric values.
However, there’s this so-called “dummy variable trap” wherein there’s an extra
variable that could have been removed because it can be predicted from the
others. In our example above, notice that when the columns for New York and
California are zero (0), automatically you’ll know it’s Florida. You can already
know which State it is even with just the 2 variable.
Continuing with our work on 50_Startups.csv, we can avoid the dummy variable
trap by including this in our code: X = X[:, 1:]
Let’s review our work so far: import numpy as np
import matplotlib.pyplot as plt
import pandas as pd](https://image.slidesharecdn.com/dataanalysisfromscratchwithpythonbeginnerguide-200112040731/85/Data-analysis-from-scratch-with-python-beginner-guide-54-320.jpg)
![# Importing the dataset
dataset = pd.read_csv('50_Startups.csv')
X = dataset.iloc[:, :-1].values
y = dataset.iloc[:, 4].values Let’s look at the data: dataset.head()
Then, we transform categorical variables into numeric ones (dummy variables):
# Encoding categorical data
from sklearn.preprocessing import LabelEncoder, OneHotEncoder
labelencoder = LabelEncoder()
X[:, 3] = labelencoder.fit_transform(X[:, 3])
onehotencoder = OneHotEncoder(categorical_features = [3])
X = onehotencoder.fit_transform(X).toarray() # Avoiding the Dummy
Variable Trap
X = X[:, 1:]
After those data preprocessing steps, the data would somehow look like this:
Notice that there are no categorical variables (New York, California, Florida)
and we’ve removed the “redundant variable” to avoid the dummy variable trap.](https://image.slidesharecdn.com/dataanalysisfromscratchwithpythonbeginnerguide-200112040731/85/Data-analysis-from-scratch-with-python-beginner-guide-55-320.jpg)
![http://chem-eng.utoronto.ca/~datamining/dmc/decision_tree_reg.htm
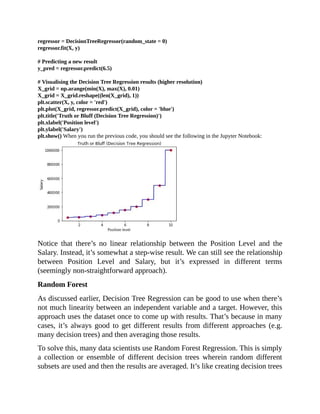
Instead of plotting and fitting a line, there are decision nodes and leaf nodes.
Let’s quickly look at an example to see how it works (using
Position_Salaries.csv): The dataset: Position,Level,Salary
Business Analyst,1,45000
Junior Consultant,2,50000
Senior Consultant,3,60000
Manager,4,80000
Country Manager,5,110000
Region Manager,6,150000
Partner,7,200000
Senior Partner,8,300000
C-level,9,500000
CEO,10,1000000
# Decision Tree Regression
# Importing the libraries
import numpy as np
import matplotlib.pyplot as plt
import pandas as pd
# Importing the dataset
dataset = pd.read_csv('Position_Salaries.csv')
X = dataset.iloc[:, 1:2].values
y = dataset.iloc[:, 2].values
# Splitting the dataset into the Training set and Test set
"""from sklearn.cross_validation import train_test_split
X_train, X_test, y_train, y_test = train_test_split(X, y, test_size = 0.2, random_state = 0)"""
# Fitting Decision Tree Regression to the dataset
from sklearn.tree import DecisionTreeRegressor](https://image.slidesharecdn.com/dataanalysisfromscratchwithpythonbeginnerguide-200112040731/85/Data-analysis-from-scratch-with-python-beginner-guide-57-320.jpg)
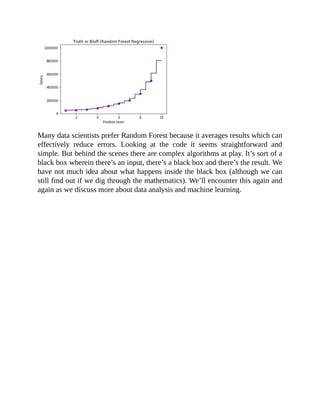
![again and again and then getting the results of each.
In code, this would look a lot like this: # Random Forest Regression
# Importing the libraries
import numpy as np
import matplotlib.pyplot as plt
import pandas as pd
%matplotlib inline
# Importing the dataset
dataset = pd.read_csv('Position_Salaries.csv')
X = dataset.iloc[:, 1:2].values
y = dataset.iloc[:, 2].values
# Splitting the dataset into the Training set and Test set
"""from sklearn.cross_validation import train_test_split
X_train, X_test, y_train, y_test = train_test_split(X, y, test_size = 0.2,
random_state = 0)"""
# Feature Scaling
"""from sklearn.preprocessing import StandardScaler
sc_X = StandardScaler()
X_train = sc_X.fit_transform(X_train)
X_test = sc_X.transform(X_test)
sc_y = StandardScaler()
y_train = sc_y.fit_transform(y_train)"""
# Fitting Random Forest Regression to the dataset
from sklearn.ensemble import RandomForestRegressor
regressor = RandomForestRegressor(n_estimators = 300, random_state = 0)
regressor.fit(X, y)
# Predicting a new result
y_pred = regressor.predict(6.5)
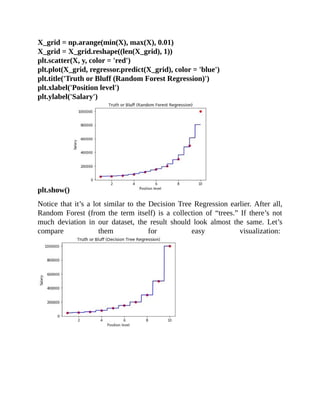
# Visualising the Random Forest Regression results (higher resolution)](https://image.slidesharecdn.com/dataanalysisfromscratchwithpythonbeginnerguide-200112040731/85/Data-analysis-from-scratch-with-python-beginner-guide-59-320.jpg)
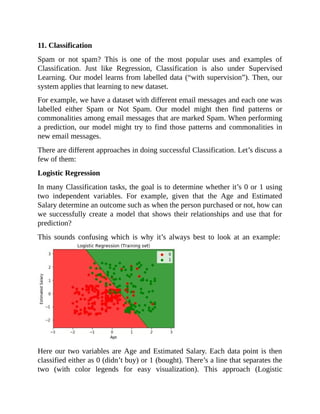
![Regression) is based on probability (e.g. the probability of a data point if it’s a 0
or 1).
As with Regression in the previous chapter wherein there’s this so-called black
box, the behind the scenes of Logistic Regression for Classification can seem
complex. Good news is its implementation is straightforward especially when
we use Python and scikit-learn: Here’s a peek of the dataset first
(‘Social_Network_Ads.csv’):
# Logistic Regression
# Importing the libraries
import numpy as np
import matplotlib.pyplot as plt
import pandas as pd
%matplotlib inline
# Importing the dataset
dataset = pd.read_csv('Social_Network_Ads.csv')
X = dataset.iloc[:, [2, 3]].values
y = dataset.iloc[:, 4].values
# Splitting the dataset into the Training set and Test set
from sklearn.model_selection import train_test_split
X_train, X_test, y_train, y_test = train_test_split(X, y, test_size = 0.25, random_state = 0)
# Feature Scaling
from sklearn.preprocessing import StandardScaler
sc = StandardScaler()
X_train = sc.fit_transform(X_train)
X_test = sc.transform(X_test)](https://image.slidesharecdn.com/dataanalysisfromscratchwithpythonbeginnerguide-200112040731/85/Data-analysis-from-scratch-with-python-beginner-guide-63-320.jpg)
![# Fitting Logistic Regression to the Training set
from sklearn.linear_model import LogisticRegression
classifier = LogisticRegression(random_state = 0)
classifier.fit(X_train, y_train)
# Predicting the Test set results
y_pred = classifier.predict(X_test)
# Making the Confusion Matrix
from sklearn.metrics import confusion_matrix
cm = confusion_matrix(y_test, y_pred)
# Visualising the Training set results
from matplotlib.colors import ListedColormap
X_set, y_set = X_train, y_train
X1, X2 = np.meshgrid(np.arange(start = X_set[:, 0].min() - 1, stop = X_set[:, 0].max() + 1, step =
0.01),
np.arange(start = X_set[:, 1].min() - 1, stop = X_set[:, 1].max() + 1, step = 0.01))
plt.contourf(X1, X2, classifier.predict(np.array([X1.ravel(), X2.ravel()]).T).reshape(X1.shape),
alpha = 0.75, cmap = ListedColormap(('red', 'green')))
plt.xlim(X1.min(), X1.max())
plt.ylim(X2.min(), X2.max())
for i, j in enumerate(np.unique(y_set)):
plt.scatter(X_set[y_set == j, 0], X_set[y_set == j, 1],
c = ListedColormap(('red', 'green'))(i), label = j)
plt.title('Logistic Regression (Training set)')
plt.xlabel('Age')
plt.ylabel('Estimated Salary')
plt.legend()
plt.show()
# Visualising the Test set results
from matplotlib.colors import ListedColormap
X_set, y_set = X_test, y_test
X1, X2 = np.meshgrid(np.arange(start = X_set[:, 0].min() - 1, stop = X_set[:, 0].max() + 1, step =
0.01),
np.arange(start = X_set[:, 1].min() - 1, stop = X_set[:, 1].max() + 1, step = 0.01))
plt.contourf(X1, X2, classifier.predict(np.array([X1.ravel(), X2.ravel()]).T).reshape(X1.shape),
alpha = 0.75, cmap = ListedColormap(('red', 'green')))
plt.xlim(X1.min(), X1.max())
plt.ylim(X2.min(), X2.max())
for i, j in enumerate(np.unique(y_set)):
plt.scatter(X_set[y_set == j, 0], X_set[y_set == j, 1],
c = ListedColormap(('red', 'green'))(i), label = j)
plt.title('Logistic Regression (Test set)')
plt.xlabel('Age')
plt.ylabel('Estimated Salary')
plt.legend()
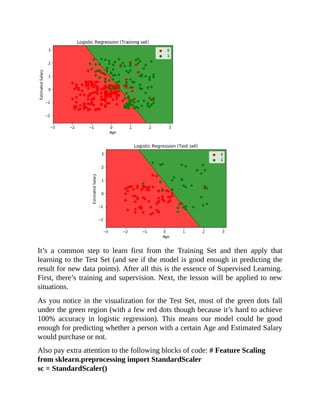
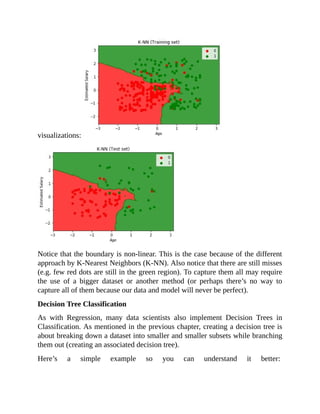
plt.show() When we run this, you’ll see the following visualizations in your Jupyter Notebook:](https://image.slidesharecdn.com/dataanalysisfromscratchwithpythonbeginnerguide-200112040731/85/Data-analysis-from-scratch-with-python-beginner-guide-64-320.jpg)
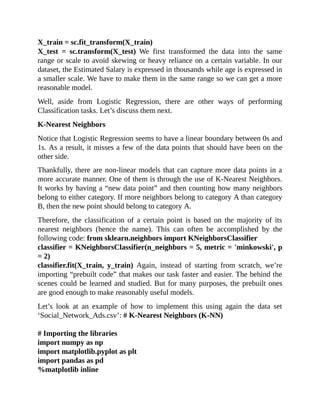
![# Importing the dataset
dataset = pd.read_csv('Social_Network_Ads.csv')
X = dataset.iloc[:, [2, 3]].values
y = dataset.iloc[:, 4].values
# Splitting the dataset into the Training set and Test set
from sklearn.model_selection import train_test_split
X_train, X_test, y_train, y_test = train_test_split(X, y, test_size = 0.25,
random_state = 0)
# Feature Scaling
from sklearn.preprocessing import StandardScaler
sc = StandardScaler()
X_train = sc.fit_transform(X_train)
X_test = sc.transform(X_test)
# Fitting K-NN to the Training set
from sklearn.neighbors import KNeighborsClassifier
classifier = KNeighborsClassifier(n_neighbors = 5, metric = 'minkowski', p
= 2)
classifier.fit(X_train, y_train)
# Predicting the Test set results
y_pred = classifier.predict(X_test)
# Making the Confusion Matrix
from sklearn.metrics import confusion_matrix
cm = confusion_matrix(y_test, y_pred)
# Visualising the Training set results
from matplotlib.colors import ListedColormap
X_set, y_set = X_train, y_train
X1, X2 = np.meshgrid(np.arange(start = X_set[:, 0].min() - 1, stop = X_set[:,
0].max() + 1, step = 0.01),
np.arange(start = X_set[:, 1].min() - 1, stop = X_set[:, 1].max() + 1, step =
0.01))](https://image.slidesharecdn.com/dataanalysisfromscratchwithpythonbeginnerguide-200112040731/85/Data-analysis-from-scratch-with-python-beginner-guide-67-320.jpg)
![plt.contourf(X1, X2, classifier.predict(np.array([X1.ravel(),
X2.ravel()]).T).reshape(X1.shape),
alpha = 0.75, cmap = ListedColormap(('red', 'green')))
plt.xlim(X1.min(), X1.max())
plt.ylim(X2.min(), X2.max())
for i, j in enumerate(np.unique(y_set)):
plt.scatter(X_set[y_set == j, 0], X_set[y_set == j, 1],
c = ListedColormap(('red', 'green'))(i), label = j)
plt.title('K-NN (Training set)')
plt.xlabel('Age')
plt.ylabel('Estimated Salary')
plt.legend()
plt.show()
# Visualising the Test set results
from matplotlib.colors import ListedColormap
X_set, y_set = X_test, y_test
X1, X2 = np.meshgrid(np.arange(start = X_set[:, 0].min() - 1, stop = X_set[:,
0].max() + 1, step = 0.01),
np.arange(start = X_set[:, 1].min() - 1, stop = X_set[:, 1].max() + 1, step =
0.01))
plt.contourf(X1, X2, classifier.predict(np.array([X1.ravel(),
X2.ravel()]).T).reshape(X1.shape),
alpha = 0.75, cmap = ListedColormap(('red', 'green')))
plt.xlim(X1.min(), X1.max())
plt.ylim(X2.min(), X2.max())
for i, j in enumerate(np.unique(y_set)):
plt.scatter(X_set[y_set == j, 0], X_set[y_set == j, 1],
c = ListedColormap(('red', 'green'))(i), label = j)
plt.title('K-NN (Test set)')
plt.xlabel('Age')
plt.ylabel('Estimated Salary')
plt.legend()
plt.show() When we run this in Jupyter Notebook, we should see the following](https://image.slidesharecdn.com/dataanalysisfromscratchwithpythonbeginnerguide-200112040731/85/Data-analysis-from-scratch-with-python-beginner-guide-68-320.jpg)
![Notice that branches and leaves result from breaking down the dataset into
smaller subsets. In Classification, we can similarly apply this through the
following code (again using the Social_Network_Ads.csv): # Decision Tree
Classification
# Importing the libraries
import numpy as np
import matplotlib.pyplot as plt
import pandas as pd
%matplotlib inline
# Importing the dataset
dataset = pd.read_csv('Social_Network_Ads.csv')
X = dataset.iloc[:, [2, 3]].values
y = dataset.iloc[:, 4].values
# Splitting the dataset into the Training set and Test set
from sklearn.model_selection import train_test_split
X_train, X_test, y_train, y_test = train_test_split(X, y, test_size = 0.25,
random_state = 0)
# Feature Scaling
from sklearn.preprocessing import StandardScaler
sc = StandardScaler()
X_train = sc.fit_transform(X_train)
X_test = sc.transform(X_test)](https://image.slidesharecdn.com/dataanalysisfromscratchwithpythonbeginnerguide-200112040731/85/Data-analysis-from-scratch-with-python-beginner-guide-70-320.jpg)
![# Fitting Decision Tree Classification to the Training set
from sklearn.tree import DecisionTreeClassifier
classifier = DecisionTreeClassifier(criterion = 'entropy', random_state = 0)
classifier.fit(X_train, y_train)
# Predicting the Test set results
y_pred = classifier.predict(X_test)
# Making the Confusion Matrix
from sklearn.metrics import confusion_matrix
cm = confusion_matrix(y_test, y_pred)
# Visualising the Training set results
from matplotlib.colors import ListedColormap
X_set, y_set = X_train, y_train
X1, X2 = np.meshgrid(np.arange(start = X_set[:, 0].min() - 1, stop = X_set[:,
0].max() + 1, step = 0.01),
np.arange(start = X_set[:, 1].min() - 1, stop = X_set[:, 1].max() + 1, step =
0.01))
plt.contourf(X1, X2, classifier.predict(np.array([X1.ravel(),
X2.ravel()]).T).reshape(X1.shape),
alpha = 0.75, cmap = ListedColormap(('red', 'green')))
plt.xlim(X1.min(), X1.max())
plt.ylim(X2.min(), X2.max())
for i, j in enumerate(np.unique(y_set)):
plt.scatter(X_set[y_set == j, 0], X_set[y_set == j, 1],
c = ListedColormap(('red', 'green'))(i), label = j)
plt.title('Decision Tree Classification (Training set)')
plt.xlabel('Age')
plt.ylabel('Estimated Salary')
plt.legend()
plt.show()
# Visualising the Test set results
from matplotlib.colors import ListedColormap
X_set, y_set = X_test, y_test
X1, X2 = np.meshgrid(np.arange(start = X_set[:, 0].min() - 1, stop = X_set[:,](https://image.slidesharecdn.com/dataanalysisfromscratchwithpythonbeginnerguide-200112040731/85/Data-analysis-from-scratch-with-python-beginner-guide-71-320.jpg)
![0].max() + 1, step = 0.01),
np.arange(start = X_set[:, 1].min() - 1, stop = X_set[:, 1].max() + 1, step =
0.01))
plt.contourf(X1, X2, classifier.predict(np.array([X1.ravel(),
X2.ravel()]).T).reshape(X1.shape),
alpha = 0.75, cmap = ListedColormap(('red', 'green')))
plt.xlim(X1.min(), X1.max())
plt.ylim(X2.min(), X2.max())
for i, j in enumerate(np.unique(y_set)):
plt.scatter(X_set[y_set == j, 0], X_set[y_set == j, 1],
c = ListedColormap(('red', 'green'))(i), label = j)
plt.title('Decision Tree Classification (Test set)')
plt.xlabel('Age')
plt.ylabel('Estimated Salary')
plt.legend()
plt.show() The most important difference is in this block of code: from
sklearn.tree import DecisionTreeClassifier
classifier = DecisionTreeClassifier(criterion = 'entropy', random_state = 0)
classifier.fit(X_train, y_train) When we run the whole code (including the data
visualization), we’ll see this:](https://image.slidesharecdn.com/dataanalysisfromscratchwithpythonbeginnerguide-200112040731/85/Data-analysis-from-scratch-with-python-beginner-guide-72-320.jpg)
![Notice the huge difference compared to Logistic Regression and K-Nearest
Neighbors (K-NN). In these latter two, there are just two boundaries. But here in
our Decision Tree Classification, there are points outside the main red region
that fall inside “mini red regions.” As a result, our model was able to capture
data points that might be impossible otherwise (e.g. when using Logistic
Regression).
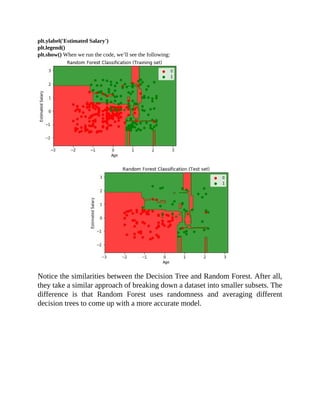
Random Forest Classification
Recall from the previous chapter about Regression that a Random Forest is a
collection or ensemble of many decision trees. This also applies to Classification
wherein many decision trees are used and the results are averaged.
# Random Forest Classification
# Importing the libraries
import numpy as np
import matplotlib.pyplot as plt
import pandas as pd
%matplotlib inline
# Importing the dataset
dataset = pd.read_csv('Social_Network_Ads.csv')
X = dataset.iloc[:, [2, 3]].values
y = dataset.iloc[:, 4].values
# Splitting the dataset into the Training set and Test set
from sklearn.model_selection import train_test_split
X_train, X_test, y_train, y_test = train_test_split(X, y, test_size = 0.25, random_state = 0)
# Feature Scaling
from sklearn.preprocessing import StandardScaler](https://image.slidesharecdn.com/dataanalysisfromscratchwithpythonbeginnerguide-200112040731/85/Data-analysis-from-scratch-with-python-beginner-guide-73-320.jpg)
![sc = StandardScaler()
X_train = sc.fit_transform(X_train)
X_test = sc.transform(X_test)
# Fitting Random Forest Classification to the Training set
from sklearn.ensemble import RandomForestClassifier
classifier = RandomForestClassifier(n_estimators = 10, criterion = 'entropy', random_state = 0)
classifier.fit(X_train, y_train)
# Predicting the Test set results
y_pred = classifier.predict(X_test)
# Making the Confusion Matrix
from sklearn.metrics import confusion_matrix
cm = confusion_matrix(y_test, y_pred)
# Visualising the Training set results
from matplotlib.colors import ListedColormap
X_set, y_set = X_train, y_train
X1, X2 = np.meshgrid(np.arange(start = X_set[:, 0].min() - 1, stop = X_set[:, 0].max() + 1, step =
0.01),
np.arange(start = X_set[:, 1].min() - 1, stop = X_set[:, 1].max() + 1, step = 0.01))
plt.contourf(X1, X2, classifier.predict(np.array([X1.ravel(), X2.ravel()]).T).reshape(X1.shape),
alpha = 0.75, cmap = ListedColormap(('red', 'green')))
plt.xlim(X1.min(), X1.max())
plt.ylim(X2.min(), X2.max())
for i, j in enumerate(np.unique(y_set)):
plt.scatter(X_set[y_set == j, 0], X_set[y_set == j, 1],
c = ListedColormap(('red', 'green'))(i), label = j)
plt.title('Random Forest Classification (Training set)')
plt.xlabel('Age')
plt.ylabel('Estimated Salary')
plt.legend()
plt.show()
# Visualising the Test set results
from matplotlib.colors import ListedColormap
X_set, y_set = X_test, y_test
X1, X2 = np.meshgrid(np.arange(start = X_set[:, 0].min() - 1, stop = X_set[:, 0].max() + 1, step =
0.01),
np.arange(start = X_set[:, 1].min() - 1, stop = X_set[:, 1].max() + 1, step = 0.01))
plt.contourf(X1, X2, classifier.predict(np.array([X1.ravel(), X2.ravel()]).T).reshape(X1.shape),
alpha = 0.75, cmap = ListedColormap(('red', 'green')))
plt.xlim(X1.min(), X1.max())
plt.ylim(X2.min(), X2.max())
for i, j in enumerate(np.unique(y_set)):
plt.scatter(X_set[y_set == j, 0], X_set[y_set == j, 1],
c = ListedColormap(('red', 'green'))(i), label = j)
plt.title('Random Forest Classification (Test set)')
plt.xlabel('Age')](https://image.slidesharecdn.com/dataanalysisfromscratchwithpythonbeginnerguide-200112040731/85/Data-analysis-from-scratch-with-python-beginner-guide-74-320.jpg)
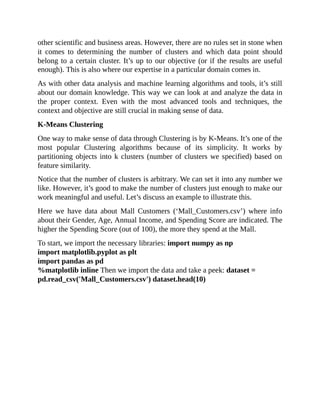
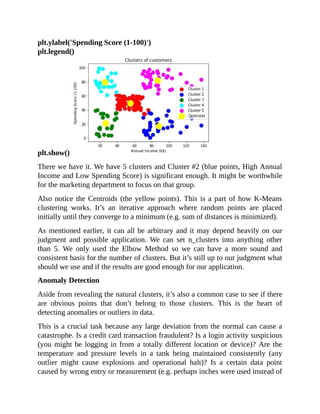
![In this example we’re more interested in grouping the Customers according to
their Annual Income and Spending Score.
X = dataset.iloc[:, [3, 4]].values Our goal here is to reveal the clusters and help the marketing department
formulate their strategies. For instance, we might subdivide the Customers in 5 distinct groups:
1. Medium Annual Income, Medium Spending Score
2. High Annual Income, Low Spending Score
3. Low Annual Income, Low Spending Score
4. Low Annual Income, High Spending Score
5. High Annual Income, High Spending Score
It’s worthwhile to pay attention to the #2 Group (High Annual Income, Low
Spending Score). If there’s a sizable number of customers that fall under this
group, it could mean a huge opportunity for the mall. These customers have high
Annual Income and yet they’re spending or using most of their money elsewhere
(not in the Mall). If we could know that they’re in sufficient numbers, the
marketing department could formulate specific strategies to entice Cluster #2 to
buy more from the Mall.
Although the number of clusters is often arbitrary, there are ways to find that
optimal number. One such way is through the Elbow Method and WCSS
(within-cluster sums of squares). Here’s the code to accomplish this: from
sklearn.cluster import KMeans
wcss = []
for i in range(1, 11):
kmeans = KMeans(n_clusters = i, init = 'k-means++', random_state = 42)
kmeans.fit(X)](https://image.slidesharecdn.com/dataanalysisfromscratchwithpythonbeginnerguide-200112040731/85/Data-analysis-from-scratch-with-python-beginner-guide-78-320.jpg)
![wcss.append(kmeans.inertia_)
plt.plot(range(1, 11), wcss)
plt.title('The Elbow Method')
plt.xlabel('Number of clusters')
plt.ylabel('WCSS')
plt.show()
Notice that the “elbow” points at 5 (number of clusters). Coincidentally, this
number was also the “desired” number of groups that will subdivide the dataset
according to their Annual Income and Spending Score.
After determining the optimal number of clusters, we can then proceed with
applying K-Means to the dataset and then performing data visualization: kmeans
= KMeans(n_clusters = 5, init = 'k-means++', random_state = 42)
y_kmeans = kmeans.fit_predict(X) plt.scatter(X[y_kmeans == 0, 0],
X[y_kmeans == 0, 1], s = 100, c = 'red', label = 'Cluster 1')
plt.scatter(X[y_kmeans == 1, 0], X[y_kmeans == 1, 1], s = 100, c = 'blue',
label = 'Cluster 2')
plt.scatter(X[y_kmeans == 2, 0], X[y_kmeans == 2, 1], s = 100, c = 'green',
label = 'Cluster 3')
plt.scatter(X[y_kmeans == 3, 0], X[y_kmeans == 3, 1], s = 100, c = 'cyan',
label = 'Cluster 4')
plt.scatter(X[y_kmeans == 4, 0], X[y_kmeans == 4, 1], s = 100, c =
'magenta', label = 'Cluster 5')
plt.scatter(kmeans.cluster_centers_[:, 0], kmeans.cluster_centers_[:, 1], s =
300, c = 'yellow', label = 'Centroids')
plt.title('Clusters of customers')
plt.xlabel('Annual Income (k$)')](https://image.slidesharecdn.com/dataanalysisfromscratchwithpythonbeginnerguide-200112040731/85/Data-analysis-from-scratch-with-python-beginner-guide-79-320.jpg)
![sets (product sets) and their corresponding level of relatedness or support to one
another. Here’s a peek of the dataset to give you a better idea:
shrimp,almonds,avocado,vegetables mix,green grapes,whole weat
flour,yams,cottage cheese,energy drink,tomato juice,low fat yogurt,green
tea,honey,salad,mineral water,salmon,antioxydant juice,frozen
smoothie,spinach,olive oil
burgers,meatballs,eggs
chutney
turkey,avocado
mineral water,milk,energy bar,whole wheat rice,green tea
low fat yogurt
whole wheat pasta,french fries
soup,light cream,shallot
frozen vegetables,spaghetti,green tea
french fries Those are listed according to the transactions where they appear.
For example, in the first transaction the customer bought different things (from
shrimp to olive oil). In the second transaction the customer bought burgers,
meatballs, and eggs.
As before, let’s import the necessary library/libraries so that we can work on the
data: import pandas as pd
dataset = pd.read_csv('Market_Basket_Optimisation.csv', header = None)
Next is we add the items in a list so that we can work on them much easier. We
can accomplish this by initializing an empty list and then running a for loop (still
remember how to do all these?): transactions = []
for i in range(0, 7501):
transactions.append([str(dataset.values[i,j]) for j in range(0, 20)]) After
we’ve done that, we should then generate a list of “related products” with their
corresponding level of support or relatedness. One way to accomplish this is by
the implementation of the Apriori algorithm (for association rule learning).
Thankfully, we don’t have to write anything from scratch.
We can use Apyori which is a simple implementation of the Apriori algorithm.
You can find it here for your reference:
https://pypi.org/project/apyori/#description
It’s prebuilt for us and almost ready for our own usage. It’s similar to how we
use scikit-learn, pandas, and numpy. Instead of starting from scratch, we already](https://image.slidesharecdn.com/dataanalysisfromscratchwithpythonbeginnerguide-200112040731/85/Data-analysis-from-scratch-with-python-beginner-guide-84-320.jpg)
![have blocks of code we can simply implement. Take note that coding everything
from scratch is time consuming and technically challenging.
To implement Apyori, we can import it similarly as how we import other
libraries: from apyori import apriori Next is we set up the rules (the levels of
minimum relatedness) so we can somehow generate a useful list of related items.
That’s because almost any two items might have some level of relatedness. The
objective here is to include only the list that could be useful for us.
rules = apriori(transactions, min_support = 0.003, min_confidence = 0.2,
min_lift = 3, min_length = 2) Well that’s the implementation of Apriori using
Apyori. The next step is to generate and view the results. We can accomplish this
using the following block of code: results = list(rules)
results_list = []
for i in range(0, len(results)):
results_list.append('RULE:t' + str(results[i][0]) + 'nSUPPORT:t' +
str(results[i][1]))
print (results_list) When you run all the code in Jupyter Notebook, you’ll see
something like this:
It’s messy and almost incomprehensible. But if you run it in Spyder (another
useful data science package included in Anaconda installation), the result will](https://image.slidesharecdn.com/dataanalysisfromscratchwithpythonbeginnerguide-200112040731/85/Data-analysis-from-scratch-with-python-beginner-guide-85-320.jpg)
![data from Ads_CTR_Optimisation.csv) to better illustrate the idea: As usual we
first import the necessary libraries so that we can work on our data (and also for
data visualization) import matplotlib.pyplot as plt
import pandas as pd
%matplotlib inline #so plots can show in our Jupyter Notebook We then
import the dataset and take a peek dataset =
pd.read_csv('Ads_CTR_Optimisation.csv') dataset.head(10)
In each round, the ads are displayed and it’s indicated which one/ones were
clicked (0 if not clicked, 1 if clicked). As discussed earlier, the goal is to explore
first, pick the winner and then exploit it.
One popular way to achieve this is by Thompson Sampling. Simply, it addresses
the exploration-exploitation dilemma (trying to achieve a balance) by sampling
or trying the promising actions while ignoring or discarding actions that are
likely to underperform. The algorithm works on probabilities and this can be
expressed in code through the following: import random
N = 10000
d = 10
ads_selected = []
numbers_of_rewards_1 = [0] * d
numbers_of_rewards_0 = [0] * d
total_reward = 0
for n in range(0, N):
ad = 0
max_random = 0](https://image.slidesharecdn.com/dataanalysisfromscratchwithpythonbeginnerguide-200112040731/85/Data-analysis-from-scratch-with-python-beginner-guide-89-320.jpg)
![for i in range(0, d):
random_beta = random.betavariate(numbers_of_rewards_1[i] + 1,
numbers_of_rewards_0[i] + 1)
if random_beta > max_random:
max_random = random_beta
ad = i
ads_selected.append(ad)
reward = dataset.values[n, ad]
if reward == 1:
numbers_of_rewards_1[ad] = numbers_of_rewards_1[ad] + 1
else:
numbers_of_rewards_0[ad] = numbers_of_rewards_0[ad] + 1
total_reward = total_reward + reward When we run and the code and
visualize: plt.hist(ads_selected)
plt.title('Histogram of ads selections')
plt.xlabel('Ads')
plt.ylabel('Number of times each ad was selected')
plt.show()
Notice that the implementation of Thompson sampling can be very complex. It’s
an interesting algorithm which is widely popular in online ad optimization, news
article recommendation, product assortment and other business applications.
There are other interesting algorithms and heuristics such as Upper Confidence
Bound. The goal is to earn while learning. Instead of later analysis, our
algorithm can perform and adjust in real time. We’re hoping to maximize the
reward by trying to balance the tradeoff between exploration and exploitation
(maximize immediate performance or “learn more” to improve future](https://image.slidesharecdn.com/dataanalysisfromscratchwithpythonbeginnerguide-200112040731/85/Data-analysis-from-scratch-with-python-beginner-guide-90-320.jpg)
![will remain like this:
Pay attention to the Output. Notice that the Classification seems worse. Instead
of enclosing most of the yellow points under the Yellow region, there are a lot of
misses (many yellow points fall under the Blue region instead). This occurred
because of the change in parameters we’ve done.
For instance, the Learning Rate has a huge effect on accuracy and achieving just
the right convergence. If we make the Learning Rate too low, convergence might
take a lot of time. And if the Learning Rate is too high (as with our example
earlier), we might not reach the convergence at all because we overshot it and
missed.
There are several ways to achieve convergence within reasonable time (e.g.
Learning Rate is just right, more hidden layers, probably fewer or more Features
to include, applying Regularization). But “overly optimizing” for everything
might not make economic sense. It’s good to set a clear objective at the start and
stick to it. If there are other interesting or promising opportunities that pop up,
you might want to further tune the parameters and improve the model’s
performance.
Anyway, if you want to get an idea how an ANN might look like in Python,
here’s a sample code: X = np.array([ [0,0,1],[0,1,1],[1,0,1],[1,1,1] ])
y = np.array([[0,1,1,0]]).T
syn0 = 2*np.random.random((3,4)) - 1
syn1 = 2*np.random.random((4,1)) - 1
for j in xrange(60000):
l1 = 1/(1+np.exp(-(np.dot(X,syn0))))
l2 = 1/(1+np.exp(-(np.dot(l1,syn1))))
l2_delta = (y - l2)*(l2*(1-l2))
l1_delta = l2_delta.dot(syn1.T) * (l1 * (1-l1))](https://image.slidesharecdn.com/dataanalysisfromscratchwithpythonbeginnerguide-200112040731/85/Data-analysis-from-scratch-with-python-beginner-guide-96-320.jpg)


![Ongil.ai Startup Pitch Deck [ MXR.world ]](https://cdn.slidesharecdn.com/ss_thumbnails/ongil-241019090738-4467a06a-thumbnail.jpg?width=640&height=640&fit=bounds)