More Related Content
Similar to India's Macroeconomic Indicators 2005-2011
Similar to India's Macroeconomic Indicators 2005-2011 (20)
India's Macroeconomic Indicators 2005-2011
- 1. INDIA'S MACROECONOMIC INDICATORS
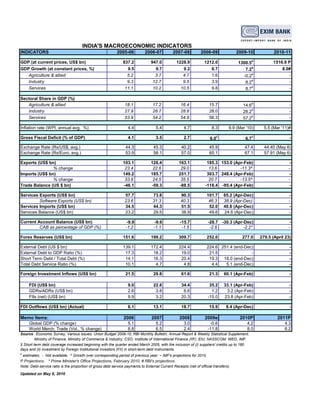
INDICATORS 2005-06 2006-07 2007-08 2008-09 2009-10 2010-11
GDP (at current prices, US$ bn) 837.2 947.0 1228.9 1212.0 1300.5e 1516.8 P
e
GDP Growth (at constant prices, %) 9.5 9.7 9.2 6.7 7.2 8.0#
Agriculture & allied 5.2 3.7 4.7 1.6 -0.2e -
e
Industry 9.3 12.7 9.5 3.9 8.2 -
e
Services 11.1 10.2 10.5 9.8 8.7 -
Sectoral Share in GDP (%)
e
Agriculture & allied 18.1 17.2 16.4 15.7 14.6 -
Industry 27.9 28.7 28.8 28.0 28.2e -
Services 53.9 54.2 54.8 56.3 57.2e -
Inflation rate (WPI, annual avg. %) 4.4 5.4 4.7 8.3 9.9 (Mar '10) 5.5 (Mar '11)#
Gross Fiscal Deficit (% of GDP) 4.1 3.5 2.7 e e -
6.0 6.7
Exchange Rate (Rs/US$, avg.) 44.3 45.3 40.2 45.9 47.4 44.40 (May 6)
Exchange Rate (Rs/Euro, avg.) 53.9 58.1 57.0 65.1 67.1 57.91 (May 6)
Exports (US$ bn) 103.1 126.4 163.1 185.3 153.0 (Apr-Feb) -
% change 23.4 22.6 29.0 13.6 -11.3^ -
Imports (US$ bn) 149.2 185.7 251.7 303.7 248.4 (Apr-Feb) -
% change 33.8 24.5 35.5 20.7 -13.5^ -
Trade Balance (US $ bn) -46.1 -59.3 -88.5 -118.4 -95.4 (Apr-Feb) -
Services Exports (US$ bn) 57.7 73.8 90.3 101.7 65.2 (Apr-Dec) -
Software Exports (US$ bn) 23.6 31.3 40.3 46.3 38.9 (Apr-Dec) -
Services Imports (US$ bn) 34.5 44.3 51.5 52.0 40.6 (Apr-Dec) -
Services Balance (US$ bn) 23.2 29.5 38.9 49.6 24.6 (Apr-Dec) -
Current Account Balance (US$ bn) -9.9 -9.6 -15.7 -28.7 -30.3 (Apr-Dec) -
CAB as percentage of GDP (%) -1.2 -1.1 -1.5 -2.6 -2.2* -
Forex Reserves (US$ bn) 151.6 199.2 309.7 252.0 277.0 279.5 (April 23)
External Debt (US $ bn) 139.1 172.4 224.4 224.6 251.4 (end-Dec) -
External Debt to GDP Ratio (%) 17.3 18.2 19.0 21.5 - -
Short Term Debt / Total Debt (%) 14.1 16.3 20.4 19.3 18.0 (end-Dec) -
Total Debt Service Ratio (%) 10.1 4.7 4.8 4.4 5.1 (end-Dec) -
Foreign Investment Inflows (US$ bn) 21.5 29.8 61.6 21.3 60.1 (Apr-Feb) -
FDI (US$ bn) 9.0 22.8 34.4 35.2 33.1 (Apr-Feb) -
GDRs/ADRs (US$ bn) 2.6 3.8 6.6 1.2 3.2 (Apr-Feb) -
FIIs (net) (US$ bn) 9.9 3.2 20.3 -15.0 23.8 (Apr-Feb) -
FDI Outflows (US$ bn) (Actual) 6.1 13.1 18.7 15.9 8.4 (Apr-Dec) -
Memo Items: 2006 2007 2008 2009e 2010P 2011P
Global GDP (% change) 5.1 5.2 3.0 -0.6 4.2 4.3
World Merch. Trade (Vol., % change) 8.8 6.5 2.4 -11.8 8.0 6.2
Source : Economic Survey, Various issues; Union Budget 2009-10, RBI Monthly Bulletin, Annual Report & Weekly Statistical Supplement;
Ministry of Finance; Ministry of Commerce & Industry; CSO; Institute of International Finance (IIF); EIU; NASSCOM; WEO, IMF.
$ Short term debt coverage increased beginning with the quarter ended March 2005, with the inclusion of (i) suppliers' credits up to 180
days and (ii) investment by Foreign Institutional Investors (FII) in short-term debt instruments.
e
estimates; - Not available; ^ Growth over corresponding period of previous year; ~ IMF's projections for 2010.
P Projections. * Prime Minister's Office Projections, February 2010. # RBI's projections.
Note: Debt-service ratio is the proportion of gross debt service payments to External Current Receipts (net of official transfers).
Updated on May 6, 2010